
Market Overview
| Study Period | 2020 - 2031 |
|---|---|
| Forecast Data Period | 2026 - 2031 |
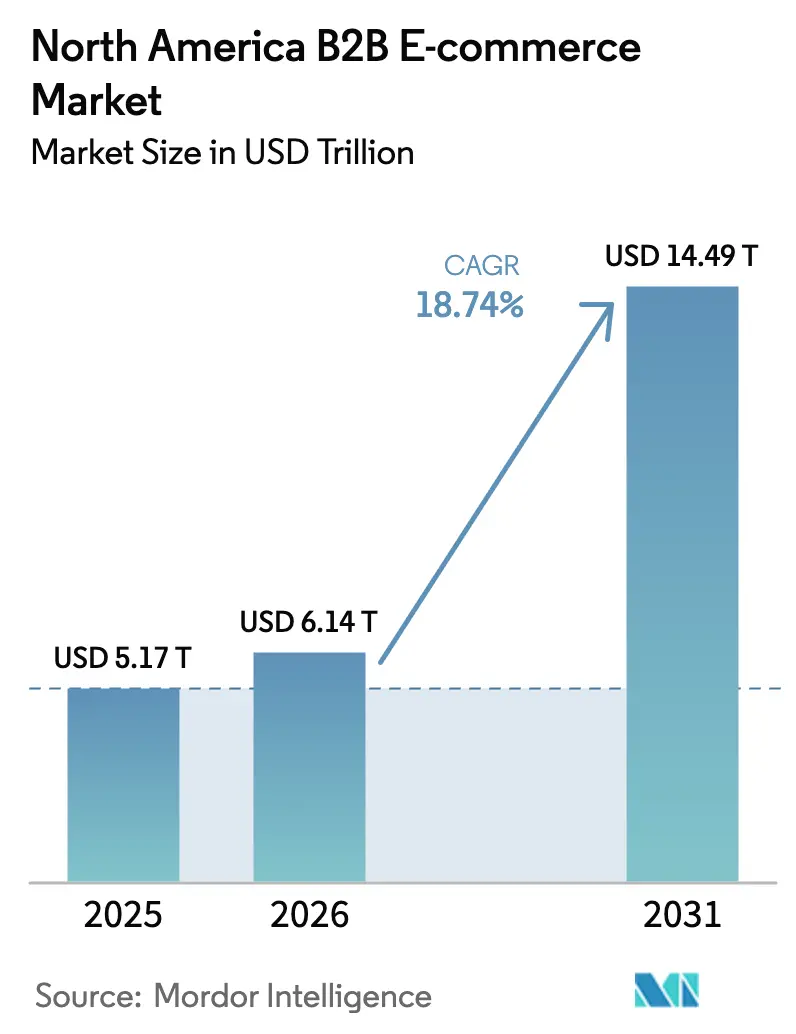
| Base Year Market Size (2025) | USD 5.17 Trillion |
| Market Size (2026) | USD 6.14 Trillion |
| Market Size (2031) | USD 14.49 Trillion |
| Growth Rate (2026 - 2031) | 18.74 % |
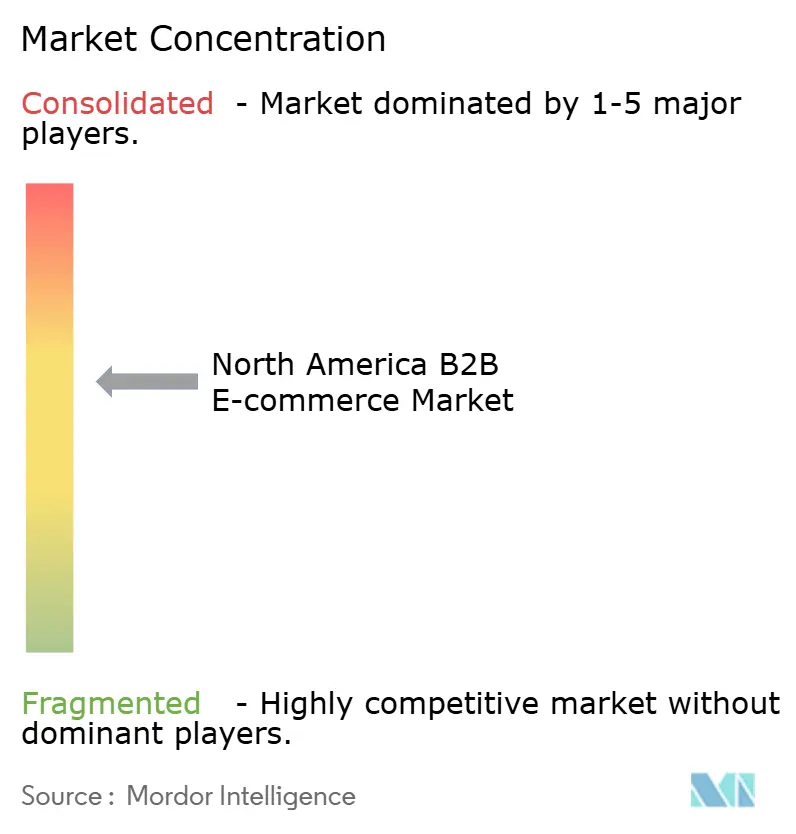
| Market Concentration | Medium |
Major Players *Disclaimer: Major Players sorted in no particular order Image © Mordor Intelligence. Reuse requires attribution under CC BY 4.0. | |
North America B2B E-commerce Market Analysis by Mordor Intelligence
North America B2B E-commerce market size in 2026 is estimated at USD 6.14 trillion, growing from 2025 value of USD 5.17 trillion with 2031 projections showing USD 14.49 trillion, growing at 18.74% CAGR over 2026-2031. Growth is propelled by widescale digital transformation, stronger cloud and 5G connectivity, and mounting pressure on procurement teams to cut cycle times and lower total cost of ownership. A sharp rise in cross-border trade under USMCA, rapid uptake of embedded finance, and the spread of AI-driven product discovery tools are further accelerating channel migration. Competitive intensity is increasing as platform operators recalibrate fee structures, while rising cyber-risk and warehouse capacity constraints temper the overall trajectory. Against this backdrop, the North America B2B e-commerce market continues to offer sizable white-space opportunities in vertical specialization, cross-border enablement, and payment innovation.
Key Report Takeaways
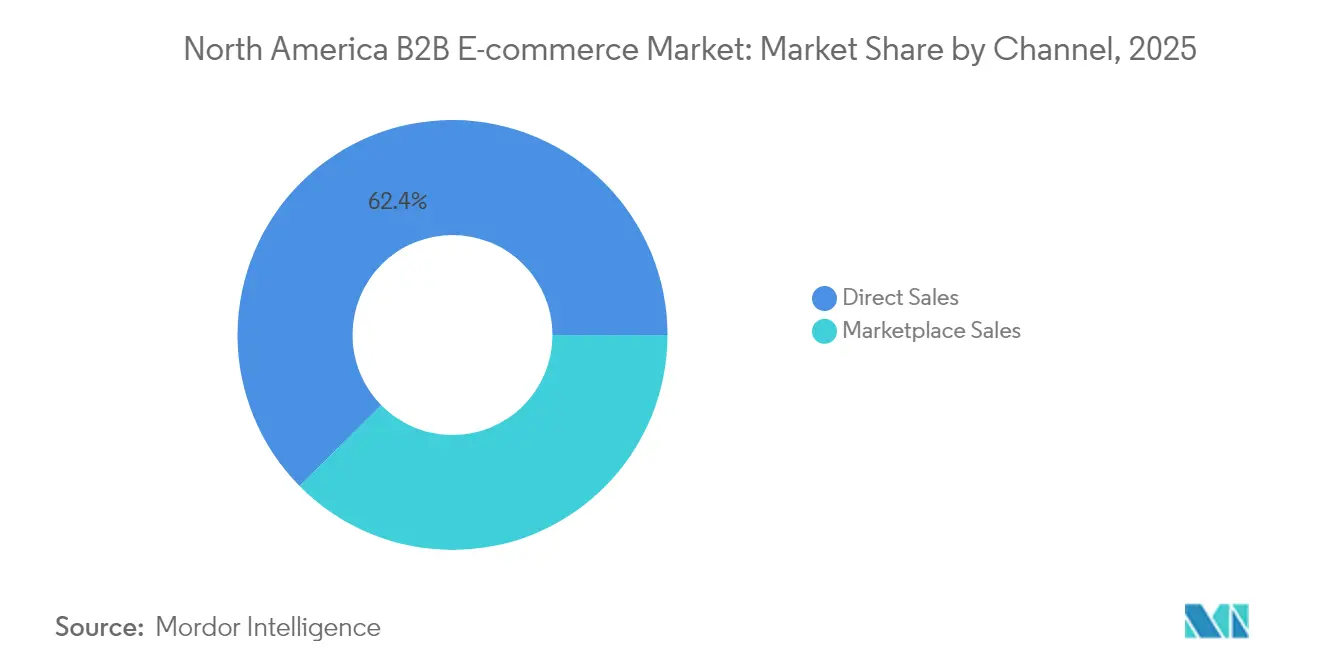
- By channel, direct sales held 62.40% of the North America B2B e-commerce market share in 2025, whereas marketplaces are forecast to scale at 20.95% CAGR through 2031.
- By industry vertical, manufacturing led with 41.20% revenue share in 2025; healthcare and life sciences is projected to expand at a 22.35% CAGR to 2031.
- By transaction model, domestic flows captured 64.30% of the North America B2B e-commerce market size in 2025, while cross-border trade is set to grow at 19.88% CAGR between 2026-2031.
- By geography, the United States commanded 78.40% revenue share in 2025; Mexico is forecast to progress at a 21.25% CAGR through 2031.
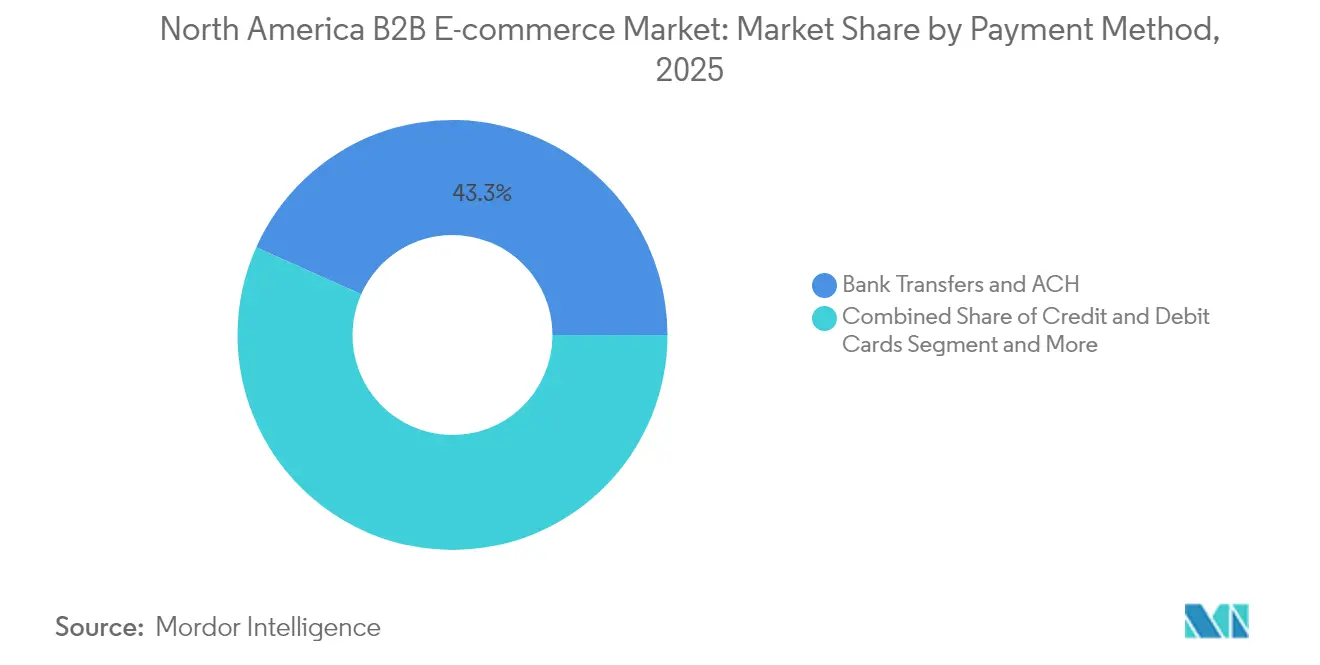
- By payment method, bank transfers and ACH represented 43.30% share of the North America B2B e-commerce market size in 2025, with alternative payments advancing at 21.75% CAGR to 2031.
Note: Market size and forecast figures in this report are generated using Mordor Intelligence’s proprietary estimation framework, updated with the latest available data and insights as of 2026.
Market Trends and Insights
Drivers Impact Analysis of North America B2B E-commerce Market*
| Driver | (~) % Impact on CAGR Forecast | Geographic Relevance | Impact Timeline |
|---|---|---|---|
| Omnichannel fulfillment preference | +4.8% | North America, with strongest adoption in US urban centers | Medium term (2-4 years) |
| Migration from EDI and fax to self-service portals | +3.8% | United States, Canada, with later adoption in Mexico | Short term (≤ 2 years) |
| Surge in marketplace adoption by mid-market firms | +3.4% | United States, with spillover to Canada | Medium term (2-4 years) |
| Procurement-cost reduction mandates | +2.9% | North America, with emphasis in manufacturing sectors | Medium term (2-4 years) |
| Embedded-finance APIs unlocking high-ticket check-out | +2.3% | United States, Canada | Medium term (2-4 years) |
| Cross-border (US-MX-CA) USMCA duty-free thresholds | +1.9% | Border regions, with emphasis on US-Mexico trade corridors | Long term (≥ 4 years) |
| Source: Mordor Intelligence | |||
Omnichannel Fulfillment Preference
Omnichannel models now define purchasing expectations as 94% of decision-makers view unified buying experiences as productive for their organizations. [4]Balance, “B2B Ecommerce Trends and How to Grow Online in 2024,” getbalance.com Integrated inventory visibility and centralized order orchestration lift order accuracy by up to 20% and trim processing times by nearly one-quarter. Industrial distributors observe that buyers often start online, consult a representative, and complete pickup at a branch, blending physical and digital hand-offs within the same transaction. Accelerated digital payment adoption accompanies this shift, with 73% of companies transitioning to electronic settlement methods to support real-time reconciliation. As omnichannel fulfillment matures, platform operators differentiate on inventory depth, last-mile reliability, and payment flexibility, giving rise to ecosystem partnerships between carriers, ERP vendors, and embedded-finance providers. The North America B2B e-commerce market, therefore, tilts towards players that can synchronize data across every interaction node without introducing process friction.
Migration from EDI and Fax to Self-Service Portals
Legacy EDI links and fax orders are giving way to modern portals as 62% of buyers prefer to self-educate online before engaging sales staff. Portal functionality has evolved to include role-based permissions, contract pricing, and tailored catalogs, mirroring complex approval hierarchies inside large enterprises. Millennial procurement professionals, now driving 73% of buying decisions, expect consumer-grade speed and transparency, accelerating portal adoption. Organizations that deploy robust portals report double-digit cuts in administrative overhead and measurable decreases in Maverick spend. Short implementation timelines, often under six months when leveraging composable commerce, further catalyze upgrade cycles. Strong early traction in the United States and Canada suggests near-term upside for solution providers able to integrate portal workflows directly into ERP and inventory systems.
Surge in Marketplace Adoption by Mid-Market Firms
Marketplace adoption among mid-market companies is reshaping distribution economics, with marketplace sales growing 2.5 times faster than direct e-commerce alternatives. Amazon Business alone processed USD 25 billion in 2025 sales, expanding seller networks to more than 5 million suppliers. Mid-market buyers cite greater assortment and faster vendor qualification as top reasons for shifting spend. The speed and transparency of these platforms are forcing traditional distributors to enhance value-added services or adopt marketplace storefronts of their own. Channel mix optimization thus becomes a strategic imperative as the North America B2B e-commerce market gravitates toward platform-centric procurement.
Procurement-Cost Reduction Mandates
Management directives to curb procurement outlays push companies to digitize purchasing. Indirect spend optimization through volume consolidation and automated approvals is delivering cost savings between 5-10% in year one. Inflationary cost pressures and supply-chain volatility intensify the drive for process transparency, making digital procurement a high-return investment. Manufacturing and healthcare operators lead adoption because purchased materials constitute more than half of operating expenses. Early savings often finance subsequent technology upgrades, producing a self-reinforcing adoption cycle that sustains momentum through 2030.
Restraints Impact Analysis of North America B2B E-commerce Market*
| Restraint | (~) % Impact on CAGR Forecast | Geographic Relevance | Impact Timeline |
|---|---|---|---|
| Cyber-attacks and data-sovereignty litigation | -3.8% | United States, Canada, with increasing impact in Mexico | Medium term (2-4 years) |
| Fragmented payment rails for Net-30/60 terms | -2.9% | North America, with particular impact on cross-border transactions | Short term (≤ 2 years) |
| Growing seller resistance to marketplace fee inflation | -2.3% | United States, with spillover to Canada | Medium term (2-4 years) |
| Warehouse-capacity crunch at inland ports | -1.5% | Major logistics hubs in United States and Canada | Short term (≤ 2 years) |
| Source: Mordor Intelligence | |||
Cyber-attacks and Data-Sovereignty Litigation
Business email compromise schemes, ransomware, and supply-chain intrusions add material risk to digital channels, with annual losses measured in billions. Heightened regulatory scrutiny, especially around health and financial data, elevates compliance costs as firms must localize sensitive records to satisfy jurisdictional rules. Security budgets are climbing 15-20% each year, yet mid-market players often lack the scale to absorb such expense, delaying platform upgrades. Class-action litigation surrounding breaches causes further hesitation among regulated industries. The policy environment, therefore, represents a meaningful drag on overall adoption, even though security-first architectures promise long-term risk mitigation.
Fragmented Payment Rails for Net-30/60 Terms
High-value B2B orders still rely on extended credit terms that common online gateways do not natively support, leading firms to run dual manual and digital processes. Reconciliation delays impair cash-flow forecasting and dilute the efficiency gains of e-procurement. Cross-border flows add currency conversion and compliance friction, raising transaction costs. While embedded-finance APIs aim to synchronize credit assessment with checkout, integration hurdles with aging ERP instances curb short-term proliferation. Until standardized solutions gain critical mass, the fragmented payment infrastructure will weigh on the growth trajectory of the North America B2B e-commerce market.
*Our forecasts treat driver/restraint impacts as directional, not additive. The impact forecasts reflect baseline growth, mix effects, and variable interactions.
North America B2B E-commerce Market Segment Analysis
By Channel:
Marketplaces Reshape Distribution DynamicsMarketplace momentum is reshaping the North America B2B e-commerce market. Direct channels retained a 62.40% share in 2025, underpinned by bespoke pricing agreements in regulated environments. Marketplaces, however, are forecast to log a 20.95% CAGR, outpacing the overall North America B2B e-commerce market size. Demand for broad assortments and rapid vendor onboarding fuels migration, particularly among mid-size manufacturers seeking scale without heavy technology investment.
Intensifying rivalry pushes legacy distributors to augment digital storefronts and explore marketplace partnerships. Many pursue a dual-track approach, selling through proprietary portals while listing commodity SKUs on leading marketplaces. As customers blend channels, 85% of firms now report multi-channel engagement strategies. The North America B2B e-commerce market therefore evolves into a hybrid network where channel choice hinges on product complexity, service expectations, and total landed cost.


By Transaction Model:
Cross-Border Commerce AcceleratesDomestic orders represented 64.30% of the North America B2B e-commerce market share in 2025, yet cross-border flows are projected to advance at 19.88% CAGR, narrowing the gap. USMCA provisions that lift de minimis thresholds lower customs friction, promoting smaller, higher-frequency shipments. Automated duty calculation and digital customs documentation further remove process hurdles.
Tariff announcements in February 2025 added a 25% levy on select goods from Canada and Mexico, prompting supply-chain re-routing and localized stockholding tactics. Platform providers integrating duty estimation and alternative routing tools stand to gain as firms navigate cost volatility. Over the forecast horizon, the North America B2B e-commerce market size in cross-border trade will hinge on policy stability, logistics modernization, and harmonized data standards.
By Payment Method:
Alternative Payments Gain MomentumBank transfers and ACH payments held a 43.30% slice of the North America B2B e-commerce market size in 2025, reflecting entrenched trust in conventional rails. Alternative payments, led by embedded-finance credit lines, BNPL, and digital wallets, are expected to surge at 21.75% CAGR. Integrated financing removes the need for separate credit vetting, shortening purchase-to-pay cycles and unlocking working-capital relief for SMB buyers.
Embedded-finance volume could reach USD 16 trillion globally by 2030, lifting platform stickiness through one-click checkout for high-ticket orders. BNPL penetration in B2B is rising from USD 14 billion in 2023 to a projected USD 687 billion by 2028. Adoption remains uneven due to ERP integration gaps and risk-management concerns, yet early movers are already recording higher average order values and lower cart abandonment. As standards coalesce, the North America B2B e-commerce market is set to converge on payment experiences that mirror B2C simplicity without sacrificing credit-term flexibility.
By Industry Vertical:
Healthcare Digitalization AcceleratesManufacturing generated 41.20% of 2025 revenue, demonstrating deep penetration of e-procurement for MRO items and direct materials. Healthcare and life sciences, while smaller today, are forecast to post a 22.35% CAGR, the fastest within the North America B2B e-commerce industry. Heightened focus on supply-chain resilience after recent disruptions has prompted hospitals and laboratories to embrace specialized platforms featuring regulatory compliance workflows and credentialed supplier catalogs.
Four megatrends—consumer-centric health management, interoperable data, B2C-like user experiences, and reinforced data security—underpin vertical growth. Payment innovation adds momentum as embedded-finance programs address reimbursement timing mismatches. The resulting expansion will gradually reduce the manufacturing sector’s dominance, diversifying revenue across a broader spectrum of industries and enhancing overall resilience in the North America B2B e-commerce market.
Geography Analysis
United States B2B E-commerce Market
The United States contributed 78.40% of 2025 revenue, benefiting from a dense supplier base and best-in-class digital infrastructure. Amazon Business and other platform leaders continue to scale, while warehouse capacity shortages in inland hubs cause fulfillment delays that spur investment in automation and micro-fulfillment centers. Digital budgets remain a priority, with 83% of U.S. B2B leaders planning to boost spending on composable commerce and AI.
Canada B2B E-commerce Market
Canada ranks second but shows a sophisticated omnichannel profile, with buyers engaging through an average of 10 touchpoints per transaction. Tariff changes introduced in early 2025 have injected uncertainty into cross-border flows, accelerating contingency planning and localized inventory positioning. Marketplace penetration among mid-market Canadian firms continues to grow as they leverage established logistics links with U.S. partners.
Mexico B2B E-commerce Market
Mexico is the fastest-growing component of the North America B2B e-commerce market, expanding at 21.25% CAGR through 2031. Manufacturing clusters near the U.S. border are digitizing procurement as part of near-shoring strategies. The USD 117 de minimis ceiling restricts small-parcel cross-border volumes, yet rising adoption of regional distribution centers offsets the limitation. Digital wallet uptake lags the northern neighbors, creating an opening for payment specialists targeting high-growth sectors like automotive and electronics.
Regulatory Landscape
Cross-border B2B e-commerce in North America is closely tied to USMCA rules, including its Chapter 19 digital trade framework, which entered a mandatory 2026 review cycle. The review keeps scrutiny on data flows, source code protections, and non-discrimination principles for digital products and services.
In the United States, U.S. Customs and Border Protection (CBP) continues to modernize trade compliance through the National Customs Automation Program (NCAP). On July 2, 2026, CBP announced a test of pipeline global interoperability standards that uses decentralized identifiers and verifiable credentials to support machine-to-machine trade data exchange. Regulatory complexity also reflects fragmented privacy and cybersecurity requirements rather than a single e-commerce statute, with state-level regimes such as California shaping governance for identity, consumer and business data handling, and automated decision-making technologies. On the trade side, the U.S. de minimis threshold change effective July 1, 2026 (reduction from USD 800 to USD 200 for shipments from China and Hong Kong) raises compliance and cost considerations for import-heavy catalogs and can affect routing and stocking decisions for platforms and sellers managing high-SKU B2B assortments.
Value Chain Analysis
The North America B2B e-commerce value chain starts with manufacturers and brand owners that publish digital catalogs, contract pricing, and product data, which feed distributors, wholesalers, and marketplaces. These channels then aggregate assortment, negotiate terms, and enable self-service buying.
The transaction layer includes storefronts and procurement portals integrated with ERP/P2P systems, while payment and credit rails (ACH/bank transfers, cards, and embedded-finance tools supporting Net-30/60 workflows) support checkout, invoicing, and reconciliation. Fraud prevention, cybersecurity, and data governance run across these steps, along with broader compliance and risk controls. Fulfillment and service execution are a major differentiator, with inventory positioned across regional DCs, branch networks, and third-party logistics, supported by last-mile carriers and returns or reverse logistics. Platform and distributor innovation is pushing deeper operational connectivity, such as Fastenal's integrated inventory management via Fastenal Managed Inventory (FMI) devices, which reported 6,993 devices signed per day in Q2 2026 and links onsite consumption signals to automated replenishment. Logistics capability is also being productized, as shown by Amazon Supply Chain Services, which provides a unified inventory pool that can fulfill orders across proprietary sites, marketplaces, and physical stores, tightening the link between commerce front ends and execution.
Competitive Landscape
Competition in the North America B2B e-commerce market blends scale advantages with niche specialization. Amazon Business, projecting USD 80 billion revenue by 2025, leverages logistics reach and rich data to win enterprise contracts. Incumbent distributors such as W.W. Grainger are ramping digital investments, reporting 75% of sales through electronic channels and using endless-assortment strategies to meet long-tail demand. Fastenal and RS Group deploy AI-guided product discovery and regional fulfillment hubs to sustain relevance.
Platform differentiation is increasingly anchored in technology. AI-driven personalization, composable commerce back-ends, and embedded-finance modules serve as critical levers for customer retention. Identity-management specialists highlight that composable adopters ship new features 80% faster, translating into quicker response to customer feedback. Niche marketplaces surface in sectors where regulatory or technical depth deters generalist platforms, for instance, medical implants or specialized chemicals.
White-space is evident in cross-border enablement, where tariff navigation and landed-cost transparency remain pain points. Integrated payment and logistics bundles are expected to gain traction, particularly among SMB exporters. Strategic acquisitions, such as RS Group’s purchase of Distrelec and Risoul, illustrate a trend toward capability consolidation to accelerate digital reach. Overall, the competitive outlook favors firms capable of coupling supply-chain control with data-driven customer engagement as the North America B2B e-commerce market matures.
North America B2B E-commerce Industry Leaders
Amazon.com Inc. (Amazon Business)
W.W. Grainger Inc.
Fastenal Company
MSC Industrial Supply Co.
Ferguson plc
- *Disclaimer: Major Players sorted in no particular order
North America B2B E-commerce Market Companies Covered in this Report
- Amazon.com Inc. (Amazon Business)
- W.W. Grainger Inc.
- Fastenal Company
- MSC Industrial Supply Co.
- Ferguson plc
- Staples Inc. (Staples Business Advantage)
- Office Depot Inc. (ODP Business Solutions)
- Walmart Inc. (Walmart Business)
- Home Depot USA Inc. (Home Depot Pro)
- Uline Inc.
- Global Industrial Company
- Thomas Publishing Company (Thomasnet)
- Alibaba Group Holding Ltd. (Alibaba.com)
- eBay Inc. (eBay Business Supply)
- Veritiv Corporation
- Parts Town LLC
- Henry Schein Inc.
- Sysco Corporation (Sysco Shop)
- C.H. Robinson Worldwide Inc. (Freightquote)
- Newegg Commerce Inc. (Newegg Business)

Market Opportunities and Future Outlook
White space is emerging where B2B platforms can combine commerce, credit terms, and logistics into fewer steps for buyers and sellers, especially for high-SKU categories and repeat procurement. Amazon Supply Chain Services provides evidence of this direction, as the company launched it in May 2026 and opened its logistics network to external businesses, enabling inventory and fulfillment that can support multiple channels. This broadens the addressable opportunity for software and service providers that integrate order orchestration, freight options, and landed-cost transparency into portals and marketplaces aligned with USMCA trade corridors.
Operational digitization in distribution also points to opportunities in managed inventory, product discovery, and data-driven selling tools that reduce procurement friction and improve availability. Fastenal reported digital sales at 61.6% of total sales in Q2 2026, and it raised 2026 capital expenditure guidance to USD 310 million to USD 330 million to expand hub capacity and IT infrastructure. That guidance suggests continued investment in the infrastructure supporting online-first ordering and fulfillment. In vertical and category expansion, Ferguson's announced USD 1.6 billion acquisition of FloWorks (July 2026) highlights consolidation around specialized flow-control and non-residential capabilities, which supports B2B e-commerce experiences that embed technical configuration, compliance documentation, and service-led fulfillment rather than commodity-only listings.
Recent Industry Developments in North America B2B E-commerce Market
- July 2026: Amazon to penalize sellers for deliveries outside business hours starting September 2026 via BHDR metric; pallet delivery feature for Fulfilled by Merchant orders expanded after a pilot. The change tightens service level for direct B2B shipments and broadens delivery options, reinforcing Amazon Business as a logistics ready platform.
- July 2026: Amazon expands B2B pallet delivery options for Fulfilled by Merchant orders following seller pilot adoption. This expands delivery formats and logistics flexibility for large buyers, improving fulfillment options and speed. It strengthens Amazon Business value proposition and may increase competitive pressure on rivals' logistics offerings.
- June 2026: Grainger highlights AI expansion into core ecommerce infrastructure, including search and merchandising enhancements, at industry forum. The initiative signals direct AI deployment in ecommerce operations. It supports Grainger's digital moat and improves conversion with AI-driven experiences.


North America B2B E-commerce Market Report Scope and Research Methodology
Market Definition and Coverage
For this report, the market is defined as the value of business to business transactions completed through digital ordering channels in North America, including website, app, EDI, and marketplace led ordering where the buyer is an organization.
Scope exclusions: We exclude consumer purchases, informal peer to peer resale, and non commerce digital activity such as marketing, browsing, or lead generation that does not convert into an order.
Segments Covered in This Report
- By Channel
- Direct Sales
- Marketplace Sales
- By Transaction Model
- Domestic
- Cross-border
- By Payment Method
- Bank Transfers and ACH
- Credit and Debit Cards
- Other Payment Methods
- By Industry Vertical
- Manufacturing
- Retail and Wholesale
- Healthcare and Life Sciences
- Automotive
- Construction and Building Materials
- Other Industry Verticals
- By Geography
- United States
- Canada
- Mexico
Data Sources, Market Sizing, and Validation
Desk Research
Desk work starts by building the demand context and the accounting rules for what counts as a B2B ecommerce transaction. Public sources were reviewed to anchor macro signals and digital commerce adoption, such as U.S. Census Bureau ecommerce and business sales series, Statistics Canada wholesale and manufacturing tables, Mexico INEGI economic statistics, and the OECD digital economy and trade indicators.
To shape assumptions that are hard to see in official data, we also read company filings and investor decks, trade association releases (including manufacturing, wholesale, and logistics bodies), reputable press coverage, and peer reviewed papers on procurement digitization and EDI usage. A paid subscription for company financials and news intelligence was used selectively to cross check revenue exposure, while a patent database was used to spot where workflow automation and ecommerce tooling investment is concentrated. The sources listed here are illustrative, and many other public references were used to collect, validate, and clarify data points.
Primary Interviews and Surveys
Primary interviews and surveys were used to pressure test the scope and translate desk inputs into usable sizing assumptions, especially where public data is reported at a broader ecommerce level. We spoke with stakeholders across suppliers, distributors, procurement teams, and enabling service providers, and then we used follow ups to confirm what is counted as an ecommerce order versus a digitally influenced sale. Coverage included the United States, Canada, and Mexico.
Distribution of primary research fieldwork respondents
| Company type | Respondent position |
|---|---|
| Top tier: 28% | CXOs: 12% |
| Mid tier: 58% | Functional/Unit leaders: 31% |
| Smaller Players: 14% | Managers: 57% |
Market-Sizing & Forecasting
Sizing begins with a top down build where regional business sales pools and ecommerce penetration signals are used to reconstruct the addressable B2B ecommerce value by country, and then by industry ordering intensity. To keep the model grounded, we corroborate totals with selective bottom up checks, including sampled supplier and distributor digital order exposure, channel checks on marketplace led ordering, and ASP times order volume logic for common reorder categories where data is available.
Inputs used in the model include the share of procurement executed online versus offline, the mix of EDI versus web storefront ordering, average order value direction by major buying industries, cross border trade activity that triggers digital documentation, and payment terms behavior that influences when orders are booked. Where gaps appear in bottom up approximations for smaller players, we apply conservative coverage factors based on interview feedback and observed channel structure rather than forcing a full roll up.
For forecasting, scenario analysis is used with a base case that ties adoption to practical drivers such as digital procurement mandates, fulfillment capacity, and buyer migration to self serve ordering. Growth rates are reviewed against country level macro views and then adjusted using expert consensus on how fast offline orders are realistically shifting online.
Data Validation & Update Cycle
Outputs are validated through triangulation across independent signals, and then checked for variances that do not match known industry behavior, such as sudden penetration jumps that would require unrealistic supplier onboarding. When anomalies show up, assumptions are re worked and the relevant experts are re contacted so the reasoning is consistent across countries and end user types.
Before sign off, the model and write up go through multi step analyst review, including arithmetic checks, unit consistency, and currency timing checks. Reports are refreshed annually, and interim updates are made when material changes in buyer behavior or ordering infrastructure occur, after which a final pre delivery pass is completed to provide the latest view.
Mordor Intelligence's North America B2b Ecommerce Market Size Compared With Other Published Estimates
Published numbers for North America B2B ecommerce vary because authors do not always count the same transaction types, geographies, or ordering channels. They also pick different base years and currency timing. The table below summarizes how the spread looks when the same topic is sized with different boundaries.
Key gaps usually come from whether an estimate is U.S. only or truly North America, whether it is limited to manufacturing and distribution flows, and whether it treats EDI and marketplace orders as part of ecommerce value. Forecast paths can also diverge when one study applies aggressive penetration lifts without checking supplier readiness, payment terms, and cross border documentation friction.
Benchmark comparison
| Source | Market Size | Gaps in Research Methodology |
|---|---|---|
| Mordor Intelligence | USD 5.17 T (2025) | |
| Trade Journal A | USD 2.64 T (2024) | Reported as U.S. B2B ecommerce sales and tied to manufacturing and distribution coverage, so it can undercount Canada and Mexico and omit B2B categories outside those flows. |
| Trade Journal B | USD 2.61 T (2024) | Uses a projection based on U.S. quarterly signals, which can miss North America wide scaling effects and can treat ecommerce sales as a narrower subset depending on what channels are included. |
The table shows a wide range mainly because the U.S. only figures sit below a full regional view, and in Mordor Intelligence's model the scope covers North America (United States, Canada, and Mexico) and counts B2B transactions across digital ordering routes rather than limiting the view to one part of the supply chain. With that scope locked, the final value is built from repeatable penetration and demand drivers, and then cross checked using interview based reality checks so the forecast does not outrun what users say they can implement.


Key Questions Answered in the Report
What is the current value of the North America B2B e-commerce market?
The market is valued at USD 6.14 trillion in 2026 and is projected to reach USD 14.49 trillion by 2031.
Which sales channel is growing fastest within the market?
B2B marketplaces are expanding at a 20.95% CAGR, outpacing direct e-commerce channels.
How important is cross-border trade to market growth?
Cross-border transactions are forecast to grow at 19.88% CAGR to 2031, driven by USMCA provisions and logistics digitization.
Why are alternative payment methods gaining traction?
Embedded-finance, BNPL, and digital wallets simplify credit management and reduce settlement friction, leading to a 21.75% CAGR for alternative payments.
Which industry vertical is expected to grow quickest?
Healthcare and life sciences are projected to register a 22.35% CAGR as specialized platforms address regulatory and workflow needs.
What are the main restraints limiting market expansion?
Cyber-attacks paired with data-sovereignty litigation and fragmented payment rails for extended credit terms collectively reduce the forecast CAGR by nearly 7 percentage points.
Page last updated on:


 Your data is secure and never sold or shared.


