
Market Overview
| Study Period | 2020 - 2031 |
|---|---|
| Forecast Data Period | 2026 - 2031 |
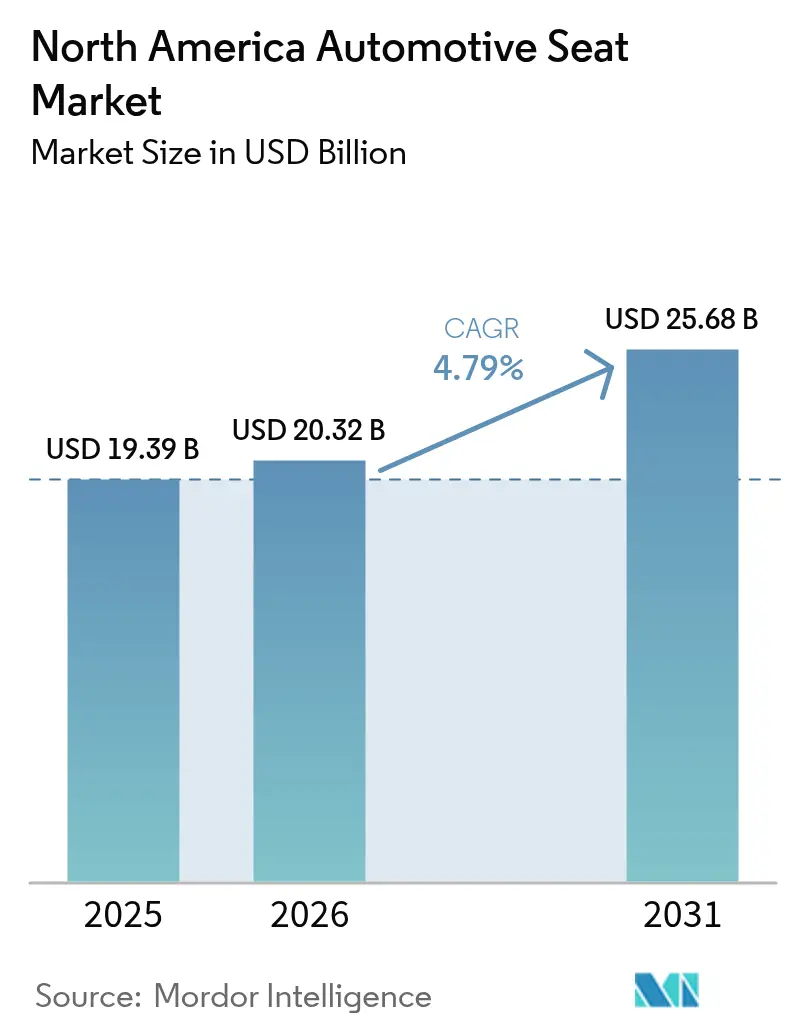
| Base Year Market Size (2025) | USD 19.39 Billion |
| Market Size (2026) | USD 20.32 Billion |
| Market Size (2031) | USD 25.68 Billion |
| Growth Rate (2026 - 2031) | 4.79 % |
| Market Concentration | Medium |
Major Players *Disclaimer: Major Players sorted in no particular order Image © Mordor Intelligence. Reuse requires attribution under CC BY 4.0. | |
North America Automotive Seat Market Analysis by Mordor Intelligence
The North American automotive seat market size is expected to grow from USD 19.39 billion in 2025 to USD 20.32 billion in 2026 and is forecast to reach USD 25.68 billion by 2031 at 4.79% CAGR over 2026-2031. The expansion is propelled by premium SUV and pickup demand, electrification mandates that reshape interior architectures, and supplier investments in AI-enabled production that shorten lead times. Advanced comfort functions—ventilation, heating, and massage—are moving from luxury nameplates into mid-range trims, expanding the value pool. At the same time, USMCA rules accelerate near-shoring of sub-assemblies, giving regional suppliers an edge over more distant competitors. Persistent semiconductor constraints and tightening PFAS regulations temper the pace of powered-seat adoption and spur design innovation in lightweight mechatronics and compliant foams.
Key Report Takeaways
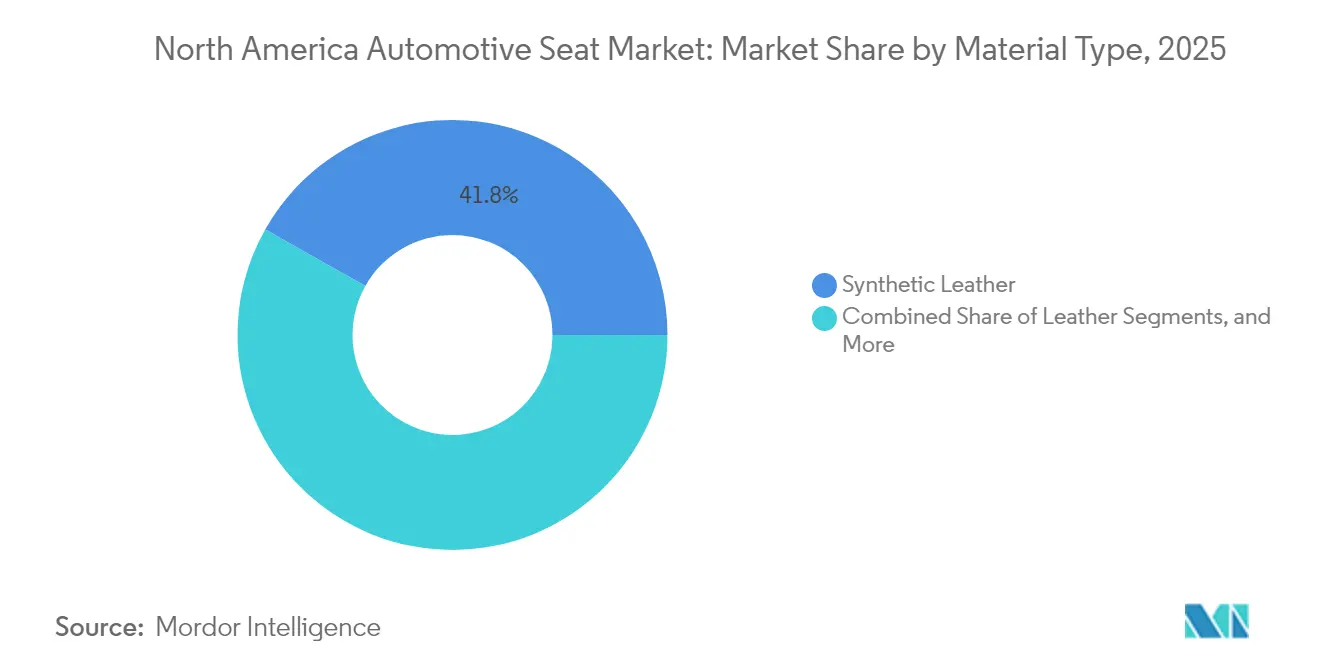
- By material type, synthetic leather led with 41.83% of the North America automotive seat market share in 2025; genuine leather is advancing at a 7.38% CAGR through 2031.
- By technology, standard seats accounted for a 61.85% share of the North America automotive seat market size in 2025, while massage and wellness variants are expanding at a 6.21% CAGR to 2031.
- By vehicle type, passenger cars captured 73.60% of the North America automotive seat market in 2025, yet light commercial vehicles posted the fastest 6.92% CAGR to 2031.
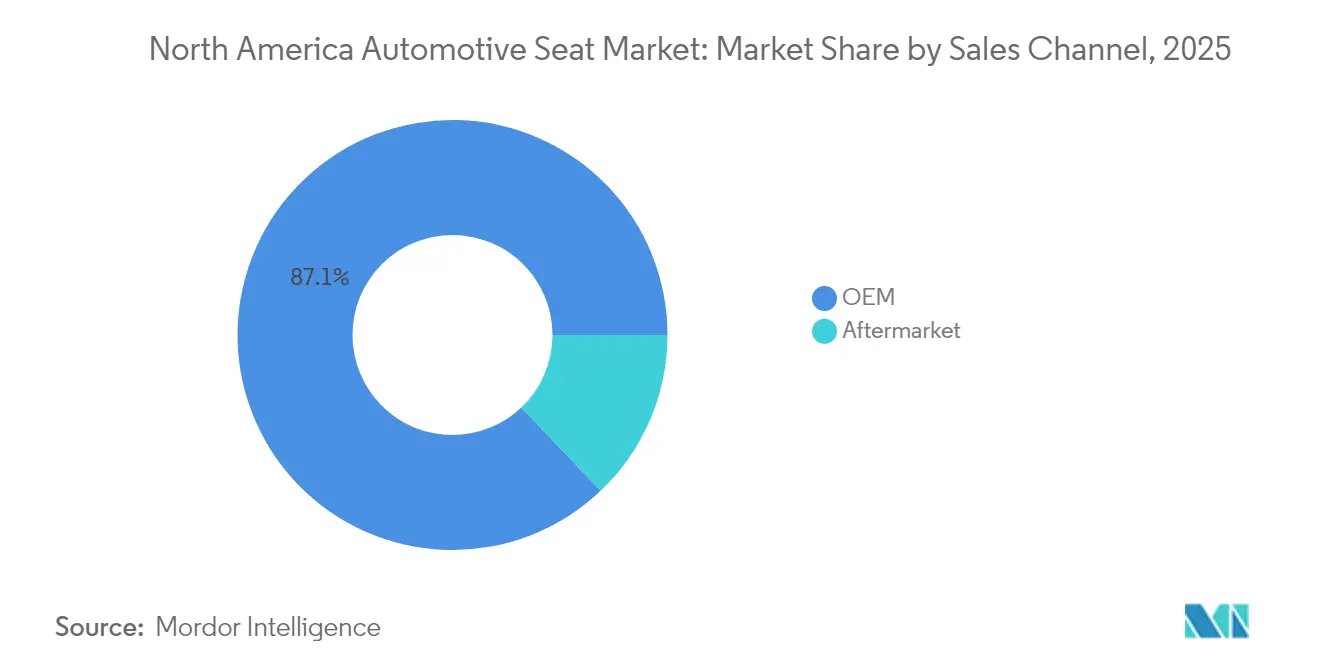
- By sales channel, OEM fitment held 87.10% of the North America automotive seat market size in 2025; the aftermarket is growing at a 7.52% CAGR through 2031.
- By powertrain, ICE models still accounted for 86.55% of the North America automotive seat market in 2025, but battery-electric vehicles recorded a 7.15% CAGR through 2031.
- By price band, mid-range trims dominated, with 51.70% of the North America automotive seat market in 2025, whereas luxury trims grew at a 6.72% CAGR through 2031.
- By country, the United States controlled 84.90% of the North America automotive seat market size in 2025; Mexico posts the quickest 7.05% CAGR through 2031.
Note: Market size and forecast figures in this report are generated using Mordor Intelligence’s proprietary estimation framework, updated with the latest available data and insights as of 2026.
North America Automotive Seat Market Trends and Insights
Drivers Impact Analysis*
| Driver | (~) % Impact on CAGR Forecast | Geographic Relevance | Impact Timeline |
|---|---|---|---|
| Premium SUV and Pickup Demand For Ventilated Seating | +1.2% | United States and Canada; spillover to Mexico luxury | Medium term (2-4 years) |
| Comfort Features Migrating to Mid-Segment Vehicles | +0.9% | North America core markets; Mexico premium | Medium term (2-4 years) |
| OEM Lightweighting Favoring Synthetic and Bio-Based Materials | +0.8% | Global; early United States. adoption | Long term (≥ 4 years) |
| USMCA Driving Near-Shoring of Seat Sub-Assemblies | +0.7% | United States–Mexico border; Canada secondary | Short term (≤ 2 years) |
| AI-Enabled JIT Mass-Customized Production Lines | +0.6% | Michigan, Ontario, Nuevo León | Long term (≥ 4 years) |
| Municipal EV Mandates Boosting Ultralight Seat Demand | +0.5% | California; Northeast expansion | Medium term (2-4 years) |
| Source: Mordor Intelligence | |||
Shift Toward Premium SUVs and Pickups Boosting Demand for Powered, Ventilated Seating
Premium truck-based nameplates now integrate 30-way adjustment, active massage, and climate-control features that command higher transaction values. Lincoln’s Navigator Perfect Position seats and Ford’s Active Motion massage illustrate how comfort innovation reduces driver fatigue[1]. Full-size pickup registrations keep rising across North America, magnifying seat-content growth opportunities for vendors able to deliver premium functions at mainstream price points.
Integration of Advanced Comfort Functions in Mid-Segment Vehicles
Lear’s ComfortMax, debuting with GM in Q1 2025, heats or cools 40% faster with 50% fewer parts, proving that modular design shrinks bill-of-material cost [2]. Magna’s FreeForm trim, already specified for four new 2025 models, delivers high concavity and 50% recycled back-panel content. Vitesco pinpoints 48V architectures and power-over-Ethernet harnesses as enablers for energy-intensive seat features without bulky wiring. As consumers equate wellness with mobility, massage and thermal functions become necessary in mid-price vehicles.
OEM Lightweighting Targets Accelerating Adoption of Synthetic and Bio-Based Seat Materials
The automotive seating industry is transforming due to regulatory pressures and sustainability goals. Lightweight carbon-fiber seat backs reduce component mass, while bio-based foams from suppliers like Woodbridge scale eco-friendly materials for industrial use. Innovations from Covestro and Bcomp, such as low-carbon polyurethane and flax-based composites, cut lifecycle emissions by nearly 50%. With stricter emissions standards, OEMs are prioritizing curb-weight reduction. This urgency accelerates R&D timelines as seating suppliers meet stringent quality standards like IATF 16949. Success depends on balancing crash safety with environmental compliance, favoring firms that innovate quickly without compromising performance.
Municipal EV Fleet Mandates Driving Demand for Ultralight Commercial-Vehicle Seats
California’s rule for 50% zero-emission fleet purchases by 2024 and 100% by 2027 shapes a specialized seat market valuing weight savings and sustainable materials. FORVIA’s truck seat trims CO₂ using NAFILean Vision composites and Ecorium vegan upholstery [3]. As northeastern states replicate CARB protocols, commercial fleets seek modular designs that support 24/7 duty and simplified maintenance.
Restraints Impact Analysis*
| Restraint | (~) % Impact on CAGR Forecast | Geographic Relevance | Impact Timeline |
|---|---|---|---|
| Leather and Petrochemical Volatility Inflating BOM Costs | -0.9% | Global; United States luxury concentration | Short term (≤ 2 years) |
| Semiconductor Shortages Crimping Powered-Seat Output | -0.7% | North America; Asia-centric supply | Medium term (2-4 years) |
| PFAS / VOC Rules Raising Foam Compliance Spend | -0.6% | United States; Canada extension | Long term (≥ 4 years) |
| Skilled-Labor Shortages and Wage Hikes At JIT Plants | -0.4% | Michigan, Ontario, Northern Mexico | Medium term (2-4 years) |
| Source: Mordor Intelligence | |||
Leather and Petrochemical Price Volatility Inflating BOM Costs
Synthetic leather uses polyurethane derived from oil-based feedstocks, tying seat economics to crude swings. Genuine hides track livestock cycles and environmental constraints. OEM price-freeze contracts force suppliers to hedge or absorb volatility, tightening margins. Start-ups like Rheom offer bio-based leather to stabilize input costs, but validation and scale remain hurdles.
Semiconductor Shortages Limiting Powered-Seat Output
Due to allocation constraints on motor control units, position sensors, and rare-earth magnets, manufacturers must temporarily switch to manual adjusters. This change reduces the functionality and convenience of powered seats, which serve as a significant selling point in modern vehicles. Moreover, premium trims face difficulty sustaining market appeal when features like massage or memory functions are excluded. These exclusions lower the perceived value of premium offerings and threaten revenue streams, as consumers may choose lower trims or competing brands with better feature sets.
*Our forecasts treat driver/restraint impacts as directional, not additive. The impact forecasts reflect baseline growth, mix effects, and variable interactions.
Segment Analysis
By Material Type: Premium Gains Within Synthetic Dominance
Synthetic leather retained the largest 41.83% slice of the North America automotive seat market in 2025, underscoring its cost benefit and animal-free appeal. Nevertheless, genuine leather is the fastest-rising material, charting a 7.38% CAGR through 2031 as luxury SUV and pickup buyers equate authenticity with status. Suppliers hedge volatility by trialing bio-based polymers that meet durability metrics without PFAS additives. Rheom’s plant-based surfaces illustrate how sustainability and premium cues can converge.
The North American automotive seat market size tied to genuine leather is projected to expand at the segment-leading pace, encouraging tanners to localize finishing operations under USMCA. Fabric remains prevalent in entry cars and vocational trucks, while polyurethane foams evolve toward low-VOC blends to satisfy California regulations. Magna’s FreeForm back panels, embedding up to 50% recycled plastic, highlight how material innovation underpins design freedom and regulatory compliance.

By Technology Type: Wellness Seats Extend Beyond Luxury
Standard manual units hold 61.85% share of the North America automotive seat market in 2025; fleet buyers prize simplicity and uptime. Massage and wellness seats will clock a 6.21% CAGR to 2031, reflecting demographic trends and heightened health awareness. Lear’s ComfortMax module fuses rapid-response micro-climate control with massage nodes, shrinking packaging to fit mid-size crossovers.
The North American automotive seat market share for powered, heated, and cooled configurations widens as 48V networks proliferate, letting OEMs avoid heavy-gauge wiring. Vitesco’s power-over-Ethernet approach reduces harness mass, aiding lightweighting goals. As wellness features normalize, tier-one suppliers pivot toward software-defined seat controllers capable of over-the-air function upgrades, opening aftermarket revenue streams.
By Vehicle Type: Passenger Scale, Commercial Velocity
Passenger cars commanded a 73.60% share of the North America automotive seat market in 2025, reflecting their dominance of the region’s installed base even as crossover and SUV body styles swell within the category. The North American automotive seat market size tied to passenger applications grows steadily because interior differentiation—ventilated cushions, digital controls—remains an OEM battleground. Full-size pickups, classified under passenger vehicles, further skew value content upward due to large-format frames and premium trim take rates. In contrast, heavy commercial vehicles and transit buses generate smaller absolute volumes but demand high-durability seating that commands premium pricing.
Light commercial vehicles are the sprint leader with a 6.92% CAGR through 2031, spurred by e-commerce logistics, municipal EV mandates, and last-mile delivery start-ups. FORVIA’s CO₂-reduced truck seat shows how commercial electrification prizes ultralight frames and modular maintenance access. As delivery operators value the total cost of operation, quick-swap cushions and washable trim gain favor, altering the specification mix. Suppliers that tailor ergonomic designs to multi-shift duty cycles stand to capture disproportionate margins in this fast-moving sub-segment.
By Sales Channel: Factory Control, Aftermarket Upside
OEM fitment captured 87.10% share of the North America automotive seat market in 2025, underscoring tight integration between seat modules and vehicle electrical architectures. Automakers lock in suppliers early, demanding just-in-sequence deliveries that satisfy stringent traceability and warranty standards. Hardware-software coupling—memory profiles stored in central gateways—further cements the OEM channel’s dominance because retrofitting these features post-sale is rarely cost-effective. Nonetheless, the aging vehicle fleet and consumer appetite for comfort upgrades seed a robust replacement market for trim covers, heating pads, and foam kits.
The aftermarket grows fastest at 7.52% CAGR through 2031, as owners extend vehicle lifecycles and gig-economy drivers invest in personal comfort. E-commerce platforms simplify SKU discovery and comparison, fueling price transparency and category penetration. Seat suppliers partner with certified repair chains to offer retrofit massage inserts that connect via 12 V power, reducing installation complexity. Regulation also nudges growth: fleet safety audits increasingly score driver ergonomics, prompting seat replacements that cut injury claims.
By Powertrain: ICE Scale, Electric Momentum
Internal-combustion vehicles still account for 86.55% share of the North America automotive seat market in 2025, underscoring the gradual nature of the propulsion transition. The North American automotive seat market share within ICE platforms remains sizable because legacy model programs extend well into the 2030s. Seat engineers emphasize lightweight frames and thin foams to compensate for more rigid U.S. fuel-economy rules, but packaging remains familiar. Battery-electric vehicles, however, post a class-leading 7.15% CAGR through 2031, as expanding charging infrastructure and tax credits nudge adoption upward. EV skateboard chassis free interior volume, letting suppliers propose lounge layouts with swivel bases and ottoman extensions.
New thermal-management demands accompany BEVs: HVAC inefficiencies penalize range, so climate-controlled seating migrates earlier in trim ladders. Yanfeng’s Smart Cabin Seat integrates displays and steer-by-wire input to eliminate instrument panels, previewing cockpit consolidation trends. Hybrid and fuel-cell variants lag in growth but keep niche relevance, each imposing unique weight and integration rules. Suppliers capable of modular architectures that flex between powertrains without retooling win program synergies and lower capex.
By Price Band: Mid-Range Volume, Luxury Acceleration
Mid-range trims owned a 51.70% share of the North America automotive seat market in 2025, matching North American buyer preference for well-equipped vehicles that balance features against affordability. OEMs load these models with heated cushions and power recline, ensuring baseline differentiation. Cost-optimized luxury cues—contrast stitching, soft-touch bolsters—allow suppliers to repurpose premium look-and-feel at lower BOM. At the other extreme, luxury nameplates accelerate at a 6.72% CAGR through 2031 as affluent households chase premium SUVs and pickups equipped with multi-mode massage, winged headrests, and reclining rear lounges.
Luxury growth has multiplier effects: authentic leather recovers share, recirculating lumbar bladders and active axis tilting raise actuator content, and glass-cockpit integration shifts control interfaces to touch-sensitive door panels. Economy segments stay steady, primarily servicing fleet and value niches where durability outweighs comfort. Price-band polarization pushes suppliers to develop scalable platforms: a standard metal frame with upgradeable foam and trim kits lowers tooling amortization while preserving brand-specific aesthetics.
Geography Analysis
The United States captured an 84.90% share of the North America automotive seat market in 2025, benefiting from the country’s high content per vehicle and robust pickup sales. Michigan and Kentucky anchor engineering hubs that co-locate with OEM final assembly, cementing supplier relationships. The North American automotive seat market size, attributable to the demand in the United States, will keep growing, yet its CAGR lags Mexico because of saturation.
Mexico registers a brisk 7.05% CAGR through 2031, as Chinese OEMs and tier-twos rush to establish USMCA-compliant capacity. Shanghai Daimay’s Ramos Arizpe facility and three forthcoming plants in Parras de la Fuente epitomize this inflow. Logistics upgrades across Laredo and Otay Mesa expedite seat-set flow into the United States assembly plants, narrowing delivery windows and widening the country’s cost advantage.
Canada maintains steady volume backed by integrated supply chains and parallel regulatory frameworks. Ontario’s push into AI-based manufacturing aligns with provincial incentives for automation retrofits, allowing seat suppliers to offset higher labor costs. Cross-border harmonization of safety standards ensures Canadian plants can feed U.S. and Mexican OEM lines with minimal revalidation effort.
Regulatory Landscape
In the United States, automotive seating is governed by the National Highway Traffic Safety Administration (NHTSA) through Federal Motor Vehicle Safety Standards (FMVSS) that directly affect seat structures and their integration with restraint systems, including FMVSS 207 (seating systems), FMVSS 208 (occupant crash protection), FMVSS 209 (seat belt assemblies), and FMVSS 210 (seat belt anchorages). These rules shape design validation (static and dynamic strength, anchorage performance) and require coordination between seat frames, tracks, airbags, and belt systems at OEM launch timing.
Regulatory change in the 2026 window adds feature and compliance complexity for seat and trim suppliers. NHTSA updates to FMVSS 208 introduce new requirements for seat belt reminder systems, with front-row requirements that must be met by September 1, 2026, influencing HMI integration and wiring architectures that often route through the seat and center electronics. Separately, FMVSS 213b becomes mandatory on December 5, 2026, raising requirements for child restraint system interaction with vehicle seating and increasing the importance of seat geometry consistency, anchorage interfaces, and test documentation across North American platforms.
Value Chain Analysis
The North American automotive seat value chain begins with upstream materials and components, including steel and aluminum for frames and tracks, polyurethane foam chemicals (polyols and isocyanates), trim (synthetic leather, fabric, leather), and electronics (motors, sensors, control modules, heating and ventilation elements). Polyurethane feedstocks are concentrated around U.S. Gulf Coast chemical production, which creates exposure to weather-related disruption, while electronics availability can constrain powered and wellness seat output. Tier suppliers increasingly combine mechanical assemblies with mechatronics and trim technologies to meet OEM demand for heated, ventilated, and massage functions while managing bill-of-material volatility.
Tier-one suppliers assemble complete seat systems and deliver just-in-sequence to OEM plants, often operating within tight logistics radii that favor footprints in the U.S. Midwest, Ontario, and Northern Mexico. USMCA-linked cross-border flows are common, with subassemblies and trim components moving between the United States, Mexico, and Canada for cost and sequencing advantages. Recent supplier actions such as Lears automated manufacturing investment near GM Orion Assembly and Adients move to expand in-house foam capability underscore a shift toward localization and vertical integration to stabilize lead times and reduce single-point supplier risk in a JIT environment.
Competitive Landscape
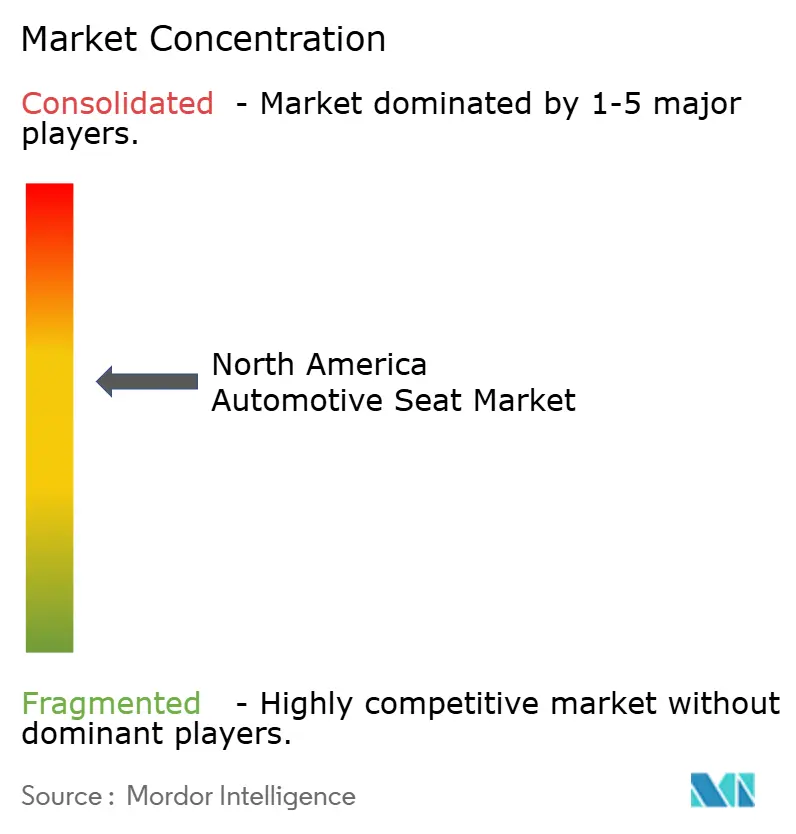
The North American automotive seat market shows a moderate level of concentration. With their long-standing industry presence, Adient, Lear, and FORVIA have secured global purchase agreements. Lear integrates electronics, combining seat controls with thermal and massage features. Adient focuses on modular metal-frame architectures that are adaptable from compact to full-size vehicles. FORVIA prioritizes sustainability, introducing a truck seat that reduces cradle-to-gate CO₂ emissions using NAFILean Vision composite structures.
Magna International, leveraging its expertise in cockpit systems, offers integrated seating, doors, and console modules. Disruptive players like China's Daimay use Mexican factories to undercut established players on pricing and localization. Additionally, software startups specializing in seat-based biometric monitoring have become prime acquisition targets for tier-one companies eyeing data-centric services. While high barriers to entry exist, including IATF 16949, ISO 14001 standards, and OEM warranty liabilities, niche players find relief as AI-driven design tools simplify prototyping challenges.
North America Automotive Seat Industry Leaders
-
Adient PLC
-
Lear Corporation
-
Toyota Boshoku Corporation
-
Faurecia SE (FORVIA)
-
Magna International Inc.
- *Disclaimer: Major Players sorted in no particular order
Market Opportunities and Future Outlook
Localization and vertical integration create clear opportunity for suppliers that can secure stable subcomponent supply while meeting faster program cadence and customization needs. Adients April 2026 acquisition of the Romulus, Michigan foam plant from Woodbridge highlights a pathway to control a critical input and reduce exposure to external foam allocation or logistics disruption, while also enabling tighter process tuning for low-VOC and performance targets. At the assembly level, Lears April 2026 move to open a new seating plant in Auburn Hills, Michigan (supporting GM programs) reinforces the opportunity for plants engineered around automation and just-in-time sequencing near final assembly.
Content growth continues to shift toward modular comfort features that can scale from premium to mid-range trims, supported by demonstrable OEM adoption. Lears ComfortMax rollout with GM (debuting in 2025) provides a current proof point that faster-response heating and cooling with fewer parts can lower complexity and broaden fitment across nameplates. Separately, USMCA-driven sourcing discipline and changing trade conditions elevate the opportunity for Mexico and U.S. facilities that can supply compliant, regionalized subassemblies, particularly where suppliers can also provide software-ready controllers, simplified harnessing, and serviceable modules that support both OEM and aftermarket retrofit channels.
Recent Industry Developments
- April 2026: Adient acquired an automotive seating foam plant in Romulus, Michigan, from Woodbridge, expanding its component manufacturing footprint in the United States. The move increases control over a critical input that can bottleneck seat builds and strengthens Adients ability to support localized, just-in-time programs across North America.
- December 2025: Toyota Boshoku America opened a 354,340-square-foot smart manufacturing facility in Hopkinsville, Kentucky, to produce seat frame mechanisms. The added capacity and automation focus support higher regional content and shorten supply lines for seat structures used in North American vehicle programs.
- July 2024: NHTSA issued an update affecting Federal Motor Vehicle Safety Standards for seating systems under FMVSS 207. The action reinforces compliance attention on seat structure performance and documentation, influencing validation workloads and change-control processes for seat makers supplying U.S.-market vehicles.
Research Methodology Framework and Report Scope
Market Definition and Coverage
This market covers the value of automotive seats supplied for use in passenger cars and commercial vehicles across North America, including seating systems and key seat features that are sold into OEM and replacement demand.
Scope exclusions: It does not include other interior parts like dashboards, trim, carpets, or steering systems, and it also excludes vehicle-level services such as installation labor bundled as dealership service.
Segmentation Overview
- By Material Type
- Leather
- Fabric
- Synthetic Leather
- Polyurethane Foam and Others
- By Technology Type
- Standard (Manual-Adjust) Seats
- Powered Seats
- Heated Seats
- Ventilated / Cooled Seats
- Massage and Wellness Seats
- By Vehicle Type
- Passenger Cars
- Light Commercial Vehicles
- Heavy Commercial Vehicles and Buses
- By Sales Channel
- Original Equipment Manufacturer (OEM)
- Aftermarket (Replacement / Retrofit / Customization)
- By Propulsion
- Internal-Combustion Engine (ICE)
- Hybrid Electric Vehicle (HEV)
- Plug-in Hybrid (PHEV)
- Battery Electric Vehicle (BEV)
- Fuel-Cell Electric Vehicle (FCEV)
- By Price Band (OEM Trim Alignment)
- Economy
- Mid-range
- Luxury
- By Country
- United States
- Canada
- Mexico
- Rest of North America
Data Sources, Market Sizing, and Validation
Desk Research
Desk research was used to build the starting point for the model and keep the North America demand story grounded in observable vehicle activity. We relied on public production and sales indicators, trade flows, and safety and material rules that directly influence seat design and cost over time.
Common source types we referenced include government vehicle production and trade statistics (such as US and Mexico customs series), road safety and compliance publications (such as NHTSA materials), industry and supplier association releases (such as automotive and seating-related bodies), and peer-reviewed studies that discuss seating ergonomics, lightweighting, and foam materials. We also used company filings, investor presentations, and reputable press coverage to track capacity additions, platform launches, and content changes by vehicle class. For cross-checking supplier footprints and deal timing, we supplemented with paid databases focused on company financials and intelligence, import-export shipment level signals, and patent databases. These examples are illustrative, and many other public sources were also consulted for collection, validation, and clarification.
Primary Interviews and Surveys
Primary work was used to pressure test assumptions that are difficult to infer from public data, such as feature penetration, pricing movement, and how OEM take rates shift between trims. We spoke with respondents across the value chain, including seat and component suppliers, vehicle program and purchasing teams, materials specialists, and aftermarket channel participants across the United States, Canada, and Mexico.
Distribution of primary research fieldwork respondents
| Company type | Respondent position |
|---|---|
| Top tier: 32% | CXOs: 21% |
| Mid tier: 47% | Functional/Unit leaders: 34% |
| Smaller Players: 21% | Managers: 45% |
Market-Sizing & Forecasting
Sizing starts from a top-down build where North America light vehicle production and sales are translated into a seat demand pool, and then converted to value using seat content per vehicle and a practical average selling price range by vehicle class. We corroborated results with selective bottom-up approximations, such as checks against supplier revenue disclosures, sampled program pricing, and channel checks for replacement demand, and we adjusted totals when the bottom-up view diverged.
Key inputs used as model drivers include vehicle production by country, mix shift toward trucks and SUVs versus passenger cars, powered and comfort feature penetration (for example heating and ventilation), material mix such as fabric versus leather, and the effect of safety and chemical compliance changes on foam and cover costs. Where direct price series were not available, we derived ranges from interviews and then reconciled them with publicly visible inflation and materials indicators.
For forecasting, scenario analysis was applied around vehicle output and feature take rates, then smoothed with a time series check so year-to-year movements remain realistic. When bottom-up signals were missing for smaller submarkets, we filled gaps using proxy relationships such as vehicle mix and feature adoption, and then revalidated the implied values during follow-up calls.
Data Validation & Update Cycle
Outputs are validated through repeated cross-checks so no single data stream overdrives the final number. We compare market totals against independent indicators like regional vehicle production, supplier capacity announcements, and the implied seat value per vehicle, then investigate variances before final sign-off.
Anomalies trigger a second pass on assumptions, followed by re-contact with sources when the gap is driven by pricing, feature penetration, or a country-level mix shift. Reports are refreshed annually, with interim updates when material events occur, such as large program wins, plant openings, or sharp production resets. Before delivery, we review the latest public signals again so the client view reflects the most recent period.
Mordor Intelligence's North America Automotive Seat Market Size Compared Against Other Published Estimates
Published market sizes for North America automotive seats do not always match because firms often count different demand pools, pick different base years, and use different assumptions for pricing and feature penetration. Currency timing and how quickly a model is refreshed can also move the value even when unit volumes look similar.
Aftermarket replacement seats and seat covers are a frequent source of overcounting, and that item sits outside Mordor Intelligence's scope here because the sizing is anchored to automotive seating systems tied to vehicle production and OEM fitment, and then checked against country-level output and feature take rates.
Benchmark comparison
| Source | Market Size | Gaps in Research Methodology |
|---|---|---|
| Mordor Intelligence | USD 19.39 B (2025) | |
| Global Consultancy A | USD 20.02 B (2024) | Uses a different base year and study window, and the stated framework blends multiple scenario cases, which can lift or compress the midpoint versus a single base-case view. |
| Industry Publisher B | USD 22.60 B (2026) | Starts from a later estimated year and applies a higher growth path, which can embed a more aggressive feature and pricing progression for advanced seating content. |
Taken together, the spread is mainly explained by base-year selection and how pricing and feature content are stepped forward over time. By keeping the demand pool tied to vehicle output and then rechecking the implied value per vehicle using interviews, the final number stays traceable to variables that can be revisited as production, mix, and comfort feature adoption change.
Key Questions Answered in the Report
How large is the North American automotive seat market in 2026?
The market is valued at USD 20.32 billion in 2026 and is set to reach USD 25.68 billion by 2031.
Which material is growing fastest in North American automotive seating?
Genuine leather posts the highest 7.38% CAGR as premium SUVs and pickups favor authentic trim.
Why are massage and wellness seats gaining traction?
Wellness seats migrate to mid-range vehicles as suppliers slash costs and consumers prioritize comfort and health on longer commutes.
How are EV mandates influencing commercial-vehicle seats?
Fleet electrification rules drive demand for ultralight, sustainable seats that offset battery mass and align with zero-emission procurement criteria.
What role does USMCA play in seat supply chains?
The trade pact’s 75% regional-value rule is prompting suppliers to near-shore production to Mexico and the U.S. for tariff compliance and logistics savings.