
Market Overview
| Study Period | 2020 - 2031 |
|---|---|
| Forecast Data Period | 2026 - 2031 |
| Base Year Market Size (2025) | 4.58 Billion Liters |
| Market Volume (2026) | 4.62 Billion Liters |
| Market Volume (2031) | 4.81 Billion Liters |
| Growth Rate (2026 - 2031) | 0.82 % |
| Market Concentration | Medium |
Major Players *Disclaimer: Major Players sorted in no particular order Image © Mordor Intelligence. Reuse requires attribution under CC BY 4.0. | |
North America Automotive Lubricants Market Analysis by Mordor Intelligence
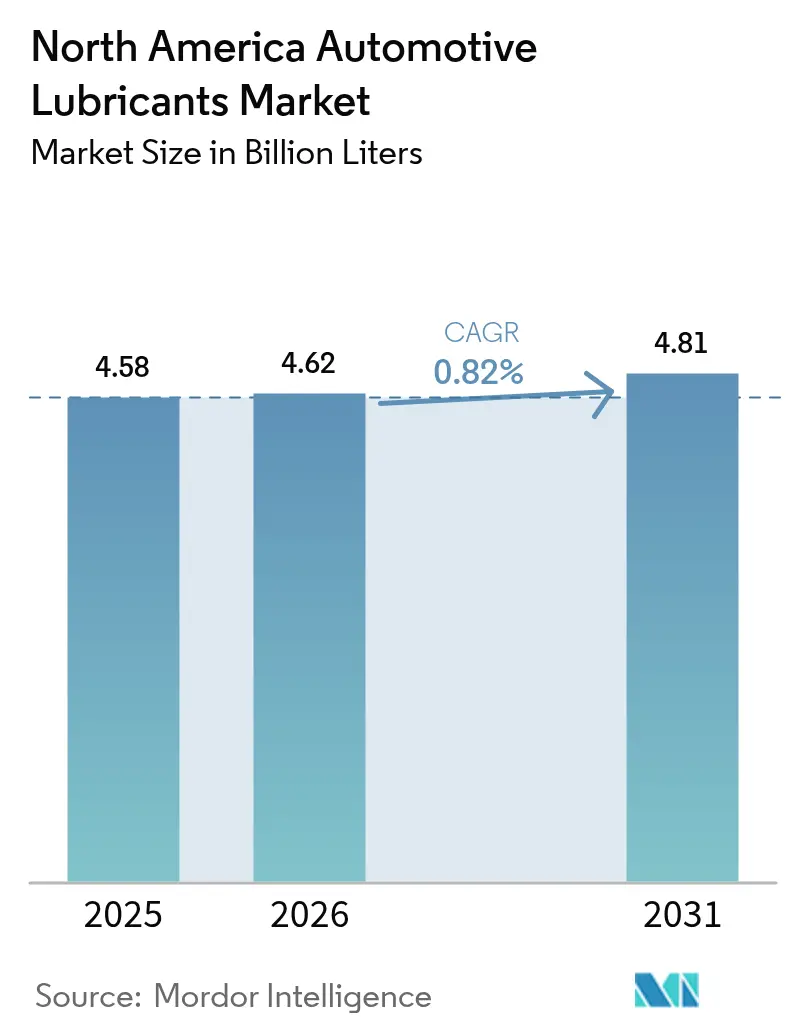
The North America Automotive Lubricants Market size was valued at 4.58 Billion Liters in 2025 and estimated to grow from 4.62 Billion Liters in 2026 to reach 4.81 Billion Liters by 2031, at a CAGR of 0.82% during the forecast period (2026-2031). Mature vehicle ownership levels across the United States, Canada, and Mexico temper volume expansion even as premium e-fluids register pockets of high growth. Extended drain intervals, the rising share of battery-electric vehicles, and intense quick-lube consolidation all place downward pressure on conventional engine oil use. Offsetting forces include a record-old internal combustion engine parc, tougher heavy-duty emissions norms that demand higher-performance formulations, and new factory-fill requirements tied to Mexico’s rapidly scaling vehicle production. Suppliers are therefore pivoting from volume-centric models toward value-added product lines that promise stronger margins and closer OEM collaboration, an approach reinforced by recent consolidation among global lubricant majors.
Key Report Takeaways
- By product type, engine oil led with a 59.65% share of the North America automotive lubricants market in 2025, while automatic transmission fluids are forecast to expand at a 0.98% CAGR through 2031.
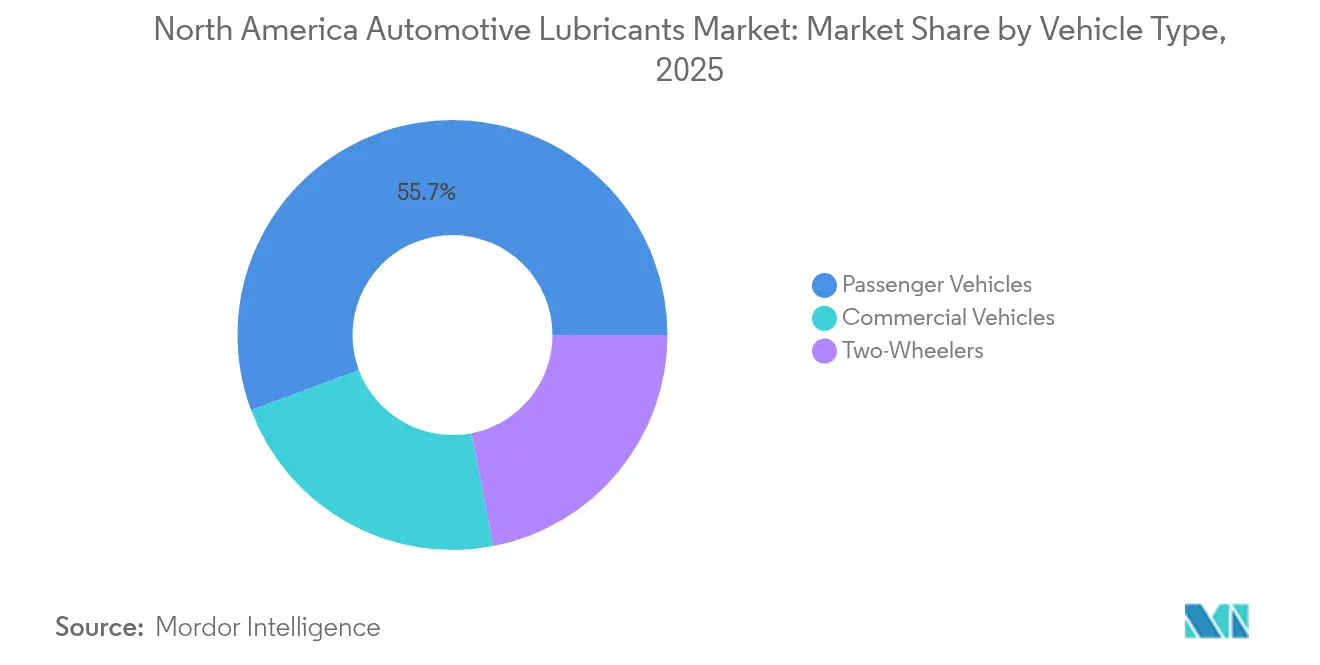
- By vehicle type, passenger vehicles accounted for 55.70% of the North America automotive lubricants market size in 2025, and commercial vehicles are expected to record the highest projected growth at a 0.92% CAGR through 2031.
- By geography, the United States commanded 86.30% of the North America automotive lubricants market share in 2025, whereas Canada represents the fastest-growing country segment at a 0.85% CAGR through 2031.
Note: Market size and forecast figures in this report are generated using Mordor Intelligence’s proprietary estimation framework, updated with the latest available data and insights as of 2026.
Market Trends and Insights
Drivers Impact Analysis of North America Automotive Lubricants Market*
| Driver | (~) % Impact on CAGR Forecast | Geographic Relevance | Impact Timeline |
|---|---|---|---|
| ICE parc renewal cycle keeps base-oil demand steady | +0.3% | North America-wide, concentrated in US fleet markets | Long term (≥ 4 years) |
| Electrified light-duty fleet still requires specialty e-fluids | +0.2% | US and Canada, with Mexico emerging | Medium term (2-4 years) |
| Tier-III heavy-duty emissions norms raise lubricant performance requirements | +0.1% | US and Canada regulatory jurisdictions | Short term (≤ 2 years) |
| Mexico's OEM capacity additions (2024-27) spur factory-fill volumes | +0.2% | Mexico manufacturing corridors, spillover to USMCA trade | Medium term (2-4 years) |
| OEM-branded aftersales programs gain share | +0.1% | North America-wide, led by premium segments | Long term (≥ 4 years) |
| Source: Mordor Intelligence | |||
ICE Parc Renewal Cycle Keeps Base-Oil Demand Steady
The high average vehicle age continues to underpin a large portion of older internal combustion engine cars and trucks that require more frequent oil changes and higher-viscosity blends. In 2023, motor gasoline sales in Canada reached 12.7 billion litres, with 90.8% distributed through service stations, underscoring the entrenched maintenance needs of conventional powertrains[1]. Vehicles exceeding 12 years of age typically follow 3,000- to 5,000-mile service intervals, counterbalancing the extended drain schedules of newer engines. Demand for conventional and high-mileage oils, therefore, remains resilient as owners of aging vehicles seek formulations that mitigate wear, manage seal swelling, and control deposits beyond 75,000 miles. This trend prolongs baseline engine-oil volumes even as fleet electrification advances.
Electrified Light-Duty Fleet Still Requires Specialty E-Fluids
Electric vehicles eliminate crankcase oil yet introduce fresh opportunities in dielectric coolants and e-axle lubricants. Petro-Canada launched its EVR range in 2024 to serve OEM and Tier-1 battery and gearbox applications. Castrol’s ON series and Valvoline’s hybrid-optimized synthetics follow similar strategies that shift the conversation from liter-based sales to premium chemistry. Mexican EV production increased from 6,717 units in 2020 to 206,870 units in 2024, with 95% of the units exported, thereby tying regional e-vehicle demand to cross-border trade flows. Thermal management for batteries and power electronics requires precise control of conductivity, which favors suppliers with advanced additive expertise and close OEM ties.
Tier-III Heavy-Duty Emissions Norms Raise Lubricant Performance Requirements
New rules covering particulate and nitrogen oxide output in commercial vehicles raise viscosity stability and low-ash thresholds for diesel oils. API CK-4 and FA-4 categories target 2017-plus engines, demanding resistance to oxidation, aeration, and soot-driven shear loss. FA-4 formulations are limited to XW-30 grades and exhibit high-temperature shear of 2.9-3.2 cP[2]. Compliance also mandates compatibility with low-sulfur fuels and sensitive aftertreatment hardware such as diesel particulate filters. The technical hurdles reward producers that invest in test rigs, engine benches, and rigorous field validation, shifting sales toward higher-value synthetics.
Mexico OEM Capacity Additions Spur Factory-Fill Volumes
Investments from BMW, Audi, and a growing constellation of Chinese component suppliers broaden Mexico’s role as a production hub. BMW is investing USD 540 million in battery assembly in San Luis Potosí for Neue Klasse models that are scheduled to roll off the lines in 2027. Alongside Audi’s USD 1 billion plant upgrade and more than 30 Chinese supplier projects, this wave is expected to increase demand for stamping press oils, coolant lubricants, and factory-fill transmission fluids. Because 87% of Mexican-built vehicles are shipped to the United States, the ripple effect reaches lubricant distributors across the border.
Restraints Impact Analysis of North America Automotive Lubricants Market*
| Restraint | (~) % Impact on CAGR Forecast | Geographic Relevance | Impact Timeline |
|---|---|---|---|
| Longer drain intervals in new engines | -0.2% | North America-wide, concentrated in new vehicle segments | Long term (≥ 4 years) |
| EV penetration in light-duty segment | -0.1% | US and Canada urban markets, Mexico export production | Medium term (2-4 years) |
| Consolidation of quick-lube chains squeezes independent distributors | -0.1% | US and Canada retail markets | Short term (≤ 2 years) |
| Source: Mordor Intelligence | |||
Longer Drain Intervals in New Engines
ILSAC GF-7 licensing, first issued in March 2025, supports 7,500-10,000-mile oil changes, cutting annual lubricant volume per vehicle by up to 50% compared with legacy schedules. Low-viscosity 0W-16 and 0W-20 grades further extend service windows while boosting fuel economy. Fleet operators are increasingly deploying oil-analysis services to extend intervals even longer, thereby magnifying the impact on consumption. API’s aftermarket audit program now monitors bulk and packaged oils for viscosity retention and oxidative stability, putting pressure on producers that cannot meet extended-service claims.
EV Penetration in Light-Duty Segment
Battery electric cars displace 4-6 quarts of engine oil per vehicle, yet they demand only modest volumes of e-fluid. Mexican sales of electrified vehicles reached 124,310 units in 2024, accounting for 8.3% of the market. However, EV investment announcements declined by 97.4% in the first half of 2025, indicating uncertain near-term scaling. Each BEV uses roughly 1-2 quarts of e-axle lubricant and specialized coolants, producing a net negative swing in liters. The substitution ratio, therefore, erodes baseline demand in the North America automotive lubricants market even as it unlocks high-margin specialty niches.
*Our forecasts treat driver/restraint impacts as directional, not additive. The impact forecasts reflect baseline growth, mix effects, and variable interactions.
North America Automotive Lubricants Market Segment Analysis
By Product Type:
Engine Oil Dominance Faces E-Fluid ChallengeThe engine oil category retained a 59.65% share of the North America automotive lubricants market in 2025, underscoring its role as the largest revenue contributor. Within this space, high-mileage formulations and synthetics command premium price points that help offset the volume drag from longer drain times. Automatic transmission fluids represent the fastest-growing product line, with a 0.98% CAGR, driven by the increasing demand for multi-speed automatics, dual-clutch units, and hybrid gearsets that require tailor-made friction characteristics. The North America automotive lubricants market size for transmission fluids is projected to expand steadily as OEM design complexity increases. Brake fluids maintain a steady demand due to the integration of advanced driver assistance systems, which place higher temperature stress on hydraulics.
EV-specific e-fluids remain a small but growing segment, capturing value through sophisticated chemistry rather than the volume of gallons moved. Castrol, Valvoline, and Petro-Canada have all launched dielectric coolants and e-axle lubes designed to preserve copper windings and power electronics under high voltage. Manual gearbox oils and power steering fluids are trending downward as electric power steering architectures eliminate hydraulic systems. Greases, meanwhile, capture incremental growth from high-speed electric motor bearings requiring tighter shear-stability control. Across each sub-category, OEM approvals increasingly dictate specification, pushing suppliers to secure factory fill endorsements to protect downstream aftermarket pull-through.


By Vehicle Type:
Commercial Vehicles Drive Performance InnovationPassenger cars accounted for 55.70% of the North America automotive lubricants market size in 2025, reflecting the significant weight of the light-duty parc. Even so, heavy-duty trucks and buses deliver the highest innovation pace due to tougher emissions limits and total-cost-of-ownership pressures. Commercial fleets are predicted to achieve a 0.92% CAGR through 2031, aided by API CK-4 and FA-4 oils that enable fuel economy gains and longer drains while safeguarding aftertreatment hardware. The North America automotive lubricants market share for FA-4 grades is rising as OEMs certify more engines for lower viscosity.
Oil analysis programs have become standard in long-haul fleets, replacing time-based schedules with data-driven triggers that safely stretch intervals. This approach boosts demand for premium synthetics with superior oxidation resistance. In the two-wheeler niche, Harley-Davidson and other motorcycle manufacturers specify proprietary primary-drive and wet-clutch lubricants, allowing brand owners to capture elevated margins despite comparatively small volumes. Electric scooters and motorcycles are still in their infancy, yet they demonstrate potential for specialty greases that can handle high-rpm motor bearings and regenerative braking loads.
Geography Analysis
United States Automotive Lubricants Market
The United States dominated the market with an 86.30% share in 2025, buoyed by an aftermarket that includes roughly 1,500 Valvoline Instant Oil Change outlets, as well as thousands of independent shops. Dense highway mileage and a record average vehicle age of more than 12 years sustain robust demand for engine oils and transmission fluids. API and ILSAC standards shape product formulation, creating technical barriers that favor incumbents with large R&D budgets. Aramco’s acquisition of Valvoline Global Operations in April 2025 provides the Saudi major with a vertically integrated platform to combine its base-oil output with downstream branded retail operations.
Canada Automotive Lubricants Market
Canada, while smaller, is projected to post the fastest CAGR of 0.85% through 2031. Harsh weather and heavy resource extraction activities in the oil sands necessitate premium low-temperature and high-shear oils. In 2023, Canadian secondary distributors moved 23.9 billion litres of refined petroleum products, 94.3% of which were motor gasoline and diesel, indicating a strong pull-through for lubricants. Petro-Canada Lubricants supports domestic demand via its PROTECT&GO quick-lube network and contributed fluids to Project Arrow, the country’s first zero-emissions concept vehicle.
Mexico Automotive Lubricants Market
Mexico’s share, while modest, is poised to climb on the back of aggressive OEM investment. BMW will channel USD 855 million into Nuevo León, including USD 540 million for battery assembly, with production slated for 2027. Audi and more than 30 Chinese suppliers add further capacity, pushing factory-fill requirements for engine oils, ATFs, brake fluids, and e-fluids. Although EV-related capital outlays dipped sharply in early 2025, Mexico’s export orientation means volumes produced locally directly influence United States aftermarket patterns. Trade policy uncertainties and potential tariff shifts form a risk backdrop that could alter lubricant demand trajectories.
Regulatory Landscape
In North America, automotive lubricant specifications are primarily shaped by industry standards that translate vehicle emissions and durability requirements into fluid performance needs. API service categories and ILSAC passenger-car engine-oil specifications remain the main reference points for formulation. A shift in drain-interval expectations and low-viscosity formulation requirements followed ILSAC GF-7 licensing issued in March 2025, which supports 7,500-10,000-mile oil-change intervals and tightens performance expectations for oxidation control, deposit protection, and viscosity retention.
On the policy side, the United States Environmental Protection Agency (EPA) flagged multiple federal regulatory resets in 2026, including actions affecting the timing and compliance architecture for on-highway vehicle standards (light-, medium-, and heavy-duty) and a separate July 2026 proposal covering model year 2027 and later heavy-duty highway engine compliance provisions (useful life, emissions warranty periods, and nonconformance penalties). In Canada, Environment and Climate Change Canada (ECCC) brought the Prohibition of Certain Toxic Substances Regulations, 2025 into force on June 30, 2026, which increases compliance screening requirements for lubricant formulations and additive supply chains under CEPA-linked chemical controls.
Value Chain Analysis
The value chain begins with base-oil production (Group I/II/III and re-refined stocks) and additive manufacturing, then moves to blending and packaging by integrated majors and independent lubricant manufacturers. From there, distributors supply OEM factory-fill, dealership programs, commercial fleets, and the retail and quick-lube aftermarket. Independent manufacturers remain a structurally important part of supply, with ILMA citing USD 15.2 billion in total sales activity across North America in 2024 and nearly 32% share, while the United States serves as the primary regional production, branding, and export hub.
Distribution is shaped by USMCA trade flows and channel consolidation, with bulk deliveries and packaged goods moving through jobbers, warehouse distributors, and national service networks into installers (quick-lube chains, dealerships, and independent repair). Cross-border movement matters for both finished lubricants and base-oil intermediates, and industry data indicate the United States ran a lubricant trade surplus through August 2025, with Mexico as the dominant export destination. A notable upstream constraint is premium Group III availability and price volatility, including sharp producer-price inflation for US base oils in May and June 2026, which raises blending cost pressure and tightens procurement for modern low-viscosity synthetic engine oils and ATFs.
Competitive Landscape
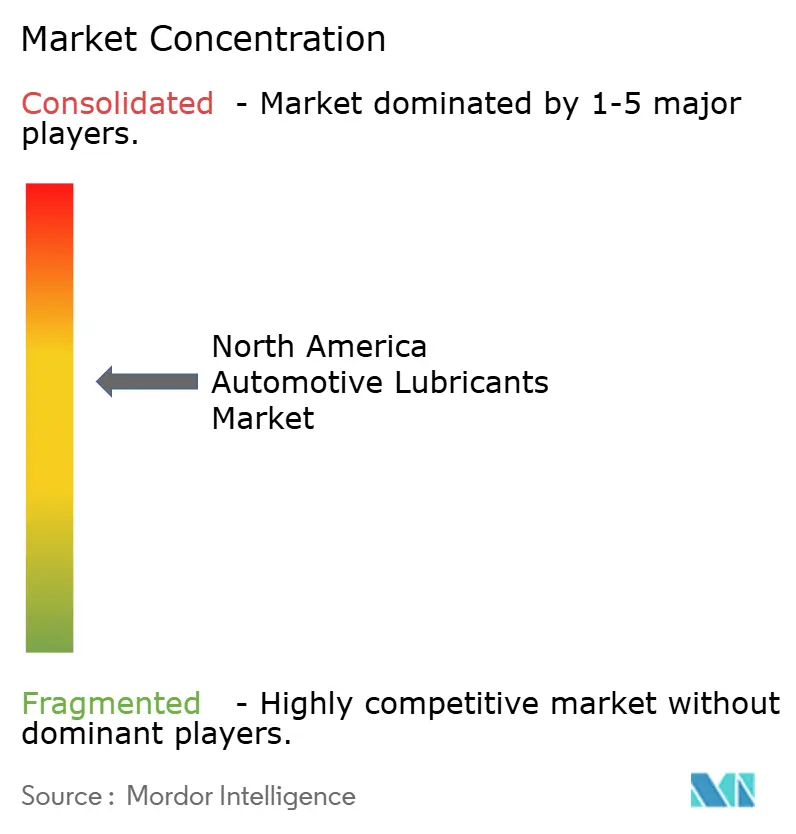
The North America Automotive Lubricants Market is fairly consolidated, with integrated majors and specialty formulators competing on technology, brand, and channel reach. Innovation pipelines focus on additive packages that balance oxidation control, deposit management, and low-temperature pumpability while meeting stricter greenhouse gas regulations. ILSAC GF-7 and the proposed ILSAC GF-8, alongside API FA-4, demand ongoing formulation tweaks. Companies with dedicated engine test stands and OEM relationships hold an advantage, as validation cycles become longer and more costly.
North America Automotive Lubricants Industry Leaders
-
Chevron Corporation
-
ExxonMobil Corporation
-
BP p.l.c.
-
Saudi Arabian Oil Co.
-
Shell plc
- *Disclaimer: Major Players sorted in no particular order
North America Automotive Lubricants Market Companies Covered in this Report
- AMSOIL INC.
- BP plc
- Chevron Corporation
- CITGO Petroleum Lubricants
- Exxon Mobil Corporation
- FUCHS
- HollyFrontier (Petro-Canada Lubricants)
- Idemitsu Lubricants America
- LIQUI MOLY
- Lucas Oil Products, Inc.
- Motul
- PETRONAS lubricant International
- Phillips 66 Company
- Roshfrans
- Saudi Arabian Oil Co.
- Shell plc
- TotalEnergies
Read Analysis of North America Automotive Lubricants Companies
Market Opportunities and Future Outlook
Low-viscosity, high-performance formulations are driving product and feedstock shifts, which opens room for suppliers that can secure premium base stocks, additive technology, and OEM approvals across both factory-fill and aftermarket programs. Investment signals are focused on North American Group III and Group III+ capacity and re-refining, consistent with the region’s shift toward higher-value synthetics. In January 2026, ExxonMobil began construction on its Baytown Refinery Reconfiguration Project to move output toward Group III base stocks (targeting 8,000 barrels per day by 2028), while in February 2026 Vertex Energy confirmed commercial production of its VTX-R6 Group III re-refined base oil and announced a June 2026 project to add 6,000 barrels per day of conventional Group III capacity at Mobile, Alabama. These expansions support lubricant marketers and independent blenders that need more reliable access to premium base oils for ILSAC GF-7-era engine oils and more demanding ATF specifications.
Demand-side opportunities are centered on premiumization rather than volume growth, including synthetic engine oils aligned with extended drain intervals, heavy-duty diesel oils meeting API CK-4/FA-4 performance needs, and specialty fluids for electrified powertrains such as dielectric coolants and e-axle lubricants, even as BEVs reduce crankcase-oil consumption. Mexico’s OEM capacity buildout through 2024-2027, including BMW’s planned battery assembly investment in San Luis Potosi for Neue Klasse models scheduled for 2027, also expands factory-fill and first-fill opportunities for transmission fluids, greases, and thermal-management fluids within a USMCA-integrated supply chain.
Recent Industry Developments in North America Automotive Lubricants Market
- July 2026: Shell completed the USD 1.3 billion sale of Jiffy Lube International and Premium Velocity Auto to an affiliate of Monomoy Capital Partners. Shell retained long-term lubricant supply agreements linked to the divested service network, keeping product pull-through while shifting asset ownership in the quick-lube channel.
- April 2025: Shell subsidiary Pennzoil-Quaker State and Blue Tide Environmental completed a used-oil re-refining facility in Baytown, Texas, to produce high-quality base oils. The project expands circular-feedstock supply for lubricant formulations and supports sustainability-positioned product lines in the region.
- July 2024: FUCHS acquired LUBCON, adding specialty lubricant capabilities and a broader industrial and automotive-adjacent product portfolio. The deal strengthens formulation breadth and can influence competitive positioning for premium and niche lubricant applications served from North America-facing supply chains.
North America Automotive Lubricants Market Report Scope and Research Methodology
Market Definition and Coverage
For this study, the market covers lubricants used to operate and protect on-road vehicle systems across North America, measured as lubricant demand volume across the year and expressed in liters.
Scope exclusions: This sizing excludes industrial and process lubricants that are not primarily used in on-road vehicles.
Segments Covered in This Report
- By Product Type
- Automotive Engine Oil
- 0W-XX
- 5W-XX
- 10W-XX
- 15W-XX
- Monogrades
- Other Grades
- Manual Transmission Fluids (MTF)
- Automatic Transmission Fluids (ATF)
- Brake Fluids
- Automotive Greases
- Other Product Types (Power Steering Fluid etc.)
- Automotive Engine Oil
- By Vehicle Type
- Passenger Vehicles
- Commercial Vehicles
- Two-Wheelers
- By Geography
- United States
- Canada
- Mexico
Data Sources, Market Sizing, and Validation
Desk Research
Desk research was used to frame the demand pool and to anchor assumptions that are hard to observe from a single dataset. We relied on public and official references such as national vehicle registration and fleet indicators, EPA and Transport Canada fuel economy and emissions materials, and trade statistics from agencies such as the US International Trade Commission and UN Comtrade for lubricant-related trade flows.
We also reviewed technical and category signals, including SAE viscosity grade references, API and ILSAC category updates, and reported used oil collection or recycling indicators where available, because these can hint at drain interval behavior. Company annual reports, investor decks, and reputable industry press were used to sense-check product mix shifts (synthetic share, low-viscosity adoption) and channel balance between OEM-fill and aftermarket. Where needed, a paid subscription covering company financials and an import-export shipment-level database were used to verify supplier presence, shipment patterns, and approximate cross-border flows. The specific desk sources listed here are illustrative, and other public references were also used for data collection, validation, and clarification.
Primary Interviews and Surveys
Primary work was used to pressure-test what the public data cannot show clearly, especially product mix, drain intervals, and how quickly newer specifications are adopted in the installed vehicle base. We spoke with a balanced set of lubricant producers, blenders, distributors, workshop networks, and fleet-facing stakeholders across the United States, Canada, and Mexico, and then used follow-up checks to confirm key conversion factors and pricing logic that influence volume splits by product type and vehicle use.
Distribution of primary research fieldwork respondents
| Company type | Respondent position |
|---|---|
| Top tier: 30% | CXOs: 19% |
| Mid tier: 49% | Functional/Unit leaders: 21% |
| Smaller Players: 21% | Managers: 60% |
Market-Sizing & Forecasting
We started with a top-down demand build, where vehicle parc by type is paired with typical lubricant fill volumes and service intervals to reconstruct annual consumption in liters across the region. To keep the totals realistic, the model is corroborated through selective bottom-up approximations, such as sampled supplier volume disclosures, channel checks from distributors and workshops, and sanity checks using typical liters-per-oil-change patterns.
Key inputs used in the model include the on-road vehicle population and age mix, oil drain interval trends, the split between passenger vehicles and commercial vehicles, the share of synthetic and semi-synthetic formulations, and the mix shift across engine oils, transmission fluids, brake fluids, and greases. For forecasting, scenario analysis was applied so the outlook can reflect different paths for electrification, fuel economy-driven viscosity downshifting, and maintenance behavior changes in fleets. Where bottom-up clues were missing for smaller categories, we filled gaps using ratio-based allocations tied to parc and service intensity, and then validated those ratios in expert calls before finalizing the series.
Data Validation & Update Cycle
Model outputs were cross-checked against independent signals, including trade flow directionality, known specification transition timelines, and whether volume moves match what channel stakeholders see in workshop and fleet servicing. If large variances appeared by country or product group, we re-checked unit conversions, re-ran the service interval assumptions, and then re-contacted experts for clarification before sign-off.
Each report goes through multi-step internal review so that key assumptions, formulas, and year-to-year movements are consistently documented. We refresh the full dataset annually, and interim updates are triggered when material events occur, such as major specification changes or unusual vehicle sales swings. Before delivery, a final analyst pass is completed to ensure clients receive the latest updated view.
Mordor Intelligence's North America Automotive Lubricants Market Sizing Compared With Other Published Estimates
Published market sizes for automotive lubricants can differ even when the topic sounds similar, because firms use different units, include different lubricant families, and do not always align on geography or vehicle coverage. In practice, the biggest spread usually comes from mixing total lubricants with automotive-only demand, and then applying price assumptions that are not fully tied back to the product mix.
Used oil collection patterns, vehicle parc structure, and category-level product shares are the evidence points that keep the Mordor Intelligence estimate anchored to automotive lubricant consumption in the United States, Canada, and Mexico, instead of broader lubricant demand totals. Differences also show up when a study reports a value figure using aggressive price uplift assumptions, or when it converts volumes to USD using a single average price that does not reflect synthetic penetration and drain interval shifts.
Benchmark comparison
| Source | Market Size | Gaps in Research Methodology |
|---|---|---|
| Mordor Intelligence | USD 4.58 B (2025) | |
| Industry Association A | USD 8.25 B (2024) | Often reflects total lubricant demand or broader motor oil groupings in North America, which can pull in non-automotive lubricant uses and create an apples-to-oranges comparison versus automotive-only scope. |
| Trade Journal B | USD 22.50 B (2024) | Typically presented as a value estimate that can rely on blended or list pricing and faster synthetic price progression, without showing the volume-to-value bridge by product type and country. |
The spread across published numbers is mainly explained by scope boundaries and how volumes are translated into USD. When the market is kept strictly to automotive lubricant demand and checked against parc and service behavior signals, the resulting total is easier to trace, re-create, and update year by year.
Key Questions Answered in the Report
How large is the North America automotive lubricants market in 2026?
The market reached 4.62 billion litres in 2026 and is forecast to grow to 4.81 billion litres by 2031.
What segments are expanding fastest within the region?
Automatic transmission fluids and commercial-vehicle lubricants are pacing ahead, with projected CAGRs of 0.98% and 0.92% respectively.
Which country is the top consumer of automotive lubricants in North America?
The United States accounted for 86.30% of regional demand in 2025, far outpacing Canada and Mexico.
How are electric vehicles affecting lubricant consumption?
Battery electric cars remove engine-oil needs but create high-margin demand for e-axle and dielectric fluids, resulting in lower overall volumes but elevated value potential.
What recent deals have reshaped the competitive landscape?
Aramco bought Valvoline Global Operations for USD 2.65 billion in April 2025, while FUCHS acquired LUBCON for EUR 40 million in July 2024, signaling ongoing consolidation.