
Market Overview
| Study Period | 2020 - 2031 |
|---|---|
| Forecast Data Period | 2026 - 2031 |
| Base Year Market Size (2025) | USD 51.93 Billion |
| Market Size (2026) | USD 53.81 Billion |
| Market Size (2031) | USD 64.23 Billion |
| Growth Rate (2026 - 2031) | 3.61 % |
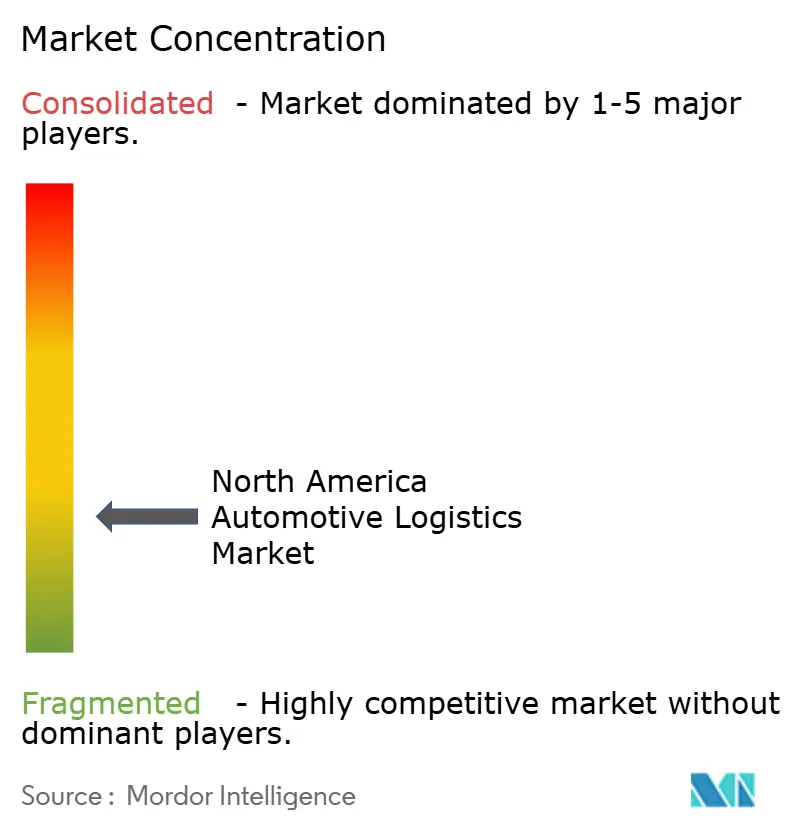
| Market Concentration | Low |
Major Players *Disclaimer: Major Players sorted in no particular order Image © Mordor Intelligence. Reuse requires attribution under CC BY 4.0. | |
North America Automotive Logistics Market Analysis by Mordor Intelligence
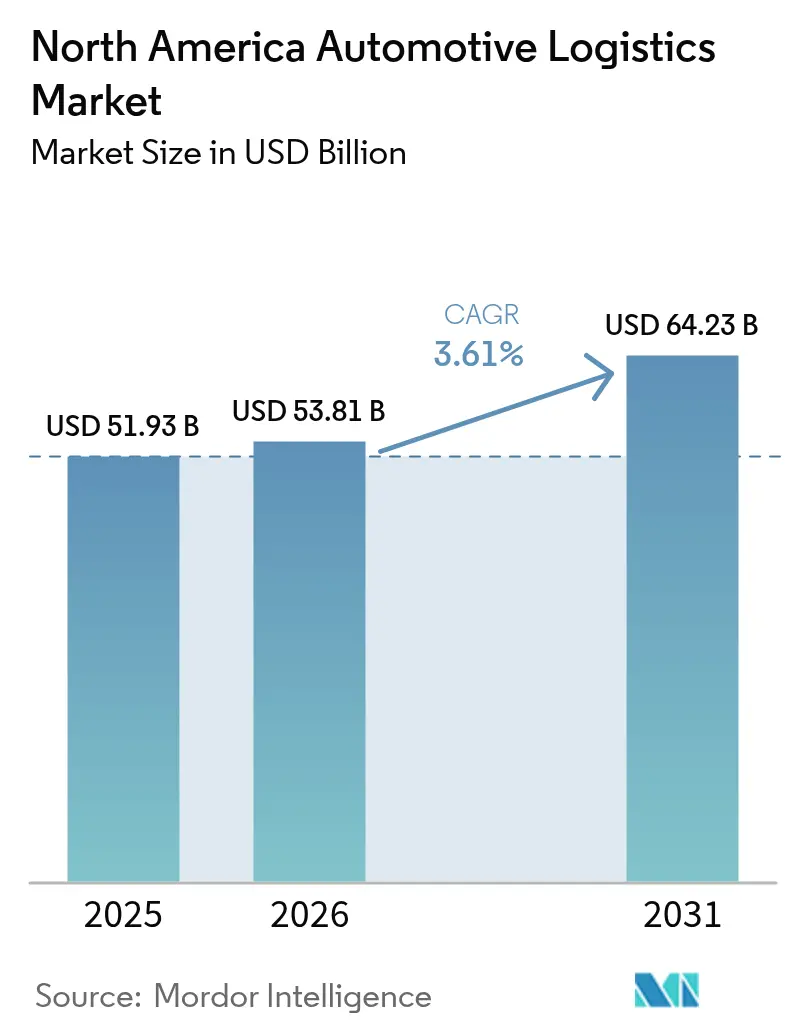
The North America Automotive Logistics Market size was valued at USD 51.93 billion in 2025 and estimated to grow from USD 53.81 billion in 2026 to reach USD 64.23 billion by 2031, at a CAGR of 3.61% during the forecast period (2026-2031).
Resilient demand comes from production near-shoring under USMCA, rising e-commerce parts flows, and the specialized, high-value movement of electric-vehicle (EV) batteries. The North America Automotive Logistics market is steadily shifting toward technology-enabled, value-added services that improve visibility, reduce empty-mile costs, and integrate kitting and sequencing at plants. Consolidation waves—exemplified by DSV’s USD 14.9 billion acquisition of DB Schenker in April 2025—are producing larger, multimodal service platforms able to manage end-to-end flows for original-equipment manufacturers (OEMs) and aftermarket clients. Despite a persistent driver shortage, cross-border investments and port expansions in Mexico support the North America Automotive Logistics market’s long-term trajectory.
Key Report Takeaways
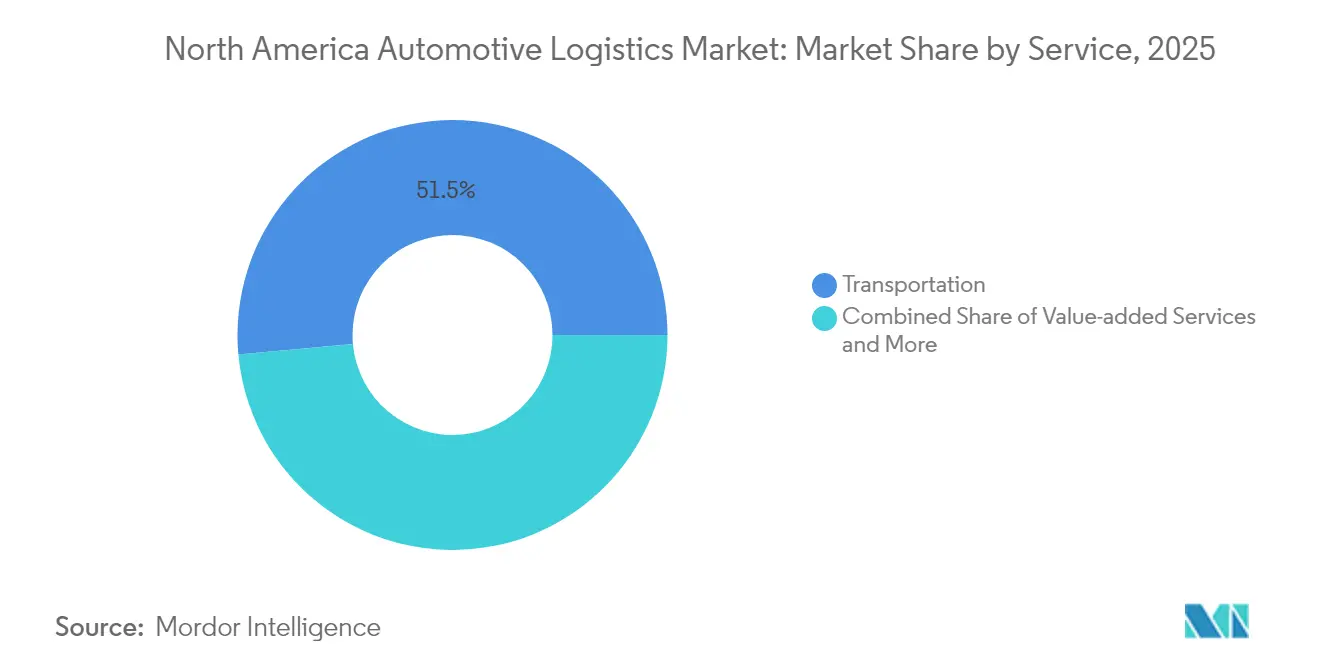
- By service, transportation held 51.45% of the North America Automotive Logistics market share in 2025, while value-added services are advancing at a 2.95% CAGR through 2031.
- By type, aftermarket logistics is expected to record a 3.65% CAGR through 2031, outpacing OEM flows, which retained a 56.20% share of the North America Automotive Logistics market size in 2025.
- By cargo type, finished vehicles captured 40.30% of the North America Automotive Logistics market size in 2025, whereas EV batteries and power electronics are projected to grow at a 3.32% CAGR to 2031.
- By country, the United States commanded 78.35% market share in 2025, but Mexico is forecast to post the fastest 3.98% CAGR through 2031.
Note: Market size and forecast figures in this report are generated using Mordor Intelligence’s proprietary estimation framework, updated with the latest available data and insights as of 2026.
Market Trends and Insights
Drivers Impact Analysis of North America Automotive Logistics Market*
| Driver | (~) % Impact on CAGR Forecast | Geographic Relevance | Impact Timeline |
|---|---|---|---|
| Environmental regulations tightening | +0.6% | United States, Canada | Medium term (2-4 years) |
| Growth of e-commerce parts flows | +0.5% | North America-wide | Short term (≤ 2 years) |
| OEM near-shoring & USMCA production ramp-up | +0.4% | Mexico, United States | Long term (≥ 4 years) |
| Technology-enabled supply-chain visibility | +0.3% | North America-wide | Medium term (2-4 years) |
| Mexico’s Pacific port expansions | +0.3% | Mexico, Western United States | Long term (≥ 4 years) |
| AI-driven dynamic routing | +0.3% | North America-wide | Short term (≤ 2 years) |
| Source: Mordor Intelligence | |||
Environmental Regulations Tightening (2025-2030)
The EPA’s Phase 3 greenhouse-gas standards, effective 2027, push logistics fleets toward low- and zero-emission trucks, altering asset procurement and routing strategies[1]. States adopting California’s Advanced Clean Fleets Rule accelerate the transition by mandating zero-emission vehicle purchases. Operators face higher capital outlays for electric tractors yet expect lifetime fuel and maintenance savings to offset those costs. Warehouses install energy-management systems and secure ISO 14001 certification to meet shipper sustainability criteria. Logistics partners that can document quantifiable carbon-footprint reductions increasingly win long-term contracts from automakers focused on ESG metrics. Consequently, compliance investments become both a market entry ticket and a brand-building lever within the North America Automotive Logistics market.
Growth of E-commerce Parts Flows
Direct-to-consumer parts sales are fragmenting shipment profiles, shifting from pallet-level moves to parcel-size consignments that demand automated picking, labeling, and same-day fulfillment[2]. Cross-docks and micro-fulfillment centers near urban demand nodes shrink order-to-delivery cycles, while SKU proliferation necessitates real-time inventory visibility. Packaging engineers design tamper-proof, static-free solutions to protect sensors and electronics in parcel networks. Returns complexity rises as consumers expect hassle-free exchanges, prompting 3PLs to add refurbishment and restocking lines inside warehouses. The North America Automotive Logistics market thus pivots from purely cost-focused transportation to integrated, tech-driven services that manage e-commerce volatility.
OEM Near-shoring & USMCA Production Ramp-up
USMCA’s 75% regional-value content threshold is attracting engine, transmission, and EV-battery factories to Mexico, redirecting inbound flows from Asia to North American corridors[3]. Daily cross-border truckloads have climbed, compelling 3PLs to establish dedicated fast-lane programs with embedded customs-brokerage teams. Rail operators expand intermodal capacity linking Monterrey, Saltillo, and Puebla to Midwest U.S. auto hubs. Finished-vehicle terminals at Veracruz and Altamira add rail sidings and storage lots to handle build-ups during model launches. As regionalized sourcing deepens, synchronized production and logistics calendars cut pipeline inventory and boost on-time line-feeding for assembly plants spread across the North America Automotive Logistics market.
AI-driven Dynamic Routing Slashes Empty-Mile Costs
Machine-learning platforms synthesize traffic, weather, fuel, and driver-HOS variables to build real-time, optimal route plans that lift load factors and lower idle time. Predictive maintenance modules draw on telematics data to pre-schedule service stops, avoiding unplanned breakdowns. Integrated with warehouse management systems, these engines resequence dock appointments, allowing trucks to depart earlier and trim detention. Shippers gain dashboard visibility that flags excess carbon intensity per shipment, aligning with ESG scorecards. Carriers monetizing AI savings secure multi-year bids, reshaping competitive benchmarks in the North America Automotive Logistics market.
Restraints Impact Analysis of North America Automotive Logistics Market*
| Restraint | (~) % Impact on CAGR Forecast | Geographic Relevance | Impact Timeline |
|---|---|---|---|
| Economic cyclicality of auto output | -0.4% | North America-wide | Short term (≤ 2 years) |
| Driver shortage & wage inflation | -0.2% | United States, Canada | Medium term (2-4 years) |
| Battery-hazard regulations | -0.2% | North America-wide | Long term (≥ 4 years) |
| Port-side dwell-time fines | -0.1% | Coastal regions | Short term (≤ 2 years) |
| Source: Mordor Intelligence | |||
Driver Shortage & Wage Inflation
The commercial driver gap reached multi-tens-of-thousands of positions in 2025, straining capacity and lifting median pay[4]. Automotive freight suffers disproportionately because hazmat and car-haul endorsements narrow the qualified labor pool. Carriers raise sign-on bonuses and tuition reimbursement programs, yet still struggle to backfill retirements. Dedicated auto lanes face re-pricing every quarter as fleets chase the most profitable contracts. Autonomous-truck pilots show promise for hub-to-hub moves, but regulatory and public-acceptance barriers keep widescale deployment beyond the forecast horizon, preserving labor scarcity as a medium-term drag on the North America Automotive Logistics market.
Battery-hazard Regulations Constrain EV Logistics Capacity
Lithium-ion packs travel under Class 9 dangerous-goods codes that impose UN 3480-compliant packaging, real-time temperature logging, and placarded trailers. Only a subset of carriers invests in reinforced containers and fire-suppression kits, limiting available slots and pushing rates above standard component freight. Annual driver re-certification adds training hours and costs. Warehouses require fire-walls, negative-pressure rooms, and emergency-response plans, thinning the field of compliant sites. For urgent battery replacements, airfreight is often precluded, forcing ground expedites that stretch delivery timelines and compress margins throughout the North America Automotive Logistics market.
*Our forecasts treat driver/restraint impacts as directional, not additive. The impact forecasts reflect baseline growth, mix effects, and variable interactions.
North America Automotive Logistics Market Segment Analysis
By Service:
Transportation Dominance Amid Value-Added GrowthTransportation generated 51.45% of the North America Automotive Logistics market size in 2025, anchored by road haulage that shuttles components between tier-1 suppliers and assembly plants. Intermodal rail corridors link Mexican factories with Midwest hubs, benefiting from locomotive fleet upgrades that raise velocity. Airfreight retains a niche for high-value ECUs and urgent tooling. Value-added services—kitting, sequencing, and light assembly—are growing at a 2.95% CAGR (2026-2031) as automakers offload non-core tasks to 3PLs, freeing floor space for EV production lines.
Providers differentiate through digital twins that model plant inventories and push kanban replenishment, shrinking work-in-process buffers. Warehousing footprints add mezzanines for returns processing and battery-state-of-health diagnostics. The segment shift rewards integrators that can couple transport with in-plant material-handling teams and line-side just-in-sequence delivery. Consequently, value-added contracts are lengthening to five-plus years, locking in cross-selling potential across the wider North America Automotive Logistics market.

By Type:
Aftermarket Dynamism Outpaces OEM StabilityOEM flows still command 56.20% of the North America Automotive Logistics market share in 2025, supported by stable model-year production cycles and high-volume, repetitive lane structures. Yet, aftermarket logistics is accelerating at a 3.65% CAGR (2026-2031) on the back of aging vehicle fleets and click-to-door parts sales that require parcel networks and urban micro-hubs. Aftermarket SKUs exceed 500,000 part numbers, necessitating AI-driven slotting algorithms and robotic piece-picking to meet same-day delivery promises.
Reverse-logistics streams for core returns and battery recycling grow in parallel. OEM supply chains, bolstered by near-shored component production, concentrate on line-feeding precision and downtime avoidance, employing EDI-linked visibility dashboards. The divergence in service models encourages 3PLs to run discrete operating divisions, each tailored to the cadence and volatility of its customer segment within the North America Automotive Logistics industry.

By Cargo Type:
EV Battery Complexity Drives SpecializationFinished vehicles accounted for 40.30% of the North America Automotive Logistics market size in 2025, moving on double-deck car carriers and rail autoracks that now employ telematics to track jounce-and-tilt forces. Auto components follow as the volume leader by shipment count, yet yield slimmer per-lane revenues. EV batteries and power electronics, projected to rise 3.32% CAGR to 2031, command premium freight rates because of hazmat compliance and temperature-controlled requirements.
Specialized flat-rack containers with fire-retardant linings reduce thermal-runaway risk. Sensor arrays beam real-time state-of-charge data to control towers, where intervention protocols trigger should thresholds swing. Ancillary cargo—fluids, tires, and accessories—grows at market pace but must navigate evolving EPA disposal mandates. Cargo-type diversification thus fuels investment in modular equipment fleets able to flex across automotive product categories, deepening specialization within the North America Automotive Logistics market.
Geography Analysis
United States Automotive Logistics Market
The United States dominates the North America Automotive Logistics market, holding 78.35% share in 2025, thanks to entrenched production clusters, a comprehensive freight rail network, and dense interstate highways. Environmental rules and labor shortages elevate operating costs, spurring the adoption of electric yard tractors and driver-assist systems. Technology pilots scale rapidly because shippers prioritize real-time visibility and on-time performance across a vast domestic dealer network.
Mexico Automotive Logistics Market
Mexico is expected to post the fastest 3.98% CAGR to 2031 as OEMs shift EV and ICE model allocations southward to meet USMCA thresholds. Pacific port upgrades at Lázaro Cárdenas and Manzanillo add Ro-Ro lanes, while inland rail corridors integrate with new dry ports that pre-clear customs. Growing supplier parks around Monterrey and Guanajuato attract 3PL campuses offering bonded warehousing, sequencing, and yard management, making Mexico a magnet for fresh capital within the North America Automotive Logistics market.
Regulatory Landscape
Automotive logistics across North America is being shaped by emissions policy, hazardous-goods requirements, and trade enforcement connected to vehicle and parts movements. In the United States, Section 232 duties and related administrative steps add compliance work for cross-border flows: the Bureau of Industry and Security opened an automobile-parts tariff inclusions submission window in April 2026, and the Department of Commerce published procedures in May 2026 for administering an import adjustment offset tied to Section 232 duties (following an October 2025 expansion covering medium and heavy-duty vehicles and parts). These trade mechanisms increase the need for accurate documentation on parts classification, origin substantiation, and eligibility tracking, alongside standard customs filing.
In Canada, tariff and safety regimes affect both inbound and outbound vehicle flows and carrier operations. The United States Surtax Remission Order (Motor Vehicles 2026) entered into force on April 9, 2026, extending relief from Canada’s 25% counter-tariffs on CUSMA-compliant passenger vehicles and light trucks through April 8, 2027, supporting continued cross-border OEM distribution strategies. Canada is also consulting (as of April 2026) on updates under the Motor Vehicle Safety Act affecting Motor Vehicle Safety Regulations and related rules, while Transportation of Dangerous Goods regulations and CBSA pre-arrival/reporting requirements continue to govern battery and parts movements, especially for lithium-ion packs shipped under Class 9 dangerous-goods controls.
Value Chain Analysis
The North America automotive logistics value chain starts with inbound flows of raw materials and parts into tier suppliers and assembly plants, then moves into in-plant material handling and line feeding. From there, outbound distribution delivers finished vehicles to ports, rail ramps, and dealer networks, followed by aftermarket replenishment and reverse logistics. Core participants include OEMs and tier suppliers, freight forwarders and 3PLs (transport, warehousing, and in-plant services), railroads and truck carriers (including specialized car-haul and hazmat-certified fleets), port and terminal operators for Ro-Ro and container movements, customs brokers supporting USMCA-aligned trade, and technology providers covering visibility, routing, and yard management.
Recent corporate actions show where value is concentrating. Stellantis announced a USD 388 million Metro Detroit Megahub project (May 2025) to consolidate and modernize Mopar service parts distribution, reinforcing the role of high-throughput distribution centers and tighter order-cycle execution in aftermarket logistics. On the execution layer, shippers and 3PLs are using optimization tools for inbound planning and network design, including Rivian selecting Agillence for inbound logistics optimization software (October 2025). Cross-border continuity remains a key dependency, with labor stability at major gateways and ports influencing throughput reliability for both components and finished vehicles.
Competitive Landscape
Consolidation gives top providers scale economies, yet the North America Automotive Logistics market retains space for regional specialists. DSV’s takeover of DB Schenker in 2025 created a multibillion-dollar giant with integrated cross-dock-to-dealer capability. DHL’s acquisition of Inmar added reverse-logistics depth, particularly in e-commerce returns, strengthening end-of-life component flows for tier-1 suppliers.
Investment in AI routing and warehouse robotics is redefining service benchmarks; early adopters report 10-15% cost take-out alongside on-time improvements. Battery-logistics certification forms a new moat—companies with trained hazmat crews and fire-suppression-equipped trailers win dedicated contracts with EV makers. Patent activity in autonomous yard-shunting, previously a niche, accelerates as 3PLs seek labor-light models to offset wage inflation.
Vertical integration trends see carriers adding contract manufacturing services such as module sub-assembly inside warehouses adjacent to plants, locking in five-year+ agreements. Yet niche operators survive by mastering difficult lanes—mountain passes, winter routes, or cross-border paperwork—where giant platforms may lack agility. The resultant ecosystem marries scale efficiencies with specialist knowledge, sustaining diverse competition within the North America Automotive Logistics market.
North America Automotive Logistics Industry Leaders
-
DHL
-
C.H. Robinson
-
XPO Logistics
-
Penske Logistics
-
Ryder System Inc.
- *Disclaimer: Major Players sorted in no particular order
North America Automotive Logistics Market Companies Covered in this Report
- DHL
- C.H. Robinson
- XPO Logistics
- Penske Logistics
- Ryder System Inc.
- CEVA Logistics
- DSV A/S
- Kuehne + Nagel
- GEODIS
- Nippon Express
- United Parcel Service (UPS)
- Jack Cooper Transport
- Wallenius Wilhelmsen
- SEKO Logistics
- Yusen Logistics
- Buske Logistics
- Grupo Traxión
- Schneider National
- Omni Logistics
- Crowley Logistics
Market Opportunities and Future Outlook
Opportunity is growing around cross-border resiliency and faster, higher-frequency parts replenishment as USMCA-driven near-shoring and e-commerce parts flows change shipment profiles. Investments focused on strengthening the U.S.-Mexico manufacturing corridor and enabling time-definite service create room for multimodal integration, customs-enabled control towers, and facilities positioned at border nodes for kitting, sequencing, and returns processing. A concrete indicator is UPS committing USD 50 million (May 2026) to logistics network capabilities and dedicated industry teams, including new North American Air Freight time-definite services to and from Mexico, which raises the bar for speed and contingency options when ground capacity tightens.
A second opportunity area is technology-enabled orchestration for finished-vehicle and battery-adjacent flows, where visibility, appointment management, and asset utilization help reduce dwell and damage risk. Stellantis’ partnership activity around deploying the Agillence Lean Logistics Optimizer platform (May 2026) points to OEM pull for analytics-driven planning across complex distribution networks. On the shipper side, campus expansions also add logistics touchpoints, such as Toyota Motor North America announcing a USD 3.6 billion expansion at its San Antonio manufacturing campus (July 2026), which increases inbound and outbound activity across supplier lanes, yard operations, sequencing, and outbound distribution, supporting demand for dedicated capacity, cross-dock support, and value-added services close to plants.
Recent Industry Developments in North America Automotive Logistics Market
- July 2026: Toyota Motor North America announced a USD 3.6 billion expansion of its San Antonio manufacturing campus, adding 2.5 million square feet and a second vehicle assembly line. The added footprint increases inbound parts complexity and line-feeding requirements, while also expanding outbound finished-vehicle distribution needs across road and rail networks.
- April 2025: DSV closed its USD 14.9 billion acquisition of DB Schenker. The enlarged platform strengthens multimodal scale for OEM and aftermarket customers, supporting end-to-end coverage from cross-docks and contract logistics to international forwarding and cross-border execution.
- June 2024: Ryder opened a 228,000 sq ft warehouse in Nuevo Laredo and expanded its drayage yard to manage 250,000 annual border moves. The capacity addition reinforces the U.S.-Mexico automotive corridor with more staging, inventory positioning, and faster handoffs for parts and finished-vehicle related flows at a key gateway.
North America Automotive Logistics Market Report Scope and Research Methodology
Market Definition and Coverage
This market covers logistics services used to move, store, and handle vehicles, auto components, and related automotive cargo across the United States, Canada, and Mexico, from the point of origin through delivery and aftersales flows.
Scope exclusions: We exclude the standalone manufacturing value of vehicles and parts, as well as pure retail car sales activity that does not involve paid logistics service delivery.
Segments Covered in This Report
- By Service
- Transportation
- Road
- Rail
- Air
- Sea / Ro-Ro / Short-Sea
- Warehousing, Distribution & Inventory Management
- Value-added Services
- Transportation
- By Type
- OEM
- Aftermarket
- By Cargo Type
- Finished Vehicles
- Auto Components
- EV Batteries and Power-Electronics
- Other Cargo
- By Country
- United States
- Canada
- Mexico
Data Sources, Market Sizing, and Validation
Desk Research
We start by building a fact base on vehicle production, trade lanes, and freight activity that are linked to automotive supply chains. Public sources are used heavily for this step, such as transportation and freight statistics (for example, sources similar to US DOT and the Bureau of Transportation Statistics), customs and trade tables (such as US Census and USITC releases), and national statistical agencies (such as Statistics Canada and Mexico INEGI). Where the data is available and consistent, we also review port authority throughput disclosures and rail and trucking indicators.
To connect demand patterns with service pricing, we add company filings, investor presentations, reputable press coverage, and association publications that describe network changes, capacity additions, and contract structures. Paid subscriptions are used selectively for company financials and intelligence, news and financials, and shipment-level import and export views where they help validate corridor intensity and direction. The sources listed here are illustrative rather than exhaustive, and many other public and curated references are used for data collection, validation, and research clarification.
Primary Interviews and Surveys
We validate the desk-built view through interviews and surveys with logistics providers, freight and warehouse operators, automotive shippers, and industry advisors across North America. When details were not clear in public sources, we used these conversations to confirm mode mix shifts, typical contract terms, and how EV battery related handling changes storage and compliance requirements. Since cross-border activity is a defining feature, we balanced coverage across the US, Canada, and Mexico to avoid the model leaning on one country signal.
Distribution of primary research fieldwork respondents
| Company type | Respondent position |
|---|---|
| Top tier: 37% | CXOs: 13% |
| Mid tier: 42% | Functional/Unit leaders: 29% |
| Smaller Players: 21% | Managers: 58% |
Market-Sizing & Forecasting
For sizing, we use a top-down and bottom-up approach where automotive production, import and export flows, and cross-border corridor activity are used to reconstruct the addressable logistics spending pool in North America, followed by adjustments for service intensity by cargo type. Totals are then corroborated using selective bottom-up approximations, including sampled rate and price benchmarks applied to estimated volumes, and reasonableness checks against disclosed logistics revenue exposure in automotive-heavy networks.
Key inputs used in the model include vehicle output trends, parts and finished-vehicle trade values by partner country, mode shares across truck, rail, sea, and air movements, warehousing additions near automotive clusters, and EV battery and power-electronics handling requirements that change handling time and storage needs. When a variable is thin for a country or a corridor, we fill gaps using nearby lane behavior, then confirm direction and magnitude with primary feedback.
For forecasting, scenario analysis is used so different production paths, cross-border policy frictions, and freight cost cycles can be reflected without forcing one straight line. We select the forward view after reconciling these scenarios with expert expectations on OEM build schedules, supplier localization, and pricing progression across transportation and warehousing services.
Data Validation & Update Cycle
We run multiple checks before sign-off, including internal consistency tests across cargo types, country totals, and service splits, and then compare outputs with independent signals like production and trade direction, port and rail activity, and reported shifts in the freight environment. If a variance looks unusual, we review assumptions again and re-contact selected respondents to confirm whether the change is structural or temporary.
Reports are refreshed annually, and interim updates are made when major events can shift the market, such as trade rule changes, sharp production re-planning, or freight rate shocks. Before delivery, an analyst completes a fresh scan of recent data releases so clients receive the latest updated view.
Mordor Intelligence's North America Automotive Logistics Market Size Compared Against Other Published Estimates
Published numbers for automotive logistics in North America can look far apart because sources do not count the same services, cargo types, and geographies, and they also pick different base years and currency timing. Differences also appear when one estimate leans more on production value proxies, while another tries to link demand to physical movement, storage needs, and service pricing.
The spread is usually driven by what gets included under logistics, how cross-border flows are treated, and whether EV battery handling is counted with a separate service intensity. Some estimates also assume aggressive pricing uplift from freight rate spikes, while others smooth pricing using multi-year averages, which changes the starting point even before the forecast begins.
Benchmark comparison
| Source | Market Size | Gaps in Research Methodology |
|---|---|---|
| Mordor Intelligence | USD 51.93 B (2025) | |
| Industry Publication A | USD 66.37 B (2021) | Uses an earlier base year and commonly groups broader 3PL activity into the total, which can pull in general warehousing and freight that only partially serves automotive supply chains. |
| Consultancy Brief B | USD 92.11 B (2024) | Often applies higher assumed logistics spend per vehicle and faster price escalation, and it may not separate finished vehicles, components, and EV battery logistics with different handling and storage needs. |
The table shows a wide spread that largely traces back to scope and timing, and then to how pricing and service intensity are applied. Under Mordor Intelligence's scope, the number is tied to automotive-specific transportation, warehousing, distribution and inventory management, and value-added services across the US, Canada, and Mexico, and it is cross-checked against production and trade signals before the forecast is finalized.
Key Questions Answered in the Report
What is the 2026 value of the North America Automotive Logistics market?
The market stands at USD 53.81 billion in 2026.
How fast is the market expected to grow through 2031?
It is forecast to expand at a 3.61% CAGR to reach USD 64.23 billion by 2031.
Which geography is projected to record the quickest growth?
Mexico is forecast to post the fastest 3.98% CAGR through 2031.
Which service segment is expanding the fastest?
Value-added services such as kitting and sequencing are growing at 2.95% CAGR.
What cargo category commands premium pricing?
EV batteries and power-electronics, due to hazardous-materials compliance requirements.
How is consolidation influencing competition?
Large acquisitions like DSV-Schenker are creating integrated platforms, yet space remains for specialists serving niche lanes or battery logistics.