
Market Overview
| Study Period | 2020 - 2031 |
|---|---|
| Forecast Data Period | 2026 - 2031 |
| Historical Data Period | 2020 - 2024 |
| Market Size (2026) | USD 1.85 Billion |
| Market Size (2031) | USD 3.29 Billion |
| Growth Rate (2026 - 2031) | 12.19% CAGR |
| Market Concentration | Medium |
Major Players *Disclaimer: Major Players sorted in no particular order Image © Mordor Intelligence. Reuse requires attribution under CC BY 4.0. | |
North America Automated Guided Vehicle Market Analysis by Mordor Intelligence
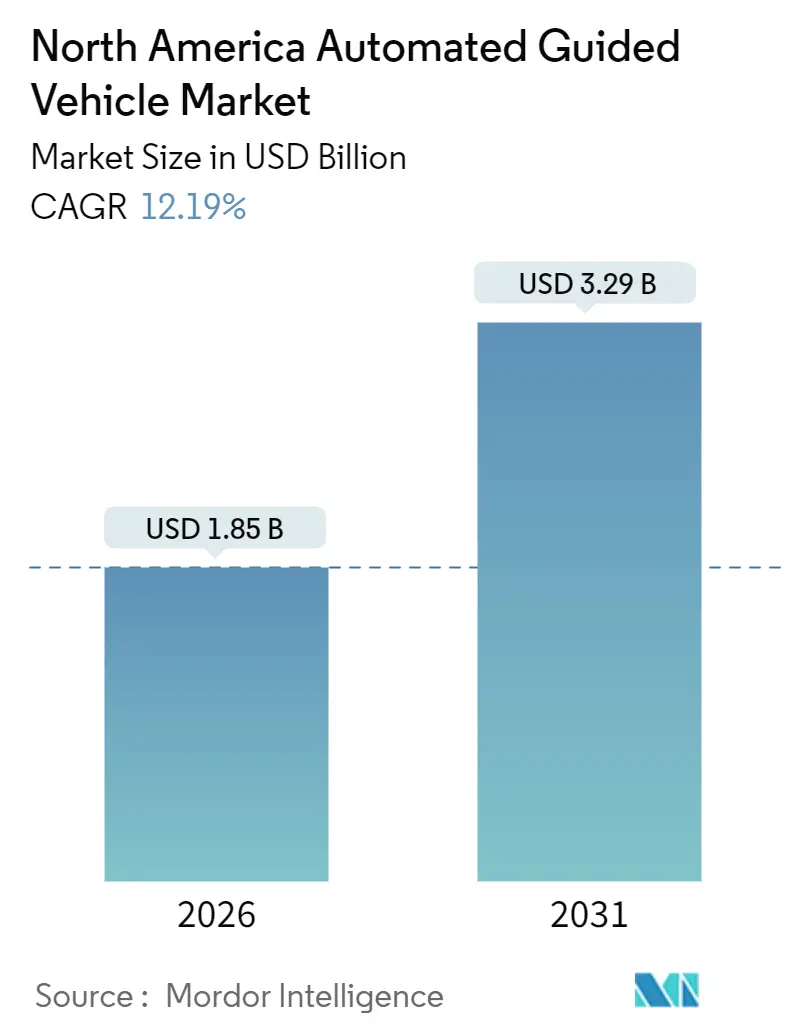
The North America automated guided vehicle market size is valued at USD 1.85 billion in 2026 and is projected to reach USD 3.29 billion by 2031, advancing at a 12.19% CAGR. E-commerce fulfillment density, electric-vehicle assembly complexity, and rising labor costs are expanding capital budgets for warehouse and factory automation, while AI-enabled fleet orchestration shortens payback periods by coordinating mixed fleets inside existing facilities. Brownfield retrofits now outnumber greenfield projects because software layers allow legacy fixed-path vehicles and new vision-guided units to share tasks, minimizing building modifications. Laser guidance remains dominant for heavy-duty routes, yet camera-based navigation is scaling quickly as sensor prices fall and open-source SLAM toolkits simplify integration. Power-train choices are shifting in parallel: lithium-ion packs are displacing lead-acid on lifetime-cost grounds, especially in continuous-shift warehouses. Collectively, these trends are stabilizing deployment risk and deepening penetration across logistics, manufacturing, and cold-chain environments, reinforcing a positive outlook for the automated guided vehicle (AGV) market.
Key Report Takeaways
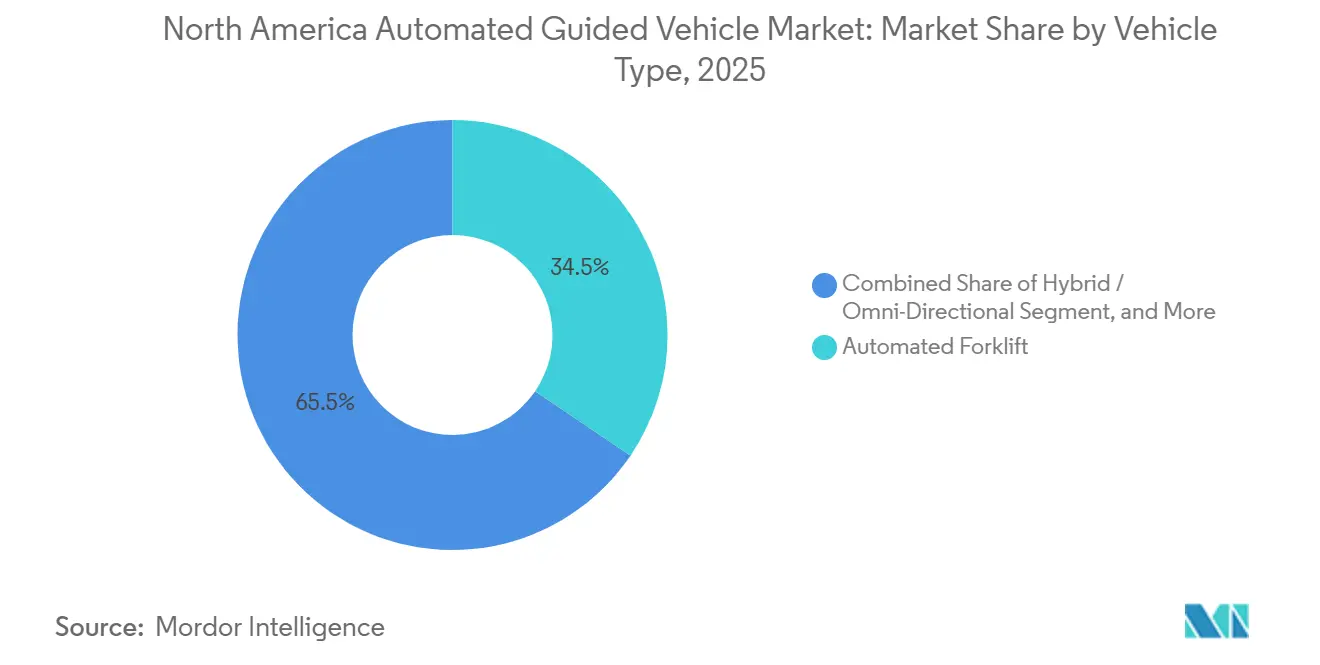
- By vehicle type, automated forklifts held a 34.49% automated guided vehicle market share in 2025. Hybrid and omni-directional vehicles are forecast to expand at a 12.94% CAGR through 2031.
- By navigation technology, laser guidance led with 58.11% revenue share in 2025. Vision and SLAM guidance are projected to grow at a 12.55% CAGR to 2031.
- By component, hardware captured 62.24% of spending in 2025. Software is advancing at a 13.11% CAGR through 2031.
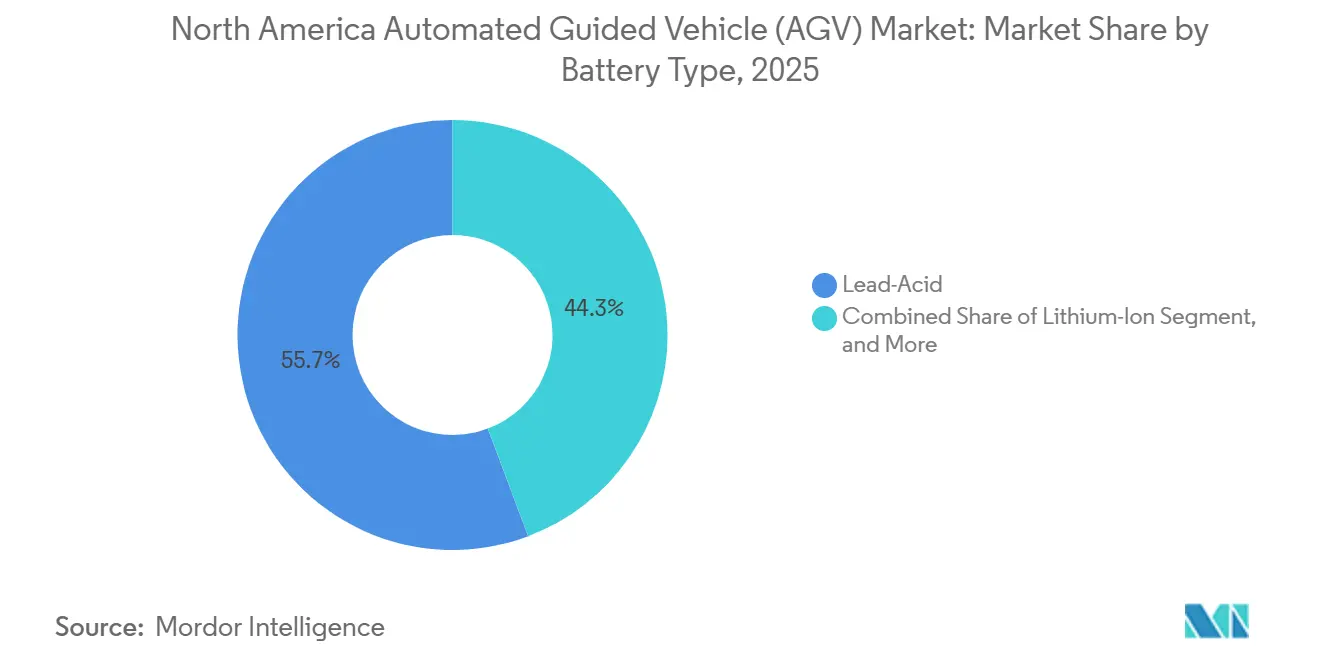
- By battery type, lead-acid retained a 55.74% share in 2025. Lithium-ion batteries are poised to rise at a 13.31% CAGR by 2031.
- By end-user industry, automotive commanded 30.10% demand in 2025. Logistics and warehousing are expected to post a 12.74% CAGR through 2031.
- By geography, the United States accounted for 82.39% of 2025 revenue. Mexico is set to record a 13.53% CAGR to 2031.
Note: Market size and forecast figures in this report are generated using Mordor Intelligence’s proprietary estimation framework, updated with the latest available data and insights as of January 2026.
North America Automated Guided Vehicle Market Trends and Insights
Drivers Impact Analysis*
| Driver | (~) % Impact on CAGR Forecast | Geographic Relevance | Impact Timeline |
|---|---|---|---|
| E-commerce Fulfillment Boom Accelerating Warehouse Automation Adoption | +2.80% | United States (primary), Canada (secondary), Mexico (emerging) | Short term (≤ 2 years) |
| Rising Labor Costs and Shortages in U.S. and Canadian Logistics Hubs | +2.30% | United States and Canada, concentrated in Midwest and Ontario | Medium term (2-4 years) |
| Automotive OEM Re-tooling for EV Platforms Demanding Flexible Material Flow | +1.90% | United States (Michigan, Tennessee, Kentucky), Canada (Ontario), Mexico (Nuevo León, Guanajuato) | Medium term (2-4 years) |
| Stricter Workplace-Safety Regulations Mandating Ergonomic Material Handling | +1.40% | United States (OSHA jurisdiction), Canada (provincial labor codes) | Long term (≥ 4 years) |
| Expansion of U.S. On-shoring Incentives Fueling Greenfield Smart-Factory Builds | +1.60% | United States (Rust Belt, Southeast), Mexico (border states) | Long term (≥ 4 years) |
| AI-Enabled Fleet Orchestration Unlocking Multi-Robot ROI in Brownfield Sites | +2.00% | United States (brownfield retrofits), Canada (limited), Mexico (greenfield integration) | Medium term (2-4 years) |
| Source: Mordor Intelligence | |||


E-Commerce Fulfilment Boom Accelerating Warehouse Automation Adoption
Rising same-day delivery expectations are pushing 3PLs and retailers to upgrade legacy facilities with goods-to-person workflows powered by AGVs. Amazon deployed more than 750,000 mobile robots by late 2024 and continues to scale fleets to meet order-cycle targets. Walmart invested USD 200 million in automated forklifts across 42 regional DCs in 2024, targeting a 30% drop in injury rates. As U.S. online retail penetration reached 16.3% of total sales in 2025, AGV installations clustered in Texas, California, Pennsylvania, and Ohio, where fulfillment density justifies capital intensity. The automated guided vehicle market benefits from this shift away from conveyor-bound sortation toward mobile systems that flex with SKU proliferation. With Canada and Mexico following similar trajectories, albeit at lower e-commerce baselines, the driver remains the single largest uplift to near-term demand.
Rising Labor Costs and Shortages in Logistics Hubs
Median hourly wages for U.S. material movers climbed to USD 17.85 in 2025, a 22% increase since 2020, while vacancy rates in inland logistics corridors topped 8% despite signing bonuses. Automation economics now favor replacing two full-time positions with one lithium-ion forklift at a capital cost of USD 80,000, yielding payback inside 24 months. Turnover costs compound savings, as each employee exit can cost 50% to 60% of annual salary in recruitment and downtime. Consequently, the automated guided vehicle market is widening the competitive divide between large operators with cheap capital and mid-sized firms struggling to self-finance. Canada shows identical wage inflation patterns in Ontario’s Golden Horseshoe region, while Mexico’s labor cost advantage tempers but does not negate automation pull, especially for export-oriented factories.
Automotive OEM Re-Tooling for EV Platforms Demanding Flexible Material Flow
Ford allotted USD 5 billion to modernize Michigan and Tennessee plants in 2024, embedding vision-guided AGVs that reroute battery trays in real time. General Motors orchestrated 120 mixed-fleet vehicles at Spring Hill in 2025, cutting staging time by 35%. Stellantis introduced omni-directional carriers in Ontario to maneuver oversized packs through constrained aisles. Battery modules worth USD 10,000 to USD 15,000 require gentle handling, and AGVs deliver sub-centimeter accuracy while mitigating human-error risk. Mexico’s new EV factories in Nuevo León and Guanajuato are designing AGV lanes from day one, illustrating how nearshoring and electrification jointly lift the automated guided vehicle market.
AI-Enabled Fleet Orchestration Unlocking Multi-Robot ROI in Brownfield Sites
Machine-learning platforms now allocate tasks, schedule charging, and predict maintenance across heterogeneous fleets, lifting throughput by nearly 30% without adding hardware. Locus Robotics secured USD 150 million in 2025 to globalize its SaaS orchestration layer. OTTO Motors demonstrated a 40% productivity gain coordinating 80 cross-brand vehicles at a Michigan auto supplier. By abstracting navigation differences, software lets operators prolong legacy assets, smoothing capex and densifying adoption curves. For the automated guided vehicle market, this driver sustains double-digit growth even in facilities with existing automation footprints.
Restraints Impact Analysis*
| Restraint | (~) % Impact on CAGR Forecast | Geographic Relevance | Impact Timeline |
|---|---|---|---|
| High Up-Front System and Integration Costs for Mid-Sized Warehouses | -1.70% | United States (regional distribution centers), Canada (secondary markets) | Short term (≤ 2 years) |
| Intermittent Wireless Dead-Zones in Large Metal-Dense Facilities | -0.90% | United States (automotive, heavy manufacturing), Mexico (aerospace, automotive) | Medium term (2-4 years) |
| Limited Skilled Technicians for AGV Maintenance in Secondary Cities | -1.10% | United States (Tier 2 and Tier 3 cities), Canada (outside Greater Toronto Area), Mexico (interior states) | Long term (≥ 4 years) |
| Emerging AMR Alternatives Cannibalizing Fixed-Path AGV Spending | -1.50% | United States (e-commerce, third-party logistics), Canada (limited), Mexico (minimal) | Medium term (2-4 years) |
| Source: Mordor Intelligence | |||
High Up-Front System and Integration Costs for Mid-Sized Warehouses
A turnkey AGV deployment in a 200,000 square-foot facility can require USD 1.5 million to USD 2.5 million before workflow engineering and staff training. Integrators often add 30% to 40% for customization and safety validation, stretching payback beyond five years for operators with revenue below USD 50 million. Short lease terms in U.S. distribution real estate, averaging six years, further hinder amortization. As a result, automation density remains concentrated among large enterprises, slowing penetration of the automated guided vehicle market in the mid-tier segment. Vendors responding with modular, infrastructure-light offerings could soften this drag over the forecast window.
Emerging AMR Alternatives Cannibalizing Fixed-Path AGV Spending
Vision-guided autonomous mobile robots entered North America with 35% year-on-year shipment growth in 2024, dwarfing AGV unit gains. Chinese entrants such as Geek+ price systems 30% below European rivals, tempting e-commerce operators that refit floor layouts seasonally. While AGVs still dominate loads above 1,500 kilograms, AMRs threaten pallet-handling niches that favour route flexibility. The cannibalization risk is most acute for general warehouses in the United States, where lease constraints discourage fixed infrastructure, placing downward pressure on certain pockets of the automated guided vehicle market.
*Our forecasts treat driver/restraint impacts as directional, not additive. The impact forecasts reflect baseline growth, mix effects, and variable interactions.
Segment Analysis
By Vehicle Type: Forklift Dominance Meets Omni-Directional Agility
Automated forklifts retained 34.49% of 2025 revenue as factories replaced diesel units with lithium-ion models to satisfy OSHA air-quality rules and slash maintenance downtime. This mature cohort underpins the North America automated guided vehicle market, yet hybrid and omni-directional carriers are emerging with a 12.94% growth trajectory fueled by cold-storage and pharma demand for lateral motion. Tow and tugger trains remain staples in automotive kitting, whereas unit-load carriers automate inbound pallet transfers in cross-docks. Assembly-line vehicles, fitted with lift tables and vision sensors, secure battery packs with millimeter precision. Special-purpose machines serve hazardous and cleanroom niches, justifying premium margins and buffering vendors against price-led competition.
During 2025-2026, manufacturers began pairing collaborative arms with mobile bases, converting transport platforms into manipulation systems that pick or inspect components on the fly. Toyota’s cobot-equipped forklift debuted in 2025, signaling a convergence of mobility and dexterity that could compress fleet sizes. Lithium-ion retrofit kits broaden upgrade options, while predictive-maintenance software pushes uptime toward 98%, reinforcing the North America automated guided vehicle market’s shift from capital purchase to performance subscription.


By Navigation Technology: Laser Incumbency Faces Vision Disruption
Laser guidance owned 58.11% of 2025 revenue thanks to proven reflector grids in high-throughput automotive and food plants. Still, camera-based vision and SLAM platforms are expanding at a 12.55% CAGR as image-sensor costs fall and open-source libraries mature. Operators in leased distribution centers favour infrastructure-free navigation to avoid landlord approvals, propelling vision adoption. Magnetic and inductive lines linger in outdoor mills and metal-dense environments where reflections or dust confound optics. Natural navigation blends GPS, IMU, and lidar for port yards and container terminals, providing bridge technology between indoor and outdoor zones.
Competitive intensity is reshaping price curves. Chinese vendors use low-cost cameras to undercut European laser players, compelling incumbents to emphasize software differentiation. OTTO Motors achieved sub-10-millimeter precision by fusing cameras with lidar, proving parity with lasers in structured aisles. As multi-sensor fusion matures, the North America automated guided vehicle market may see a gradual phase-out of reflector maintenance budgets, freeing opex for fleet expansion.
By Component: Hardware Revenue Dominance Yields to Software Subscription Growth
Hardware captured 62.24% of 2025 spend, reflecting heavy chassis, drive trains, and sensing suites. Fleet refresh cycles, especially swapping lead-acid packs for lithium-ion, kept hardware billing strong. Yet software revenue is set to climb 13.11% annually through 2031 as subscription models tie vendor income to uptime and throughput. Locus, Seegrid, and OTTO offer per-vehicle or per-task fees, embedding AI analytics, traffic management, and cybersecurity updates in recurring contracts. Services, while the smallest slice, benefit from operators outsourcing 24/7 monitoring and predictive maintenance.
For buyers, the pivot toward SaaS reallocates capital outlay into operating budgets, reducing hurdle rates and broadening eligibility for mid-market adopters. Vendors gain stickier relationships and data-driven upsell pathways. As multi-site operators demand enterprise dashboards, interoperability APIs become decision criteria, anchoring software’s centrality to the automated guided vehicle market.

By Battery Type: Lead-Acid Incumbency Erodes as Lithium-Ion Economics Improve
Lead-acid held 55.74% share in 2025, anchored by lower sticker prices and a legacy fleet tuned to its voltage curves. However, opportunity charging, longer cycle life, and floor-space liberation tilt economics toward lithium-ion, now growing 13.31% annually. Pack prices fell 20% in 2024 on lithium-iron-phosphate overcapacity, slicing payback to two years in 24-hour operations. Retrofit kits from Toyota and Jungheinrich cut changeover cost, accelerating swap-out cycles. Nickel-cadmium cells serve sub-zero warehouses, whereas hydrogen fuel cells stay experimental, hampered by USD 50,000-plus unit prices and scant fuelling networks.
Regulatory catalysts could accelerate zero-emission mandates, but today economics alone is driving migration. As lead-acid fades, vendors embedding battery-analytics software capture additional subscription revenue, further reinforcing the service-heavy direction of the North America automated guided vehicle market.
By End-User Industry: Automotive Leadership Faces Logistics Surge
Automotive accounted for 30.10% of demand in 2025, buoyed by EV platform refits requiring flexible, heavy-payload movement. Decades-old conveyor lines give way to vision-guided carriers that accommodate varied battery geometries. Yet logistics and warehousing is on track for a 12.74% CAGR, lifted by peak-season scalability needs at Amazon, Walmart, DHL, and UPS. Food and beverage operators automate sub-zero pallet moves to curb exposure times, while electronics assemblers deploy cleanroom AGVs that avoid electrostatic discharge. Healthcare institutions use unit-load vehicles for pharmacy delivery, freeing clinical staff for patient care.
The automated guided vehicle market thus evolves into a portfolio play: heavy-duty precision in automotive, high-velocity flexibility in e-commerce, and specialized compliance in cold chain and healthcare. Vendors aligning roadmaps to vertical pain points are positioned to outpace generic hardware suppliers.
Geography Analysis
The United States dominated the North America automated guided vehicle market with an 82.39% revenue share in 2025. Amazon’s 750,000-plus mobile robots exemplify scale, while Walmart’s USD 200 million forklift rollout underscores mainstream retail adoption. Onshoring incentives under the CHIPS and Science Act motivate semiconductor and battery plants in the Midwest and Southeast to embed AGV lanes during construction. Up-front integration costs remain a barrier for mid-sized warehouses on six-year leases, leaving growth concentrated among corporates with balance-sheet strength.
Mexico is the region’s growth pacesetter at 13.53% CAGR, propelled by nearshoring, labor arbitrage, and EV investment corridors. Tesla’s USD 5 billion Nuevo León plant will integrate AGVs from day one, and BMW and GM follow similar blueprints. Aerospace clusters in Baja California and electronics hubs in Jalisco extend adoption beyond automotive. Nevertheless, capital and skills gaps among domestic small-to-medium enterprises limit nationwide diffusion, keeping volume centered in multinational greenfield.
Canada’s market growth trails its neighbors, bound by fewer large facilities and the absence of U.S.-level automation tax credits. Ontario’s EV supply chain leverages AGVs for battery module staging, and 3PL pilots in Quebec aim to mitigate warehouse labor shortages. Cross-border parent companies dictate platform choices, driving harmonization but capping independent momentum. Overall, geographic expansion of the automated guided vehicle market mirrors investment incentives and industrial footprints across North America.
Regulatory Landscape
Safety and compliance for AGV deployments in North America are anchored by ANSI/ITSDF B56.5-2024, which covers driverless automatic guided industrial vehicles and automated functions of manned industrial vehicles. In practice, employers align system design and site commissioning to B56.5-2024 elements such as facility-specific risk assessment, emergency stop functions, speed limiting, and personnel detection, while enforcement in the United States commonly ties to OSHA powered industrial truck requirements (29 CFR 1910.178) and the General Duty framework used during inspections.
Trade and industrial policy also shapes the bill of materials for AGVs and fleet-orchestration hardware. The USTR 2026 Trade Policy Agenda and related Federal Register actions on adjusting imports of semiconductors and related equipment (January 2026) introduced procurement volatility for compute and electronics used in vision/SLAM navigation and AI scheduling, which led buyers and OEMs to track duty changes and exemptions alongside workplace compliance requirements.
Value Chain Analysis
The value chain starts with core components (steel chassis, drive systems, safety PLCs, controllers, lidar/cameras, and battery packs), then moves through vehicle OEMs, software suppliers (fleet management, dispatching, and analytics), and system integrators that run site surveys, simulation, safety validation, and go-live support. In North America, large material handling groups (for example, Toyota, Dematic, Daifuku, and Swisslog) increasingly package hardware, controls, and orchestration into end-to-end offerings, while specialists differentiate through software layers that coordinate mixed fleets and manage charging, traffic, and exception handling.
Upstream supply constraints and infrastructure dependencies affect delivery timelines and total cost. In the period around 2025, evidence pointed to extended lead times for electric industrial equipment and battery packs, and dispatching software emerging as an operational bottleneck as fleets scale. Logistics disruptions at North American ports also posed risks for electronics and drivetrain subassemblies. At the deployment layer, automation-grade wireless has become a key enabler; for example, Toyota Automated Logistics and Motive Companies used a private cellular network (GXC) at Raymond Wests 200,000-square-foot Cypress, California facility (April 2026) to support reliable connectivity for automated vehicle operations, reinforcing that networks, integrators, and lifecycle service contracts now factor into purchasing decisions alongside vehicles.
Competitive Landscape
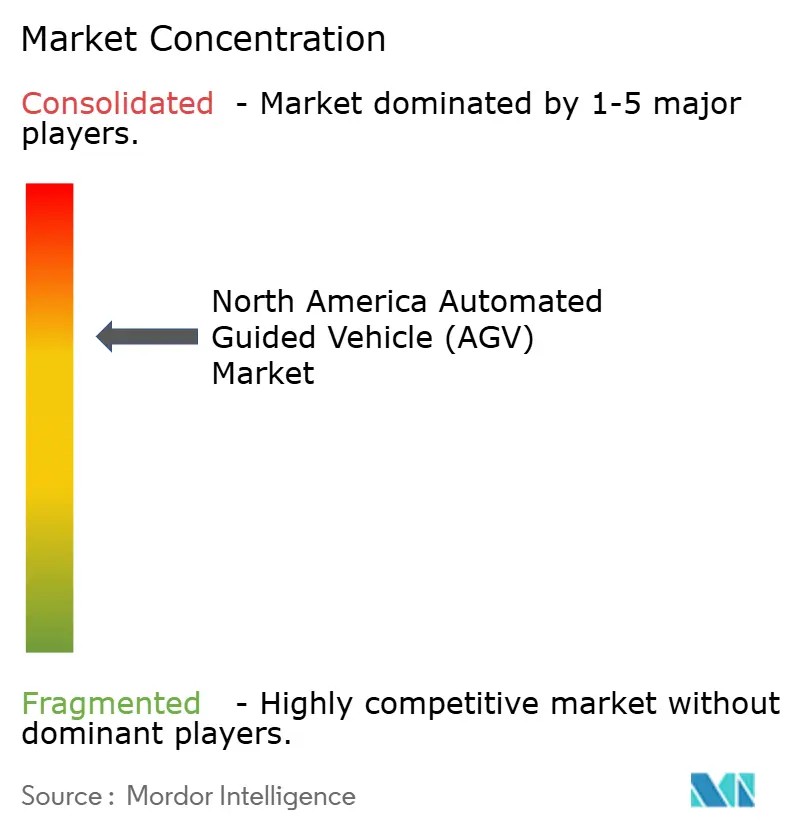
The North America automated guided vehicle market is moderately fragmented: the top five suppliers, Daifuku, Dematic, Toyota Material Handling, Jungheinrich, and Swisslog, collectively hold roughly 45% to 50% revenue. Dematic’s 2024 purchase of Reddwerks added orchestration software, evidencing a pivot toward end-to-end solutions.
Venture-backed challengers such as Locus Robotics, Seegrid, and OTTO Motors raised more than USD 300 million since 2024, pairing subscription pricing with rapid deployment for e-commerce hubs. Chinese entrants like Geek+ and Quicktron discount hardware by up to 40%, compressing margins and pushing incumbents toward services and vertical integration.
Technology competition now centers on AI fleet intelligence, cobot integration, and battery analytics. OTTO’s cobot-armed carrier performed pick-and-place at a Michigan auto supplier in 2025, consolidating tasks and improving capital efficiency. Service portfolios, from 24/7 remote monitoring to predictive spare-parts logistics, are emerging as key differentiators as hardware commoditizes. With no single player above a 20% share, the market remains open for consolidation and specialization.
North America Automated Guided Vehicle Industry Leaders
John Bean Technologies Corporation
Seegrid Corporation
Toyota Material Handling
Swisslog Holding AG (KUKA AG)
Daifuku Co. Ltd
- *Disclaimer: Major Players sorted in no particular order

Market Opportunities and Future Outlook
Battery, EV, and energy-storage manufacturing corridors create a near-term whitespace for heavy-payload, high-accuracy material flow where damage risk and traceability requirements favor guided vehicles integrated with plant execution systems. A clear reference point is T-Robotics securing a supply contract in June 2026 for unmanned guided vehicles to support Ford Energy at an energy storage systems production plant in Kentucky, which fits demand pull from new production lines that require repeatable kitting, staging, and closed-loop transport.
Software and interoperability also represent a second opportunity area, particularly for making brownfield retrofits practical when facilities run mixed fleets across AGVs and AMRs. Buyers increasingly treat dispatching, traffic management, and cross-vendor interoperability as constraints, which creates room for platforms that reduce integration risk and enable phased migration from fixed infrastructure to vision/SLAM navigation. Procurement behavior that emphasizes domestic industrial capability, including U.S. actions around semiconductor supply and equipment imports in 2026, is also lifting interest in resilient sourcing and standardized interfaces across compute, sensors, and controls used in mobile automation deployments.
Recent Industry Developments
- July 2026: JBT Automated Systems rebranded to FORMOVA, positioning the business around Total Automation Intelligence for mission-critical operations. The rebrand consolidates messaging around integrated automation and software-led orchestration, aligning with buyer demand for end-to-end deployment and lifecycle support rather than standalone vehicles.
- April 2026: Toyota Industries launched Toyota Automated Logistics (TAL) as a global partner focused on integrated logistics process automation. The consolidation brings warehouse automation capabilities under a clearer umbrella, supporting multi-site customers that want standardized platforms spanning vehicles, software, and integration services.
- November 2024: Seegrid terminated its product and distribution agreements with Raymond Corporation and shifted toward a direct sales model for its autonomous vehicle offerings. This change tightened Seegrids control over customer relationships and support, and it altered channel dynamics for automated vehicle deployments in North America.


Research Methodology Framework and Report Scope
Market Definition and Coverage
For this study, the market covers revenue generated from automated guided vehicles used for indoor material movement in industrial and logistics sites across North America, including associated software and services when they are sold for AGV operation.
Scope exclusions: We exclude manually driven industrial trucks, fixed automation like conveyors, and general warehouse robotics that do not navigate as AGVs.
Segmentation Overview
- By Vehicle Type
- Automated Forklift
- Tow/Tugger
- Unit Load Carrier
- Assembly Line Vehicle
- Hybrid / Omni-Directional
- Special Purpose Vehicle
- By Navigation Technology
- Laser Guidance
- Magnetic Guidance
- Vision / SLAM Guidance
- Inductive / Wire Guidance
- Natural Navigation
- By Component
- Hardware
- Software
- Services
- By Battery Type
- Lead-Acid
- Lithium-Ion
- Nickel-Based
- Fuel Cell
- By End-User Industry
- Automotive
- Food and Beverage
- Retail and E-commerce
- Electronics and Electricals
- General Manufacturing
- Healthcare and Pharmaceuticals
- Logistics and Warehousing
- By Country
- United States
- Canada
- Mexico
Data Sources, Market Sizing, and Validation
Desk Research
Desk research was used to build the base structure of the model and keep assumptions realistic for North America. We relied on public sources such as US Census Bureau manufacturing and trade tables, US International Trade Commission customs statistics, Bureau of Labor Statistics wage and productivity series, and Federal Reserve industrial production indicators. For safety and operating context, we also reviewed guidance and statistics from sources such as OSHA and other public workplace safety references.
To connect these macro signals to AGVs, we layered in company filings, investor presentations, reputable press, and association websites that discuss automation adoption and capex direction. A paid subscription for company financials and a separate patent database were used selectively to confirm product focus areas and to cross-check investment momentum. These examples are not exhaustive, and many other sources were also referenced for data collection, validation, and clarification.
Primary Interviews and Surveys
Primary interviews and surveys were used to stress test the desk assumptions and to understand how AGV deployments are priced and purchased in the region. We spoke with a mix of AGV solution providers, component and software ecosystem participants, and end users from manufacturing and logistics, and then we rechecked key inputs across the United States, Canada, and Mexico to reduce single-country bias.
Distribution of primary research fieldwork respondents
| Company type | Respondent position | Region |
|---|---|---|
| Top tier: 37% | CXOs: 13% | |
| Mid tier: 48% | Functional/Unit leaders: 32% | |
| Smaller Players: 15% | Managers: 55% |
Market-Sizing & Forecasting
Sizing started with a top-down build where industrial output, warehousing and fulfillment activity, and automation capex signals were used to reconstruct the addressable demand pool for AGVs in North America. Those totals were then corroborated with selective bottom-up approximations, where sampled fleet additions by facility type, typical project sizes, and observed price bands were multiplied and compared back to the top-down view.
Key inputs used in the model included distribution center expansion and utilization signals, manufacturing investment cycles, labor availability and wage pressure, battery and charging preferences that affect system cost, and navigation mix (for example, laser and vision based guidance) that shifts average selling price. Where supplier or integrator data was missing, gaps were handled through range assumptions that were kept only when they matched multiple interview checks.
For the forecast, scenario analysis was applied, with a base case anchored to expected warehouse build-outs, manufacturing reshoring and modernization plans, and the pace of automation adoption confirmed in interviews. Growth rates were then moderated in years where macro indicators and customer budgets pointed to slower project approvals.
Data Validation & Update Cycle
Model outputs were checked against independent signals such as industrial production trends, import patterns for relevant equipment classes, and disclosed automation capex commentary from major users. When a value or growth rate looked unusual, the driver assumptions were reviewed, and follow-up calls were triggered to confirm whether the variance came from pricing, scope, or timing.
Before sign-off, the work goes through multiple analyst reviews where formulas, units, and year-to-year movements are validated, and then the narrative is aligned to the quantified results. Reports are refreshed annually, and interim updates are made when material events affect pricing, supply availability, or adoption. Right before delivery, a fresh pass is completed so clients receive the latest updated view.
Mordor Intelligence's North America Automated Guided Vehicles Market Size Compared Against Other Published Estimates
Published numbers for this market often do not match because firms choose different year anchors, include different solution elements, and apply different pricing and adoption assumptions. Even when the geography looks similar, the counted revenue can shift based on whether software and services are treated as part of the AGV market or left outside.
The table shows a spread that is mainly explained by scope and timing differences, where some studies emphasize only vehicle hardware sales or use older price points that do not reflect recent shifts in lithium-ion adoption and navigation system mix. It also depends on whether totals are built from facility demand signals and then cross-checked with supplier patterns, or whether a single segment build is scaled up without enough checks.
Benchmark comparison
| Source | Market Size | Gaps in Research Methodology |
|---|---|---|
| Mordor Intelligence | USD 1.85 B (2026) | |
| Regional Research Firm A | USD 0.90 B (2024) | Uses an earlier base year and appears closer to a hardware-only view, which can undercount projects where software and commissioning services are bundled into the deal value. |
| Industry Databook B | USD 1.42 B (2025) | Uses a different year anchor and a narrower revenue capture for services, which can shift totals when multi-year deployments are recognized differently across the region. |
The table points to a consistent pattern, and in Mordor Intelligence's model the value includes AGV-related software and services only when they are directly tied to AGV operation and deployment in North America. By keeping the inputs tied to observable demand signals and then rechecking them with interview-based price and mix assumptions, the final number remains traceable and repeatable for planning use.


Key Questions Answered in the Report
What is the current value of the North America automated guided vehicle market?
The automated guided vehicle market size in North America stands at USD 1.85 billion in 2026.
How fast is the market expected to grow over the next five years?
The market is projected to expand at a 12.19% CAGR, reaching USD 3.29 billion by 2031.
Which vehicle type holds the largest share today?
Automated forklifts lead with a 34.49% share because factories are replacing diesel units with lithium-ion electric models.
Why are lithium-ion batteries gaining popularity in AGVs?
Lithium-ion packs enable opportunity charging, support 3,000-plus cycles, and free floor space, shortening payback periods to around two years.
Which country will experience the fastest growth in AGV adoption?
Mexico is forecast to grow at a 13.53% CAGR through 2031 as nearshoring fuels greenfield smart-factory construction.
How are software subscriptions changing AGV economics?
Vendors now bundle AI fleet management and predictive maintenance into monthly fees, minimizing upfront capex and aligning costs with performance gains.
Page last updated on:






