
North America ATV and UTV Market Size and Share
Market Overview
| Study Period | 2020 - 2031 |
|---|---|
| Forecast Data Period | 2026 - 2031 |
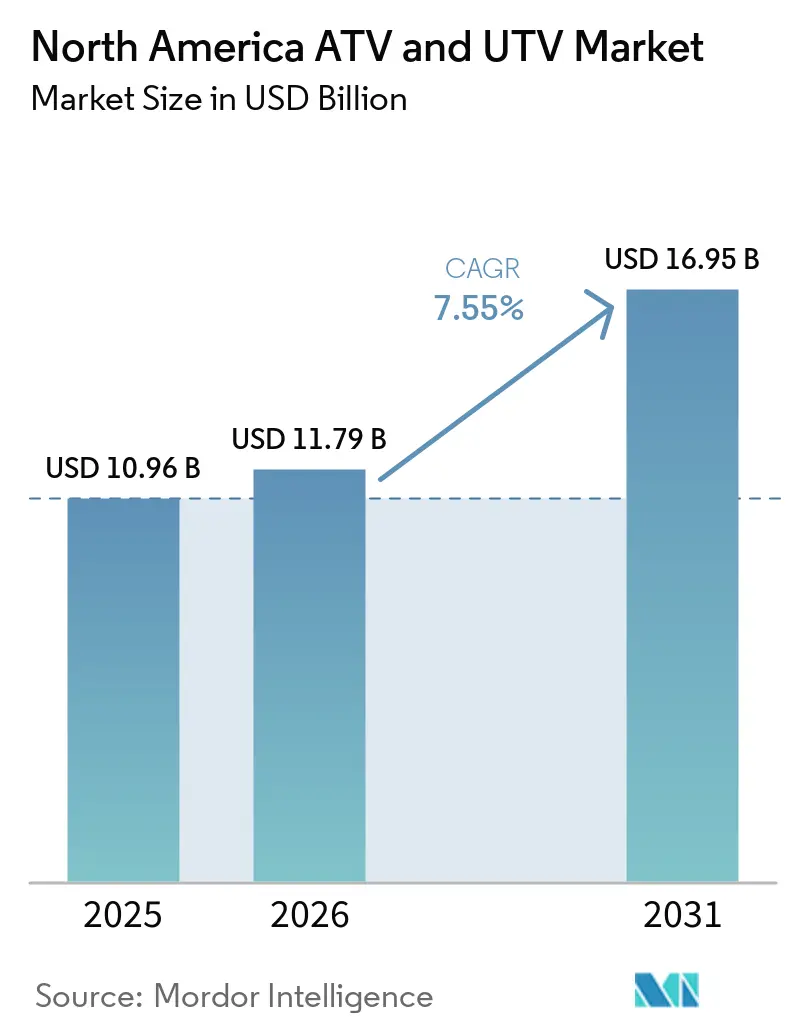
| Base Year Market Size (2025) | USD 10.96 Billion |
| Market Size (2026) | USD 11.79 Billion |
| Market Size (2031) | USD 16.95 Billion |
| Growth Rate (2026 - 2031) | 7.55 % |
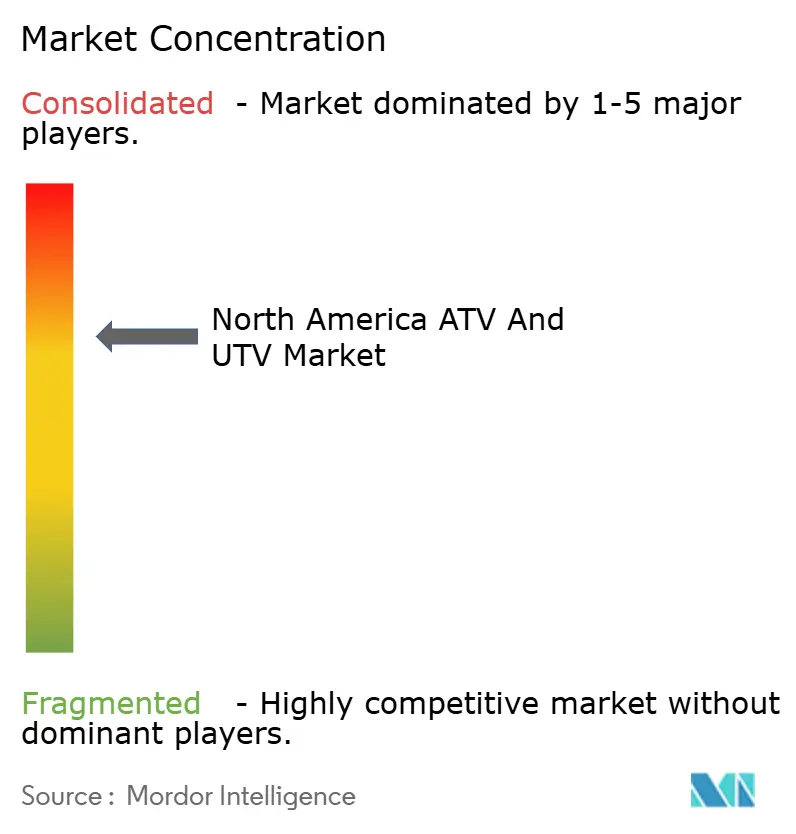
| Market Concentration | Medium |
Major Players *Disclaimer: Major Players sorted in no particular order Image © Mordor Intelligence. Reuse requires attribution under CC BY 4.0. | |
North America ATV and UTV Market Analysis by Mordor Intelligence
The North America ATV and UTV market size in 2026 is estimated at USD 11.79 billion, growing from 2025 value of USD 10.96 billion with 2031 projections showing USD 16.95 billion, growing at 7.55% CAGR over 2026-2031. Robust demand is rooted in recreational trail expansion, precision-farming uptake, and ongoing military procurement, while OEM design roadmaps emphasize electrified drivetrains and digitally controlled safety systems. Persistent growth of utility terrain vehicles (UTVs) safeguards revenue stability as these platforms now integrate factory-installed telematics, autonomous-ready wire-harnesses, and modular cargo solutions that lower the total cost of ownership for farms and public agencies. Electric side-by-sides gain traction in noise-sensitive tourism zones and conservation areas. Yet, gasoline powertrains remain dominant among price-sensitive segments because of their lower upfront cost and established refueling infrastructure. Competitive intensity has heightened after Textron divested Arctic Cat and Polaris confronted retail decline in Q3 2024, prompting aggressive model refreshes, dealer incentive programs, and localization of component supply chains.
Key Report Takeaways
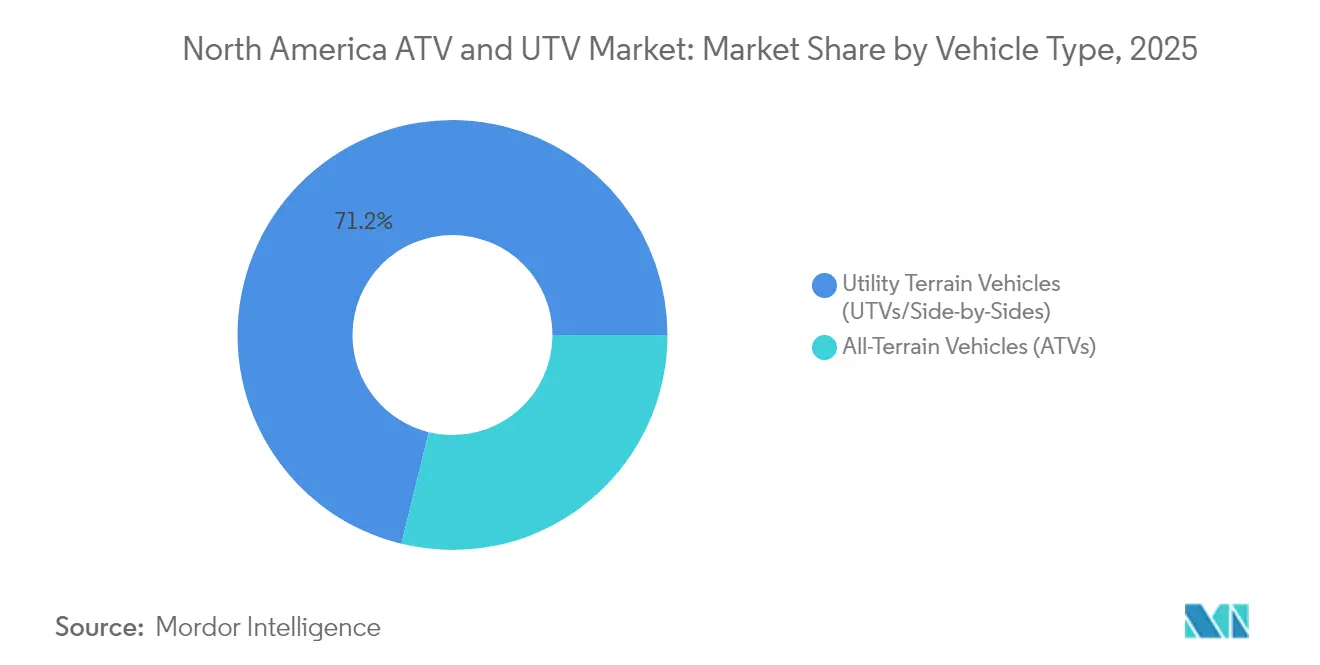
- By vehicle type, utility terrain vehicles captured 71.18% of the North America ATV and UTV market share in 2025 and are advancing at a 7.66% CAGR to 2031.
- By propulsion, gasoline platforms accounted for 62.67% of the North America ATV and UTV market size in 2025, while electric models recorded the fastest 7.62% CAGR through 2031.
- By end-use, recreation and sports retained 72.85% of the North America ATV and UTV market size in 2025, whereas military and government demand is growing at a 7.6% CAGR.
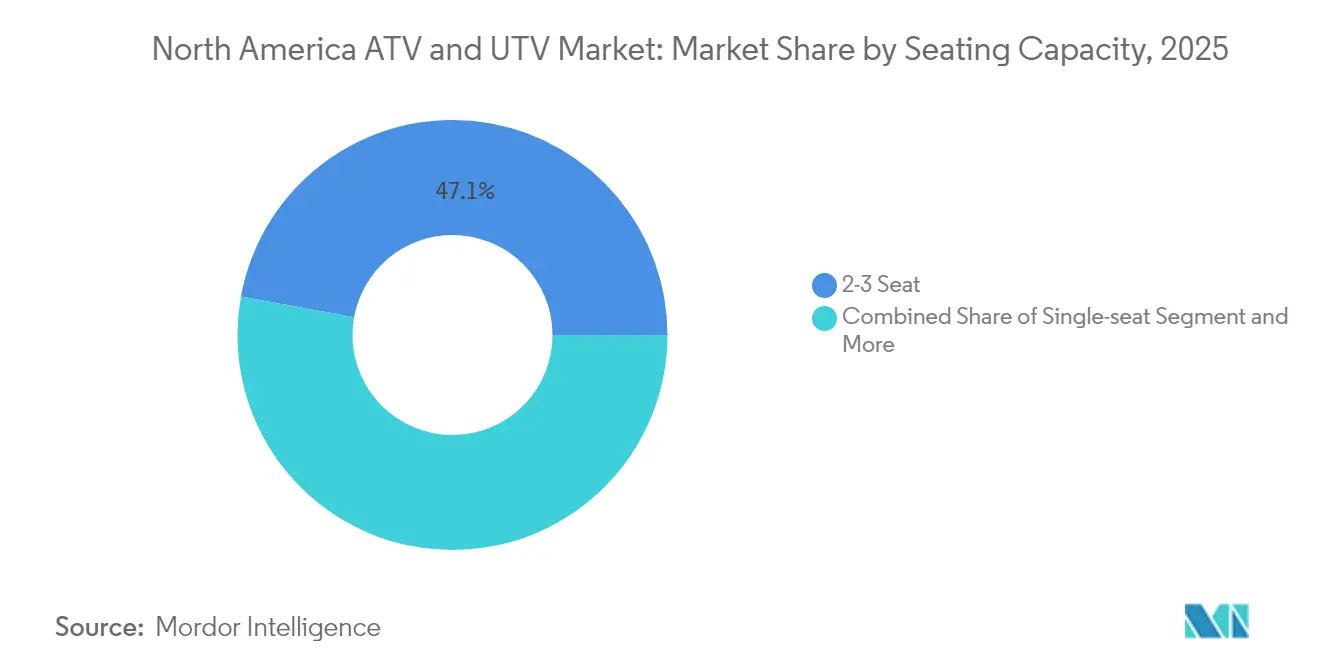
- By seating, two-to-three-seat designs held 47.14% of the North America ATV and UTV market size in 2025, yet four-to-six-seat layouts are expanding at a 7.58% CAGR.
- By drive configuration, four-wheel drive retained 60.72% of the North America ATV and UTV market size in 2025, and intelligent all-wheel drive systems are accelerating at a 7.67% CAGR.
- By country, the United States led with a 90.87% of the North America ATV and UTV market size in 2025, while Mexico is forecast to post the highest 7.74% CAGR to 2031.
Note: Market size and forecast figures in this report are generated using Mordor Intelligence’s proprietary estimation framework, updated with the latest available data and insights as of 2026.
North America ATV and UTV Market Trends and Insights
Drivers Impact Analysis*
| Driver | (~) % Impact on CAGR Forecast | Geographic Relevance | Impact Timeline |
|---|---|---|---|
| Growing Agricultural Mechanisation Needs | +1.8% | US Midwest, Canadian Prairies, Mexico agricultural regions | Long term (≥ 4 years) |
| Rising Recreational and Motorsports Activities | +1.2% | North America, with strongest gains in US and Canada | Medium term (2-4 years) |
| Silent Electric Sxs Demand | +1.1% | US conservation areas, Canadian wilderness regions | Medium term (2-4 years) |
| Technological Advances | +0.9% | Global, with early adoption in North America | Short term (≤ 2 years) |
| Trail-Tourism Incentive Programs | +0.8% | US Western states, Canadian provinces, Mexico tourism zones | Short term (≤ 2 years) |
| Rural Broadband-Enabled Fleet Connectivity | +0.7% | US rural areas, expanding to Canada and Mexico | Medium term (2-4 years) |
| Source: Mordor Intelligence | |||
Growing Agricultural Mechanization Needs
Machine-learning-based crop-scouting attachments mounted on UTVs deliver 15-20% yield gains by combining multispectral imaging and AI vision analytics that flag nutrient deficiencies in real time[1]. Farmers cite durability as their prime purchase criterion, pushing OEMs to reinforce cargo beds to withstand 450 kg hay bale loads. Precision guidance kits with sub-meter GPS accuracy now ship as dealer-installed options, automating spraying and soil sampling on irregular fields. Safety enhancements remain critical because agriculture accounts for three-fifth of work-related ATV fatalities, prompting roll-over detection systems that cut engine power within 200 ms of sensor activation. Autonomous prototypes undergoing pilot trials in Iowa operate follow-me modes behind combines, reducing hired-hand costs during peak harvest. Such innovations position UTVs as integral field assets rather than discretionary purchases, supporting long-run demand for the North America ATV and UTV market.
Rising Recreational & Motorsports Activities
ATV trail mileage funded by state tourism boards keeps expanding, exemplified by Pennsylvania’s Regional Trail Connector that now links 1,200 miles of mixed-use routes to local lodging hubs. Rental fleets report annual profits topping USD 85,000 as guided tour operators bundle equipment hire, trail permits, and safety gear in weekend packages. Wisconsin’s statutory update allowing ATVs and UTVs on designated county roads bolsters ride-in/ride-out tourism, lifting rural hospitality revenue. Equipment OEMs co-sponsor festivals such as Utah’s 2025 Paiute Trail Jamboree to showcase new models and collect real-time performance data through telematics. As a result, the North America ATV and UTV market captures significant global ATV demand, underpinning sustained aftermarket parts and apparel sales.
Silent Electric SxS Demand in Conservation & Hunting
Wildlife agencies in Michigan deploy HuntVe’s Game Changer—a 1,200 lb payload, 25-mile-range electric UTV—to access habitat restoration zones where engine noise disturbs nesting birds[2]. Conservation NGOs lease similar platforms for invasive-species removal, citing zero tailpipe emissions and minimal soil compaction as key benefits. Outfitters report higher client satisfaction on silent dawn safaris because game animals remain less skittish, increasing photographic success rates. OEMs respond with camouflage body panels, low-speed crawl modes, and 3-kW auxiliary power sockets that run spotlight arrays or research sensors without idling engines. Public-land administrators along the Colorado Plateau now stipulate decibel thresholds below 70 dBA, effectively steering procurement toward electric. This confluence of ecological regulation and user preference lifts premium-priced electric units, enlarging value pools within the North America ATV and UTV market.
Technological Advances in Suspension & Safety
Fox Live-Valve electronic dampers adapt compression within 20 ms, limiting body roll on rutted forestry roads and minimizing operator fatigue during eight-hour shifts[3]. Can-Am’s Smart-Shox package blends inertial measurement data with throttle position to maintain tire contact patch, improving braking distances on loose gravel by over one-tenth. Polaris embeds an over-the-air firmware architecture that pushes traction-control updates via 4G LTE modules, keeping vehicles compliant with evolving ANSI/SVIA 1-2023 standards. Battery-electric drivetrains such as the RANGER XP Kinetic integrate regenerative braking that delivers 140 hp peak while enabling one-pedal control for operators with limited experience. Military integrators retrofit lidar-based collision avoidance on the same platforms, illustrating civil-defense technology spillover that accelerates feature adoption cycles for the North America ATV and UTV market.
Restraints Impact Analysis*
| Restraint | (~) % Impact on CAGR Forecast | Geographic Relevance | Impact Timeline |
|---|---|---|---|
| High Purchase and Maintenance Costs | -1.5% | Global, with strongest impact in price-sensitive segments | Short term (≤ 2 years) |
| Lithium Supply-Chain Volatility | -1.2% | Global, affecting electric vehicle adoption rates | Long term (≥ 4 years) |
| Emission and Noise Regulation Tightening | -0.8% | California, northeastern US states, expanding to federal level | Medium term (2-4 years) |
| Land-Owner Liability Litigation | -0.6% | US rural areas, Canadian provinces with recreational access | Medium term (2-4 years) |
| Source: Mordor Intelligence | |||
High Purchase & Maintenance Costs
Premium UTV stickers now eclipse USD 30,000 with the 2025 Polaris RANGER XP Kinetic topping USD 37,499 in fully optioned trim. For commercial fleet owners, high insurance costs and parts inventory tie up working capital because driveline, suspension, and battery modules remain brand-specific. Electric models promise more than one-fifth lower running costs over five years, yet limited dealership service capability prolongs downtime when high-voltage components fail. Financing complexities emerge for small farms that manage seasonal cash flows; lenders often require 20% down payments and collateral beyond the vehicle. Price pressure delays replacement cycles, muting short-term unit sales despite robust long-term fundamentals for the North America ATV and UTV market.
Lithium Supply-Chain Volatility
Benchmark forecasts show lithium demand rising fivefold by 2030, but the United States currently refines less than 5% of battery-grade material. Spot prices exceeded USD 21/kg in early 2025, inflating battery pack costs by 18% and eroding OEM margins on entry-level electric ATVs. New Inflation Reduction Act content rules stipulate four-fifths of North American–sourced critical minerals by 2027, forcing manufacturers to negotiate long-term offtake deals with junior miners in Nevada and Quebec. Supply-demand gaps risk production throttling; a projected 46% deficit could constrain 50,000 planned electric vehicle units in 2027, predominantly affecting growth segments of the North America ATV and UTV market. In response, companies like BRP are funding closed-loop recycling pilots to reclaim cobalt and nickel from warranty-return battery packs, cushioning exposure to upstream volatility.
*Our forecasts treat driver/restraint impacts as directional, not additive. The impact forecasts reflect baseline growth, mix effects, and variable interactions.
Segment Analysis
By Vehicle Type: UTV Versatility Sustains Leadership
Utility terrain vehicles commanded 71.18% of the North America ATV and UTV market share in 2025 and growing at a 7.66% CAGR, underscoring their multi-purpose appeal across construction, emergency response, and back-country tourism. This dominance-reinforcing scale advantages for cargo-bed liners, cab enclosures, and hydraulic lift kits suppliers. The North America ATV and UTV market size allocated to multi-purpose UTV configurations is set to grow exponentially by 2031, supported by dealer-installed telematics that standardize fleet monitoring for municipalities. Sport-oriented UTV models such as Yamaha’s Wolverine RMAX4 1000 help manufacturers defend high-margin niches while showcasing suspension technology transferable to work-focused trims.
All-terrain vehicles maintain niche relevance where single-rider agility, lower curb weight, and narrower track widths matter, particularly on trail systems mandating sub-50-inch vehicles. OEM roadmaps reveal six new ATV variants for 2025, integrating ride-by-wire throttles, blind-spot radar, and factory-installed winches to protect share against rapidly advancing UTVs. Regulatory alignment of ATV rollover standards with UTV occupant-protection protocols could blur historic category boundaries, with future models sharing chassis components and power electronics. Consequently, platform modularity is poised to reduce development cycles, sustaining innovation cadence while tempering bill-of-materials inflation across the North America ATV and UTV market.

By Propulsion/Fuel Type: Electrification Accelerates
Gasoline engines held 62.67% of the North America ATV and UTV market share in 2025. Yet, electrified drivetrains are advancing at a 7.62% CAGR, reflecting tightening emission caps and user preference for low-noise operation. Honda’s expansion in North Carolina earmarks battery packs and final vehicle assembly capacity, signaling mainstream adoption. The North America ATV and UTV market size attributable to electric units is projected to grow drastically by 2031, assuming pack prices decline. Meanwhile, diesel remains confined to heavy-duty ranch and forestry applications where high-torque hauling supersedes energy-density constraints.
Hybrid range-extended concepts such as HuntVe’s Switchback illustrate transitional architectures: a 72-V lithium pack supplies 40 km silent range before a 708 cc gasoline engine engages. Policymakers in California already mandate stage-V-equivalent off-road emission limits, hastening fleet electrification among public agencies. Yet mass-market electric penetration awaits infrastructure build-out of 240-V Level-2 chargers across trailheads and farmsteads, a requirement now tackled by cooperative utility-dealer programs in Midwestern states. Until such grid upgrades materialize, gasoline will sustain its majority hold on unit volumes within the North America ATV and UTV market.
By End-use Industry: Defense Drives Future Growth
Recreation and sports contributed 72.85% of the North America ATV and UTV market share in 2025, reflecting consumer appetite for outdoor adventure across a network of 100,000-plus miles of permitted trails. Defense procurement budgets deliver the fastest 7.6% CAGR through 2031 as armed forces adapt commercial off-the-shelf chassis for tactical autonomous missions. Polaris Government & Defense has booked over half a billion in cumulative U.S. contracts since 2003, and the latest indefinite-delivery vehicle award covers spare parts, training, and life-cycle support.
Agriculture and forestry represent a steady adoption curve where autonomous spot-spraying modules cut herbicide spend by quarter. Growth is further enhanced by rural broadband build-outs, enabling cloud-based fleet analytics, a cornerstone of multi-farmer equipment cooperatives. Industrial and construction firms account for under 5% of present demand but deploy UTVs with dump-box conversions and fire-suppression kits on remote mining sites. Search-and-rescue agencies leverage stretcher-ready rear decks and thermal-camera masts, transforming the North America ATV and UTV market into an essential element of public-safety infrastructure.
By Seating/Capacity: Crew Transport Takes Center Stage
Two-to-three-seat machines represent 47.14% of the North America ATV and UTV market share in 2025, balancing compact dimensions with adequate crew transport for fence repair, irrigation checks, and small-group tourism. OEMs offer factory quick-detach rear seats that convert to extended flatbeds within five minutes, improving asset utilization. Single-seat platforms retain a foothold in sports racing circuits and precision orchard spraying, where narrow rows dictate sub-1.2-m widths. Safety design evolves in tandem; multi-passenger builds now feature pretensioned three-point belts and adjustable-height grab handles, elevating perceived quality while boosting average selling prices across the North America ATV and UTV market.
Four-to-six-seat formats expanded at a 7.58% CAGR in 2025-2026 as families and work crews favor shared rides over solo operation. Model launches such as Kawasaki’s 2025 RIDGE Crew XR HVAC Limited showcase 5-passenger cabins with automotive-grade climate control, 116 hp output, and 2,500 lb towing capacity, bridging lifestyle and utility expectations. For hunting outfitters, multi-row seating increases party throughput per guide, elevating revenue density per trail permit.
By Drive Type: Intelligent Drivetrains Gain Share
Four-wheel drive maintained 60.72% of the North America ATV and UTV market share in 2025, owing to proven reliability and lower cost relative to fully active systems. However, all-wheel drive (AWD) platforms integrating electronically controlled differentials are set to grow at a 7.67% CAGR, propelled by demand from novice riders who value point-and-shoot traction over manual lock engagement. Can-Am’s Smart-Lok allows automatic torque biasing based on throttle, steering angle, and gyroscopic inputs, enabling confident rock-crawling without driver intervention.
Terrain-mode selectors synchronize engine mapping, ABS, and suspension damping, lowering technical barriers for commercial operators with seasonal staff turnover. Two-wheel drive remains relevant in flat agricultural plains where purchase price outweighs terrain complexity, but its share erodes steadily. The shift to intelligent drivetrains dovetails with autonomous frameworks, as shared sensor suites facilitate lane-centering and geofencing, further embedding software value capture inside the North America ATV and UTV market.
Geography Analysis
The United States dominated 2025 revenue with a 90.87% of the North America ATV and UTV market share in 2025, bolstered by millions of acres of managed trail systems, robust military spending, and dealer networks spanning 2,300 storefronts. Yet unit volumes plateaued in 2024 when Polaris reported a retail contraction, signaling maturity in core recreation sub-segments. Federal regulators intensified oversight after a more than one-fifth rise in child fatalities. New ANSI/SVIA 1-2023 mandates, effective from January 2025, require speed-limiting youth keys, steering-column crush zones, and mandatory rollover warnings. OEMs reacted by channeling more resources into premium trims and service-based revenue, including subscription data analytics that predict maintenance events with 85% accuracy.
Canada contributes modest but steady growth, with provinces such as British Columbia and Alberta extending ATV trails by one-tenth from 2023–2025 to capitalize on adventure tourism. Prairie farms integrate UTVs into mixed-fleet telematics alongside tractors and combines, enabling cross-asset route optimization that trims diesel consumption by 7%. Harmonized safety regulations facilitate cross-border vehicle homologation, allowing U.S. dealers near the border to service Canadian owners and vice versa, improving residual values and underpinning financing rates.
Mexico is the fastest-growing geography at a 7.74% CAGR and hosts new manufacturing investments that reshape continental supply chains. Kawasaki’s Nuevo León plant targets 30,000 units annually, complemented by Can-Am’s Juarez facilities producing Rotax engines for regional assembly lines. Domestic demand climbs on rising disposable income and government subsidies promoting mechanized agriculture in Sinaloa and Jalisco. Mexico’s tourism secretariat also funds eco-park developments that rent UTVs for guided dune and jungle excursions, creating a dual domestic-export justification for OEM capacity. Cross-border logistics benefit from USMCA duty exemptions on finished vehicles meeting regional content thresholds, ensuring the North America ATV and UTV market retains production resiliency against global shipping disruptions.
Regulatory Landscape
In the United States, ATV safety access is anchored by the Consumer Product Safety Commission (CPSC) mandatory standard that ties new assembled and unassembled ATVs to ANSI/SVIA 1-2023 compliance for units manufactured on or after January 1, 2025. Manufacturers and distributors also operate under CPSC oversight via required ATV action plans, so documented safety programs and standardized warnings are a market-entry prerequisite alongside engineering changes such as youth protections and rollover-related warnings.
Emissions compliance is governed by the US Environmental Protection Agency (EPA) through 40 CFR Part 1051 for off-road recreational vehicles, covering exhaust and evaporative emissions, with Certificates of Conformity issued via EPA systems prior to sale. In Canada, Transport Canada import and classification rules and Canada Motor Vehicle Safety Standards (CMVSS) for restricted-use vehicles affect UTV eligibility, particularly for models manufactured on or after February 4, 2021, and can alter homologation effort and cross-border inventory planning when vehicles are not clearly designated for off-road-only use.
Value Chain Analysis
The value chain begins with raw materials and engineered components, including frames and suspension subassemblies, EFI systems, CVTs, driveline and AWD modules, electronic controls, and (for electrified models) battery packs and power electronics. Sourcing spans North American suppliers and global inputs, with AWD and driveline content commonly tied to established automotive-grade vendors, while lithium-ion cells and select electronics remain import-dependent. This structure creates exposure to freight variability and battery material pricing.
Manufacturing and assembly concentrate in North America to shorten lead times and improve regulatory responsiveness, supported by major OEM footprints across the Midwest and Southeast United States. Honda highlighted this localization trend through a USD 21.5 million investment announced in August 2024 to consolidate North American ATV production at Swepsonville, North Carolina, and to position the site for future electrified powersports, while its Timmonsville, South Carolina facility marked production scale with the 500,000th UTV milestone in August 2025. Downstream, distribution runs through large dealer networks and fleet channels, and growing attachment and accessory ecosystems (cabs, HVAC, telematics, work kits) increase the role of dealers and aftermarket partners in final configuration, service, and recurring revenue.
Competitive Landscape
The industry exhibits oligopolistic characteristics as Polaris, BRP (Can-Am), Honda, Yamaha, and Kawasaki collectively control most of the market share. Polaris leans on its defense backlog and the battery-electric Pro XD Kinetic to shore up margins after Q3 2024 retail decline. BRP leverages vertical integration with Rotax powertrains to maintain supply stability amid chip shortages. Honda’s North Carolina consolidation creates an exclusive North American ATV hub that lowers freight costs by 8%. Kawasaki’s forthcoming 2026 Teryx H2 introduces supercharged performance features derived from its street-motorcycle heritage, signaling continued platform borrowing across product lines.
Strategic moves in 2025 include Arctic Cat’s acquisition by an Argo-led consortium, targeting a brand revitalization focused on recreational snow-to-dirt crossover models. Kandi Technologies scales U.S. knock-down kit assembly in Texas to dodge import tariffs and carving out budget electric niches. Technology alliances proliferate: Overland AI partners with Polaris to retrofit lidar perception stacks on Sportsman chassis for autonomous route clearance missions, while Fox Factory collaborates with Yamaha to embed predictive damping algorithms harnessing cloud-logged telemetry.
Supply chain priorities center on battery cell localization, composite-panel molding, and semiconductor redundancy. OEMs hedge geopolitical risk by dual-sourcing motor controllers from U.S. and Taiwanese vendors. Dealers diversify income streams through subscription diagnostics and extended warranty bundles that capture aftermarket value as unit sales growth moderates. Collectively, these strategic vectors reinforce competitive differentiation while elevating switching costs for fleet managers participating in the North America ATV and UTV market.
North America ATV and UTV Industry Leaders
-
American Honda Motor Co. Inc.
-
Yamaha Motor Co. Ltd
-
Arctic Cat Inc.
-
Polaris Industries Inc.
-
BRP Inc.
- *Disclaimer: Major Players sorted in no particular order
Market Opportunities and Future Outlook
Electrification and low-noise operation open white-space in conservation, hunting, and public-land management, where decibel thresholds and access rules shape procurement. That dynamic supports electric side-by-sides and specialized work packages, such as auxiliary power sockets, crawl modes, and camo trims. Evidence of continued product and technology investment shows up in 2026, including CFMoto filing a US patent in June 2026 for an electric UTV concept featuring all-wheel steering and a 15.3 kWh battery, alongside ongoing OEM pushes into electric ATV branding and positioning for utility and recreation use.
Localization and configuration for all-season utility are becoming differentiators as tariff and cost structures shift, tightening the business case for North American assembly and dealer-installed utility upgrades such as enclosed cabs and HVAC. Honda commenced production of the 2026 Pioneer 1000 Deluxe in April 2026 at its South Carolina Manufacturing facility, and Polaris expanded cabbed utility offerings with dealer shipments for the 2026 RANGER 1000 CAB beginning in February 2026. At the same time, the Section 232 tariff environment and associated advocacy by bodies such as SVIA and ROHVA point to an opportunity for OEMs and suppliers to redesign sourcing, packaging, and final assembly to reduce landed-cost volatility while keeping models aligned with evolving safety and emissions requirements.
Recent Industry Developments
- April 2026: Honda announced its 2027 FourTrax multipurpose ATV lineup, continuing production at its Swepsonville, North Carolina plant. Keeping key ATV lines anchored in North American manufacturing supports supply continuity and faster incorporation of updated safety requirements tied to ANSI/SVIA 1-2023 compliance.
- October 2025: Polaris rolled out a second wave of 2026 off-road updates, including enhancements for the RZR XP S and RZR Pro R platforms and select limited-edition variants. The refresh underscores accelerating feature cycles in performance side-by-sides, with cockpit electronics and premium trims used to defend margin and showroom traffic.
- July 2024: Honda completed a USD 21.5 million investment plan for its Swepsonville, North Carolina facility to consolidate all North American ATV production there and earmark the site for future electrified powersports products. The move shortens regional supply chains and strengthens domestic assembly as a lever to manage component logistics and cost swings for next-generation propulsion.
Research Methodology Framework and Report Scope
Market Definition and Coverage
This market is sized as the revenue generated from selling all-terrain vehicles (ATVs) and utility terrain vehicles (UTVs) across North America, counted at the point of vehicle sale and tracked in current US dollars.
Scope exclusions: Excludes motorcycles, snowmobiles, golf carts, and full-size off-road trucks even if they are used for similar recreation or work needs.
Segmentation Overview
- By Vehicle Type
- All-Terrain Vehicles (ATVs)
- Sport ATVs
- Utility/Work ATVs
- Utility Terrain Vehicles (UTVs/Side-by-Sides)
- Sport UTVs
- Multi-purpose UTVs
- All-Terrain Vehicles (ATVs)
- By Propulsion/Fuel Type
- Gasoline
- Diesel
- Electric
- By End-use Industry
- Hybrid
- Recreation & Sports
- Agriculture & Forestry
- Industrial & Construction
- Military & Government
- Search, Rescue & Emergency Services
- By Seating/Capacity
- Single-seat
- 2 – 3 seat
- 4 – 6 seat
- By Drive Type
- 2-Wheel Drive
- 4-Wheel Drive
- All-Wheel Drive
- By Country
- United States
- Canada
- Rest of North America
Data Sources, Market Sizing, and Validation
Desk Research
Desk work starts by building the demand context for off-road vehicles in the US, Canada, and the rest of North America, before the market math is finalized. We rely on public and official sources such as US and Canadian vehicle safety and recall databases, US land management agencies for trail access and permits, national statistics agencies for consumer spending and rural employment, and customs trade data for vehicle and parts flows. We also use patent databases to see which features are actively being developed (for example, battery systems and safety aids), which helps explain pricing and adoption timing.
To convert this context into sizing inputs, we review company filings, investor materials, and industry association websites for shipment commentary, capacity notes, and model refresh plans. Select paid database subscriptions are used only where they add structure, such as for company financials and for shipment-level import and export checks. This list is not exhaustive, and many other public sources were also consulted for data collection, cross-checks, and clarification.
Primary Interviews and Surveys
Primary work is used to confirm what is being counted as an ATV or UTV sale and to pressure-test the key assumptions that sit behind volumes and pricing. We speak with a mix of manufacturers, distributors, dealers, fleet buyers, and service networks across the US and Canada, and then we re-check inputs like model mix shifts, discounting, and seasonality with independent experts so the final numbers stay realistic.
Distribution of primary research fieldwork respondents
| Company type | Respondent position |
|---|---|
| Top tier: 27% | CXOs: 22% |
| Mid tier: 51% | Functional/Unit leaders: 32% |
| Smaller Players: 22% | Managers: 46% |
Market-Sizing & Forecasting
Sizing is built using a top-down demand pool reconstruction, where off-road recreation participation, agricultural and ranch activity levels, and dealership throughput signals are translated into expected unit demand and then multiplied by observed average selling prices. Those price inputs are adjusted using practical checks like inflation trends, financing affordability, and the pace of model launches, because these vehicles are often bought when promotions, riding season, and inventory availability line up.
After the main build, we corroborate totals with selective bottom-up approximations using supplier and dealer conversations, sampled unit ranges by country, and rough ASP-by-type rollups so the output stays anchored to what the channel can actually move. Variables used in the model include ATV versus UTV mix, fuel-type split (gasoline versus electric), share of utility use versus sport use, replacement cycle timing in rural areas, and trail access growth, which can lift unit demand even when broader consumer spending is soft. For forecasting, scenario analysis is applied to reflect different paths for discretionary spending, interest rates, and electrification uptake, and then the scenario weights are aligned with what primary respondents see as the most likely outlook. Where bottom-up signals are incomplete, gaps are handled by using conservative ranges and then re-testing the total against independent demand indicators before finalizing.
Data Validation & Update Cycle
Validation is done in steps so errors are caught early and assumptions stay consistent across countries and vehicle types. We compare outputs against independent signals such as import trends, dealer inventory commentary, and announced product cycles, and then we investigate any sharp jumps that do not match those signals.
Before sign-off, the model and written logic are reviewed by another analyst, and follow-up calls are triggered when a key input moves outside the expected range. Reports are refreshed annually, and interim updates are made when material events occur, such as major pricing changes, regulatory moves affecting trail use, or sudden supply disruptions. Right before delivery, a final pass is completed so clients receive the latest updated view based on the most recent information available.
Mordor Intelligence's North America Atv and Utv Market Estimate Compared With Other Published Estimates
Published market values for ATVs and UTVs can look far apart because the included vehicle set, the year used as the base, and the way prices are treated are not the same from one publisher to another. Differences also come from whether Mexico is included in North America, how electric units are counted, and if forecasts are built from demand indicators or from broad growth targets.
Aftermarket parts, accessories, and service labor sit outside Mordor Intelligence's scope, which can pull some external totals upward when they bundle vehicle sales together with ongoing ownership spend. Gaps also show up when an estimate assumes faster ASP growth without checking dealer discounting and financing conditions, or when the refresh cadence is slower and it misses newer model price points that reset the average.
Benchmark comparison
| Source | Market Size | Gaps in Research Methodology |
|---|---|---|
| Mordor Intelligence | USD 10.96 B (2025) | |
| Industry Publisher A | USD 9.97 B (2025) | Uses a narrower revenue lens tied to selected vehicle classes and tends to apply a smoother growth curve, which can understate near-term pricing and mix shifts between ATV and UTV models. |
| Regional Publisher B | USD 10.90 B (2025) | Often keeps country coverage and price updates less explicit, and the forecast path leans more on stated CAGR progression than on demand checks like recreation participation and dealer throughput. |
The table shows that most of the spread is explained by what gets counted beyond new vehicle sales and how frequently price and mix assumptions are refreshed. By keeping the steps tied to visible demand drivers and by re-checking key inputs with channel feedback, the resulting market value stays traceable and repeatable.
Key Questions Answered in the Report
What is the current value of the North America ATV UTV market and its projected CAGR to 2031?
The segment is valued at USD 11.79 billion in 2026 and is forecast to expand to USD 16.95 billion by 2031 on a 7.55% CAGR trajectory.
Which vehicle type holds the largest share in North America ATV UTV sales for 2025?
Utility terrain vehicles led with 71.18% of 2025 revenue, reflecting their versatility across recreational, agricultural, and public-sector applications.
How fast are electric ATV and UTV volumes expected to grow in North America?
Electrified units represent the fastest propulsion category, advancing at a 7.62% CAGR through 2031 as adoption widens in noise-sensitive and fleet segments.
Which end-use segment shows the highest growth momentum in this space?
Military and government procurement is rising at a 7.6% CAGR, driven by autonomous mobility initiatives and stealth requirements.
Why is Mexico viewed as the regional growth engine for these vehicles?
New OEM plants and expanding domestic demand support a growth at 7.74% CAGR, the highest among North American countries, while leveraging USMCA trade advantages.
Who are the leading manufacturers dominating North America ATV UTV shipments?
Polaris, BRP (Can-Am), Honda, Yamaha, and Kawasaki collectively account for significant regional revenue, underscoring an oligopolistic landscape.