
Market Overview
| Study Period | 2019 - 2031 |
|---|---|
| Forecast Data Period | 2026 - 2031 |
| Base Year Market Size (2025) | USD 6.99 Billion |
| Market Size (2026) | USD 7.29 Billion |
| Market Size (2031) | USD 9.57 Billion |
| Growth Rate (2026 - 2031) | 5.59 % |
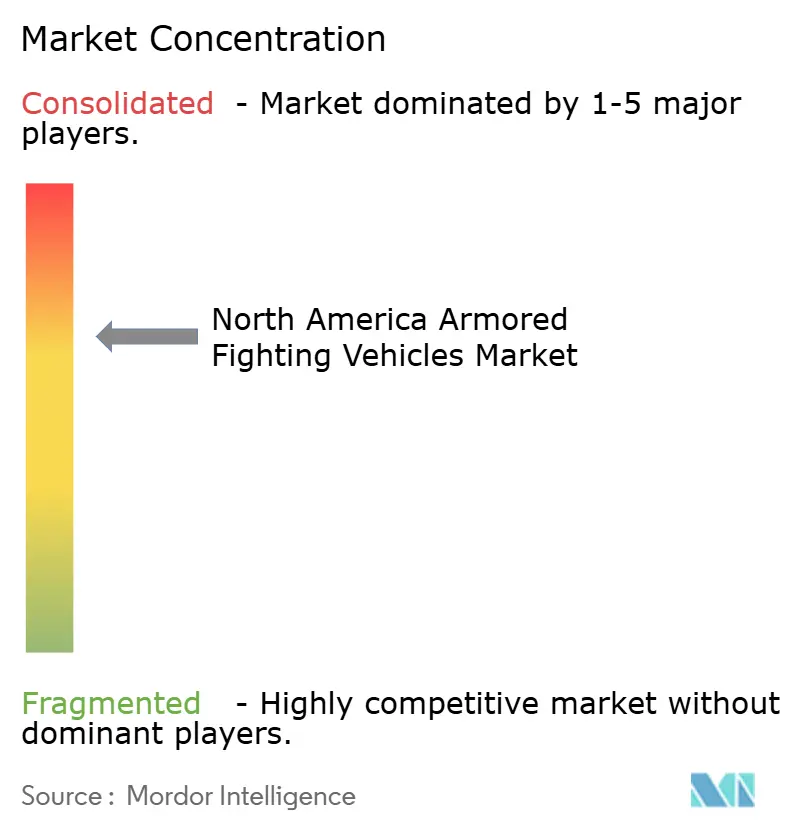
| Market Concentration | Medium |
Major Players *Disclaimer: Major Players sorted in no particular order Image © Mordor Intelligence. Reuse requires attribution under CC BY 4.0. | |
North America Armored Fighting Vehicles Market Analysis by Mordor Intelligence
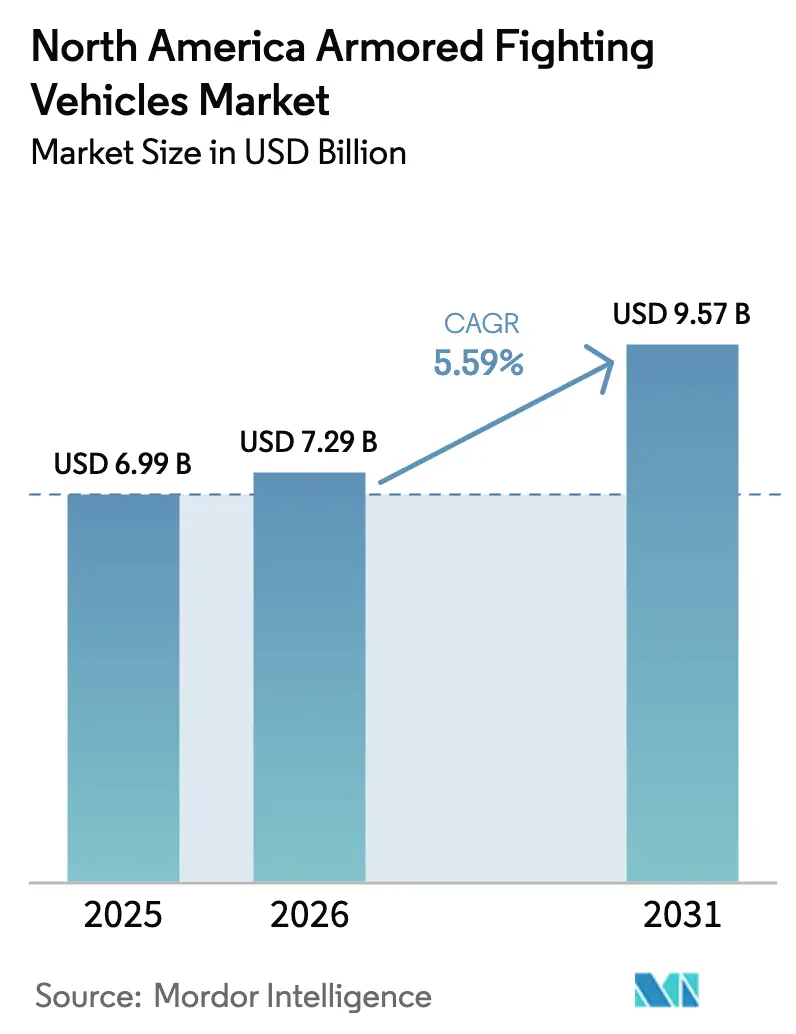
The North America armored fighting vehicles market size is expected to grow from USD 6.99 billion in 2025 to USD 7.29 billion in 2026 and is forecasted to reach USD 9.57 billion by 2031 at a 5.59% CAGR over 2026-2031. This growth is driven by the US Department of Defense's (DoD's) focus on great-power competition, the US Army's Next-Generation Combat Vehicle (NGCV) program, and Canada's Light Vehicle Modernization initiative. Key trends include ongoing electrification trials, the integration of active protection systems (APS) across heavy fleets, and the development of vehicles suited for Arctic mobility. These trends are creating opportunities for propulsion system developers, armor-grade steel manufacturers, and providers of retrofit solutions.
However, supply chain challenges, particularly in semiconductors and armor plate materials, are extending lead times. To address these issues, manufacturers are pursuing dual sourcing and localizing production of critical materials. The competitive landscape is evolving as modular, software-defined architectures attract new entrants capable of integrating autonomy, AI-enabled threat detection, and open systems, all while maintaining cost efficiency.
Despite these challenges, the market benefits from near-term demand visibility through funded upgrade programs. Companies that can deliver solutions addressing cold-weather operations, hybrid-electric propulsion, and unmanned turret systems without increasing life-cycle costs are well-positioned to capitalize on emerging opportunities.
Key Report Takeaways
- By platform type, armored personnel carriers (APCs) led with 31.34% revenue share in 2025; light protected/recon vehicles are forecasted to expand at a 6.98% CAGR through 2031.
- By mobility, wheeled configurations accounted for 65.43% of the North American armored fighting vehicles market in 2025, while tracked vehicles are expected to grow at a 5.89% CAGR through 2031.
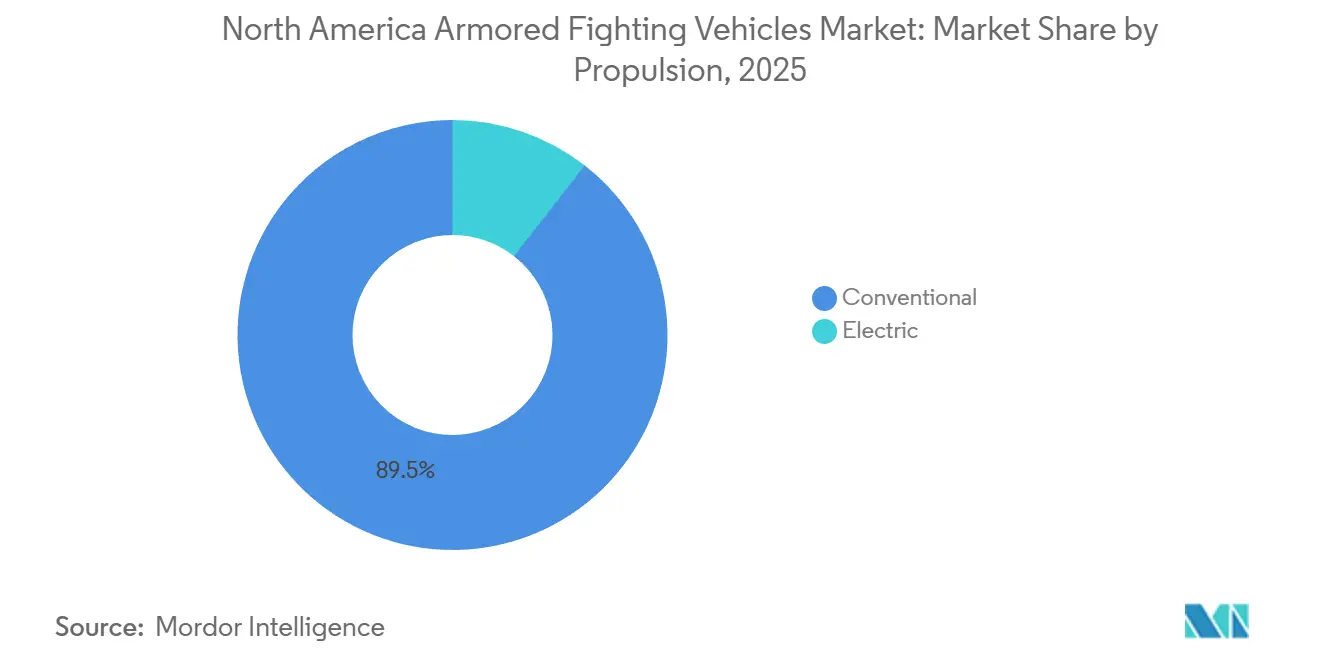
- By propulsion, conventional systems are expected to maintain 89.46% of demand in 2025; electric and hybrid platforms are projected to grow at a 12.43% CAGR through 2031.
- By end-user, the Army segment held 64.67% of the North American armored fighting vehicles market share in 2025, whereas the Special Forces recorded the highest projected CAGR at 6.57% through 2031.
- By geography, the United States led with an 82.12% revenue share in 2025, and Canada is projected to grow at a 6.01% CAGR during the forecast period.
Note: Market size and forecast figures in this report are generated using Mordor Intelligence’s proprietary estimation framework, updated with the latest available data and insights as of January 2026.
North America Armored Fighting Vehicles Market Trends and Insights
Drivers Impact Analysis*
| Driver | (%) Impact on CAGR Forecast | Geographic Relevance | Impact Timeline |
|---|---|---|---|
| Surging US Next-Gen Combat Vehicle (NGCV) procurement pipeline | +1.20% | United States, spillover to Canada | Medium term (2-4 years) |
| Elevated US and Canadian defense budgets post-2025 | +0.90% | United States, Canada | Short term (≤ 2 years) |
| Intensifying great-power competition in the Arctic region | +0.70% | Alaska, Northern Canada | Long term (≥ 4 years) |
| Rapid adoption of active protection systems (APS) | +0.80% | United States, early Canadian trials | Medium term (2-4 years) |
| DoD electrification roadmap for tactical fleets | +1.10% | United States, technology transfer to Canada | Long term (≥ 4 years) |
| Demand for modular unmanned turrets and retrofit kits | +0.60% | United States, Canada | Medium term (2-4 years) |
| Source: Mordor Intelligence | |||
Surging US Next-Gen Combat Vehicle Procurement Pipeline
The XM30 Optionally Manned Fighting Vehicle is progressing toward a Milestone B decision in 2025, with low-rate initial production expected by early 2028. This program aims to replace approximately 2,000 Bradley vehicles, with a ceiling unit cost of USD 8 million.[1] Dual-track development contracts awarded to General Dynamics and Rheinmetall Anduril are driving changes in supply chains, as bidders localize armor fabrication and implement open-systems architectures to enable autonomous operation, edge computing, and standardized datalinks. Localization efforts, such as Rheinmetall’s acquisition of a Michigan plant, are also mitigating risks associated with tariffs and Buy America Act requirements, ensuring smoother program execution.
Elevated US and Canadian Defense Budgets Post-2025
Ground-systems appropriations reached USD 13 billion in the US for FY 2025 and CAD 2.58 billion (USD 1.86 billion) in Canada, primarily for light-vehicle modernization. While the US is reallocating some funds to long-range fires and cyber capabilities, budget lines for tracked IFV upgrades and APS retrofits remain intact. This ensures continued demand for hull fabrication, suspension kits, and sensor packages. In Canada, a maintenance backlog resulting in only 52% serviceability for LAV 6.0 vehicles provides additional revenue opportunities for sustainment and retrofit suppliers, further strengthening the market outlook.
Intensifying Great-Power Competition in the Arctic Region
Exercises such as Arctic Edge and the US Army’s ATP 3-90.96 doctrine highlight the necessity for vehicles capable of operating in temperatures below -40 °C. As a result, tracked chassis, insulated fuel lines, and winterization kits have become mandatory in new procurement solicitations. The Army is conducting cold-weather testing at Alaska’s Cold Regions Test Center, which extends program schedules by 8-12 months but creates a niche market for thermal-management solutions.[2] These requirements underscore the growing importance of specialized capabilities in extreme environments.
Rapid Adoption of Active Protection Systems
The integration of Iron Fist on Bradley vehicles and Trophy systems on Abrams tanks achieved intercept rates exceeding 90% during 2024 live-fire trials. The mandate for fleet-wide APS implementation by 2028 is driving demand for radars, power-management upgrades, and software enhancements. However, challenges such as weight penalties and coverage arc limitations are driving the development of lighter, modular soft-kill alternatives. This shift is enabling new competitors to challenge established players, such as Rafael, Elbit, and Rheinmetall, thereby increasing competition in the APS market.
Restraints Impact Analysis*
| Restraint | (%) Impact on CAGR Forecast | Geographic Relevance | Impact Timeline |
|---|---|---|---|
| Budget reallocations toward cyber/space domains | -0.80% | United States, indirect impact on Canada | Short term (≤ 2 years) |
| High acquisition and life-cycle costs of heavy platforms | -0.60% | United States, Canada | Medium term (2-4 years) |
| Supply-chain fragility in armor-grade alloys and semiconductors | -0.90% | North America with global dependencies | Medium term (2-4 years) |
| Stricter EPA noise and emissions rules on proving grounds | -0.30% | United States | Long term (≥ 4 years) |
| Source: Mordor Intelligence | |||
Budget Reallocations Toward Cyber/Space Domains
In FY 2026, the Space Force and cyber budgets increased by 15%, resulting in a USD 1.4 billion reduction in Army modernization funding. This led to the cancellation of the M10 Booker program and delays in Joint Light Tactical Vehicle (JLTV) acquisitions. Light and medium vehicle programs are the most affected, while funding for tracked IFVs and APS upgrades remains prioritized to address peer armor threats. These reallocations reflect the shifting focus of defense priorities toward emerging domains.
High Acquisition and Life-Cycle Costs of Heavy Platforms
The M1A2 SEPv3 tank costs approximately USD 9.5 million to procure and USD 30 million over its 40-year lifecycle. Similarly, each Leopard 2A6M in Canada incurs an annual sustainment cost of CAD 1.2 million (USD 0.86 million).[3] These high costs are prompting a shift in investment toward modular upgrades, armored recovery vehicles, and life-extension packages, rather than new MBT acquisitions. This trend underscores the increasing emphasis on cost efficiency and sustainability in defense procurement strategies.
*Our forecasts treat driver/restraint impacts as directional, not additive. The impact forecasts reflect baseline growth, mix effects, and variable interactions.
Segment Analysis
By Platform Type: Versatile APCs Hold the Lead, Light Recon Gains Speed
APCs accounted for 31.34% of the North America armored fighting vehicles market share in 2025, supported by 4,900 Strykers in US inventories and 550 Canadian LAV 6.0 units. The modular hull design of the Stryker supports infantry, MEDEVAC, and command variants, ensuring a steady revenue stream for armor kits, drivetrain overhauls, and digital backbone upgrades.
Light protected/reconnaissance vehicles are projected to grow at the fastest rate, with a 6.98% CAGR, as Special Forces increasingly favor air-droppable GM Defense ISVs and Polaris MRZR vehicles for border security and Arctic patrols. Their 5,000-pound curb weight enables CH-47 sling loads and high-speed off-road mobility over tundra, highlighting how niche performance improvements drive growth in the North American armored fighting vehicles market.
IFVs are expected to grow at a 5.8% CAGR, driven by USD 1.6 billion in OMFV funding and USD 656 million in Bradley upgrades. These programs incorporate APS and 600-horsepower engines. The market share allocated to IFV programs is anticipated to increase steadily as peer-conflict scenarios demand enhanced firepower and networked sensors.
MRAP fleets are downsizing, while MBTs remain stable, relying on sustainment contracts rather than new production. However, hybrid-electric demonstrators and unmanned turrets could stimulate demand if they reduce operating costs and enhance crew survivability.


By Mobility: Wheeled Dominance, Tracked Revival
Wheeled chassis accounted for 65.43% of the market value in 2025, favored for their 60 mph road speeds and lower fuel consumption. Oshkosh FHTV V upgrades and Canada’s light-truck modernization programs sustain demand for 4x4, 6x6, and 8x8 logistics vehicles. Features such as rubber-insert run-flat tires, anti-lock braking systems, and digital dash retrofits further expand aftermarket opportunities.
Tracked vehicles are experiencing a resurgence, with a 5.89% CAGR, as Arctic operations require snow-capable hulls. The XM30 is designed to clear 6-foot obstacles at 40 mph cross-country, while Bradley E1 retrofits enhance torsion bars and idler wheels to accommodate the added weight of the Iron Fist system. Innovations such as rubber band tracks and in-arm suspension systems reduce vibration, narrowing the maintenance gap between tracked and wheeled systems.
Hybrid-electric prototypes are blurring the traditional boundaries of mobility categories. A battery-equipped Stryker prototype demonstrated 25% additional off-road torque and a 40% reduction in thermal signature, challenging the advantages of tracked vehicles. The Army’s 2026 mobility study anticipates mixed fleets, with wheeled vehicles prioritized for rapid deployment and tracked assets for assault operations, ensuring both segments remain integral to the North American armored fighting vehicles market.
By Propulsion: Diesel Still Dominant, Hybrids Accelerate
Conventional propulsion systems, including diesel and turbine engines, retained an 89.46% market share due to their compatibility with JP-8 supply chains. However, high acoustic and infrared signatures reduce survivability, and emissions regulations increase operational costs. Efficiency improvements, such as common-rail injection, synthetic fuels, and idle-stop systems, provide only partial mitigation of these challenges.
Electric and hybrid platforms are growing at a 12.43% CAGR, led by innovations like the Extended Range Hybrid Electric Tank and Oshkosh eLTV. A hybrid Abrams tank, equipped with a 1,000 kW battery, reduces idle fuel consumption by 20% and extends silent-watch capabilities by 30%. The market for battery packs, 800 V inverters, and high-voltage harnesses is expected to expand rapidly as charging infrastructure develops at forward operating bases.
Light vehicles are trending toward full electrification, while heavier platforms are adopting diesel-electric hybrids until battery energy density surpasses 500 Wh/kg. Standardizing battery interfaces under NATO Generic Vehicle Architecture is becoming a key procurement requirement, giving interoperable suppliers a competitive advantage in upcoming contracts.
By End-User: Army Remains Anchor, Special Forces Propel Innovation
The Army operated over 30,000 armored vehicles in 2025, supported by USD 11.60 billion in FY 2026 funding for ground systems. Modernization programs for OMFV, Bradley, and Stryker vehicles ensure consistent demand for these vehicles. However, brigade combat teams are shrinking as the Multi-Domain Task Force reallocates personnel to cyber and long-range fires capabilities.
Special Forces represent the fastest-growing segment, with a 6.57% CAGR. SOCOM’s ISV deliveries, expanded MRZR production, and a USD 400 million GMV sustainment contract support lighter, air-droppable fleets. Their preference for low-signature, autonomous scouting platforms is influencing broader design trends across the North American armored fighting vehicles market.
The demand for Marine/Naval Infantry is declining as the Marine Corps shifts its focus from tanks to littoral mission sets. Homeland Security applications remain niche, with private-sector integrators targeting smaller batch orders for border patrol vehicles. These orders face fewer certification hurdles, offering opportunities for specialized suppliers.
Geography Analysis
The United States accounted for 82.12% of 2025 spending, supported by USD 13 billion in FY 2025 ground-systems appropriations and USD 11.60 billion in FY 2026. Contracts for XM30, Bradley E1, and Stryker systems contribute to significant backlogs. Additionally, Arctic-focused winterization kits and track conversions are allocated USD 180 million in FY 2026, linking mobility upgrades to strategic objectives in the high north.
Canada, with a 6.01% CAGR, is investing CAD 2.58 billion (USD 1.86 billion) in light-truck modernization while addressing a 52% readiness rate for LAV 6.0 vehicles. Sustainment budgets allocate CAD 1.2 million (USD 0.86 million) annually per Leopard 2 tank. Interoperability requirements with US forces drive the adoption of APS, NGVA-compliant electronics, and cold-weather packages, ensuring the North American armored fighting vehicles market maintains allied compatibility.
Mexico plays a minor role, focusing on internal security rather than expanding its conventional fleet. It consists of approximately 200 armored vehicles, primarily comprising DN-XI Caballo APCs and surplus Humvees. Budgetary constraints and import challenges limit short-term procurement; however, ongoing cartel violence sustains demand for MRAP-derived patrol vehicles and armored SUVs.
Regulatory Landscape
Armored fighting vehicle programs in North America operate under defense procurement and security frameworks that shape what can be designed, produced, and transferred, including export-control and handling requirements tied to US Government foreign policy objectives for tactical vehicle families such as the JLTV. These rules effectively force OEMs and subsystem suppliers to embed compliance into vehicle configuration control, documentation, and cybersecurity across electronics and mission systems. Survivability requirements also drive qualification testing and production acceptance, including 360-degree protection targets achieved through integrated armor kits.
Environmental and test-range constraints affect program execution as well. The market context includes stricter EPA noise and emissions rules on US proving grounds, which reinforces propulsion-efficiency upgrades, idle-reduction features, and electrification roadmaps in tactical and armored fleets. At the same time, US DoD and Canadian procurement emphasis on winterization and Arctic-operability requirements adds cold-weather qualification gates to solicitations and trials.
Value Chain Analysis
The value chain runs from ballistic materials and specialty components through vehicle integration, test and certification, and long-term sustainment. Upstream constraints center on armor-grade alloys and plate as well as semiconductor availability for modern vetronics. Downstream demand is anchored by funded modernization and retrofit pipelines, which pull through sensors, power-management hardware, and software updates in addition to hull and drivetrain work, including APS integration, digital backbones, and survivability upgrades.
North American industrial participation remains visible in program awards and schedule risk. BAE Systems multi-site manufacturing for tracked platforms, including M109A7 production operations in York, Pennsylvania, Elgin, Oklahoma, and Anniston, Alabama, shows how primes distribute fabrication, assembly, and recapitalization across a domestic network to support throughput and sustainment. In Canada, domestic material sourcing has gained prominence, with Algoma Steel (Sault Ste. Marie, Ontario) positioned as a supplier of ballistic-grade steel. The July 2026 Canada-GDLS-Canada strategic partnership under the Canadian Defense Industrial Strategy Strategic Partnership Framework also reinforces a structured pathway for local build and supplier development across armored vehicle programs.
Competitive Landscape
General Dynamics Land Systems, BAE Systems, and Oshkosh Defense collectively account for approximately 60% of the market share, resulting in a moderately concentrated market. However, Rheinmetall's 2025 XM30 award in collaboration with Anduril, along with its 2024 acquisition of Loc Performance, highlights how partnerships between foreign primes and autonomy specialists can challenge established players. The adoption of open architecture mandates and software-defined subsystems has reduced entry barriers, enabling technology firms such as Anduril, Kongsberg, and Leonardo DRS to compete based on mission-system capabilities rather than existing hull inventories.
Significant opportunities exist in hybrid-electric propulsion, where no defense-scale battery supplier has yet emerged; unmanned turret retrofits, where multi-vendor strategies mitigate single-source dependency; and Arctic-qualified kits, where specialized providers can focus on extreme-cold sealing, insulation, and battery thermal regulation. However, challenges such as bottlenecks in armor-plate and semiconductor supply chains are prompting OEMs to pursue vertical integration or secure long-term offtake agreements. While these strategies may reduce margins, they help ensure adherence to production schedules and timelines, ultimately supporting the overall efficiency of the process.
The February 2025 XM30 Phase 3/4 contract, the November 2024 acquisition of Loc Performance, and the August 2024 FHTV V award underscore the importance of localization, dual sourcing, and modularity. As procurement cycles extend due to budgetary constraints, aftermarket upgrades, sensor resets, and life-extension packages are expected to dominate revenue streams. Companies that excel in rapid retrofit installations and cyber-resilient software updates will be well-positioned to capitalize on these trends.
North America Armored Fighting Vehicles Industry Leaders
-
Textron Systems Corporation (Textron Inc.)
-
General Dynamics Corporation
-
BAE Systems plc
-
Rheinmetall AG
-
Oshkosh Corporation
- *Disclaimer: Major Players sorted in no particular order
Market Opportunities and Future Outlook
Near-term whitespace is clearest in Canadian local-build content and supplier localization tied to major armored vehicle investments and industrial frameworks. In July 2026, Canada announced a USD 1.4 billion investment with General Dynamics Land Systems-Canada to build 190 Armoured Combat Support Vehicles (ACSVs) domestically. This creates openings for Canadian tier suppliers in armored structures, harnessing, power distribution, and sustainment tooling aligned with interoperability requirements. Related industrial moves, such as Hanwha signing an April 2026 MOU with the Automotive Parts Manufacturing Association (APMA) and referencing Algoma Steel ballistic-grade material, point to an active push to broaden domestic sourcing options for armored vehicle content.
In the United States, program activity continues to support opportunities in prototype-to-production transition, digital survivability, and fleet recapitalization. Textron Systems' April 2026 US Marine Corps Advanced Reconnaissance Vehicle (ARV) pre-production development work, including delivery of Cottonmouth vehicles, supports demand for reconnaissance platforms and the associated mission-system integration stack. US Army platform funding for upgrades, including Bradley modernization and APS retrofits referenced in the market context, sustains demand for retrofit kits, power-management upgrades, and software-defined or open-architecture integration services. Supply-chain friction in semiconductors and armor materials keeps lead-time reduction, dual sourcing, and localized fabrication as practical differentiators for primes and subsystem providers competing for delivery schedules and sustainment follow-on work.
Recent Industry Developments
- July 2026: General Dynamics Land Systems Canada entered a strategic partnership with the Government of Canada, securing a C$2 billion plus award for 190 Armoured Combat Support Vehicles and 35 vehicles for Ukraine. The deal reinforces Canada's defense-industrial strategy and accelerates armoured combat vehicle modernization. It strengthens domestic production capacity and establishes a long-term NGCV/ACSV procurement framework in North America.
- June 2026: Textron Systems commenced production of Mobile Strike Force Vehicle MSFV for Ukraine at Slidell, Louisiana facility. The scale-up of MSFV for allied support expands near-term export defense production. The move demonstrates rapid manufacturing ramp for international demand, influencing market capacity and supplier competition.
- January 2026: Textron Systems was awarded US Army USAI contract for 65 COMMANDO Select MSFV US Army/Ukraine-related procurement. The award increases MSFV deployment and program funding visibility. It signals sustained demand for MSFV platform and expands Textron’s committed production workload.
Research Methodology Framework and Report Scope
Market Definition and Coverage
This market covers the value of armored fighting vehicles procured and upgraded across North America, including new builds, modernization packages, and selected life-cycle support tied directly to platforms used by defense and security users.
Scope exclusions: We exclude small arms, standalone soldier gear, and unarmored tactical vehicles that do not meet armored fighting vehicle definitions.
Segmentation Overview
- By Platform Type
- Armored Personnel Carriers (APCs)
- Infantry Fighting Vehicles (IFVs)
- Mine-Resistant Ambush-Protected (MRAP)
- Main Battle Tanks (MBTs)
- Light Protected/Recon Vehicles
- Others
- By Mobility
- Wheeled (4x4, 6x6, 8x8)
- Tracked
- By Propulsion
- Conventional
- Electric
- By End-User
- Army
- Marine/Naval Infantry
- Special Forces
- Homeland Security
- By Geography
- United States
- Canada
- Mexico
Data Sources, Market Sizing, and Validation
Desk Research
Desk research starts by setting the demand backdrop through government budget documents and program updates, which help us understand what is being funded and when it is likely to be executed. We also use publicly available defense procurement notices and contract award summaries to cross-check timing, contract size, and whether awards relate to new vehicles, retrofits, or sustainment.
To keep assumptions grounded, we reference official sources such as US Department of Defense budget justification books, congressional budget publications, national statistics agencies for inflation and currency context, and trade and customs datasets for cross-border shipments of relevant vehicle categories, along with defense and land systems association publications. Company annual reports, investor presentations, and reputable press releases are used to confirm production plans, backlog direction, and major delivery milestones, and then they are filtered through paid subscriptions for company financials and patent databases when public disclosures are thin. The sources listed here are illustrative only, and we checked additional public documents for data collection, validation, and research clarifications.
Primary Interviews and Surveys
Primary work is used to sanity-check what desk sources cannot fully explain, especially delivery phasing, upgrade content, and typical price ranges by vehicle class. We speak with stakeholders across OEM and subsystem teams, program consultants, and defense buyers to confirm how procurement, modernization, and sustainment spend is being counted by country and by platform type across the region.
Distribution of primary research fieldwork respondents
| Company type | Respondent position |
|---|---|
| Top tier: 35% | CXOs: 12% |
| Mid tier: 49% | Functional/Unit leaders: 43% |
| Smaller Players: 16% | Managers: 45% |
Market-Sizing & Forecasting
Market sizing is built using a combined top-down and bottom-up approach, where defense budget lines and procurement plans are reconstructed into a regional spend pool and then allocated to armored fighting vehicles based on program mix and delivery schedules. To reduce drift, we corroborate the model using selective bottom-up checks, such as sampled contract values, observed production and delivery cadence, and typical unit price bands by vehicle family, and then adjust for double counting between new procurement and upgrades.
Key inputs used in the model include announced procurement quantities, upgrade program scope (for example, protection systems and turret or electronics refresh), delivery timelines by fiscal year, inflation assumptions for defense procurement, and the split between tracked and wheeled platforms where it impacts typical pricing. Forecasts are developed using scenario analysis, where optimistic and conservative award and delivery cases are discussed with interviewees, and the central case is kept consistent with budget visibility and program maturity. Where bottom-up evidence is missing for smaller programs, gaps are handled by using proxy pricing from comparable vehicles and applying country-specific execution rates so the estimate stays realistic.
Data Validation & Update Cycle
Outputs are checked against independent signals, such as total land systems procurement direction, large award announcements, and visible delivery milestones, and variances are investigated before sign-off. If an assumption drives an unusual jump, we re-check it against multiple documents and, when needed, consult expert sources to confirm whether the change is real or timing related.
Each report is refreshed annually, and interim updates are made when material events occur, such as a major program award, cancellation, or large schedule slip. Before delivery, a final analyst review pass is completed so clients receive the latest updated view aligned to current public disclosures and confirmed field feedback.
Mordor Intelligence's North America Armored Fighting Vehicles Market Size Compared With Other Published Estimates
Published market values for armored fighting vehicles can differ even for the same region because the included spend lines are not always the same, and the base year used for pricing and deliveries can shift the total. We also see differences when some estimates lean more on stated budgets, while others focus on awarded contracts that are closer to executed spend.
Standalone weapons and ammunition are treated as outside Mordor Intelligence's scope, which keeps the value anchored to vehicle procurement and upgrade programs rather than broader land combat spending.
Benchmark comparison
| Source | Market Size | Gaps in Research Methodology |
|---|---|---|
| Mordor Intelligence | USD 6.99 B (2025) | |
| Industry Publisher A | USD 6.50 B (2024) | Uses an earlier base year and appears to smooth procurement timing, which can understate years with clustered deliveries or large modernization starts. |
| Trade Source B | USD 9.80 B (2023) | Likely folds in adjacent land defense spending beyond vehicles (for example, wider combat systems), and may convert using a different currency timing, which lifts the total. |
The spread across the three numbers mainly comes from what is counted as vehicle-only spend versus broader land combat budgets, and from how delivery timing is recognized year to year. Our process keeps the total traceable to procurement and upgrade drivers, so clients can map the number back to clear programs and repeat the steps when assumptions change.
Key Questions Answered in the Report
What is the forecast value of the North America armored fighting vehicles market by 2031?
The North America armored fighting vehicles market is expected to reach USD 9.57 billion by 2031, expanding at a 5.59% CAGR.
Which platform type currently commands the largest share?
Armored Personnel Carriers (APCs) lead with 31.34% share, supported by extensive Stryker and LAV 6.0 fleets.
Why are hybrid-electric drivetrains gaining traction in armored fleets?
Hybrid systems cut idle fuel consumption by up to 20% and reduce thermal signatures, aligning with the Army’s net-zero goals and EPA emission rules.
How is the Arctic environment shaping vehicle requirements?
Below-40 °C conditions necessitate tracked mobility, winterization kits, and cold-rated batteries, influencing new-build specifications and retrofit packages.
Which end-user segment shows the fastest growth?
Special Forces requirements for lightweight, air-droppable vehicles are fueling a 6.57% CAGR, ahead of other segments.
What is driving demand for active protection systems?
Live-fire trials demonstrating intercept rates exceeding 90% and a 2028 Army mandate are accelerating APS adoption across heavy platforms.