Market Overview
| Study Period | 2017 - 2030 |
|---|---|
| Base Year For Estimation | 2024 |
| Forecast Data Period | 2025 - 2030 |
| Market Size (2025) | USD 2.63 Billion |
| Market Size (2030) | USD 3.36 Billion |
| Growth Rate (2025 - 2030) | 5.03% CAGR |
| Market Concentration | Low |
Major Players*Disclaimer: Major Players sorted in no particular order Image © Mordor Intelligence. Reuse requires attribution under CC BY 4.0. | |

North America Animal Protein Market Analysis by Mordor Intelligence
The North America Animal Protein Market size is estimated at 2.63 billion USD in 2025, and is expected to reach 3.36 billion USD by 2030, growing at a CAGR of 5.03% during the forecast period (2025-2030).
The North American animal protein industry is experiencing significant transformation driven by evolving consumer preferences and nutritional awareness. Recent surveys indicate that 80% of U.S. adult consumers in 2022 preferred traditional protein sources like pork, beef, poultry, and fish as their main protein sources, highlighting the continued dominance of animal-based proteins. The industry is witnessing increased demand for premium and value-added protein products, particularly in functional foods and beverages. Manufacturers are responding by developing innovative protein formulations that offer enhanced functionality while maintaining clean label status.
Product innovation and clean-label trends are reshaping the industry landscape, with manufacturers focusing on natural and minimally processed animal protein ingredients. This shift is particularly evident in the retail sector, where approximately 96% of U.S. consumers purchased at least one box of protein-enriched cereals per shopping trip in 2022. Companies are increasingly investing in research and development to create novel protein applications, especially in ready-to-eat and functional food categories. The industry is seeing a surge in protein-fortified products across various categories, from beverages to snacks, meeting the growing consumer demand for convenient protein-rich options.
The personal care and cosmetics sector has emerged as a significant growth avenue for animal protein applications, particularly in Mexico, where over 60% of women invested in personal care products with an average monthly spend of USD 276 in 2021. Proteins like collagen and gelatin are gaining traction in beauty and skincare formulations, driven by increasing consumer awareness of their functional benefits. Manufacturers are developing innovative protein-based formulations for various applications, from supplements to topical products, capitalizing on the growing demand for natural and effective beauty solutions.
Sustainability initiatives and technological advancements are revolutionizing protein production methods across North America. The industry is witnessing increased adoption of advanced processing technologies that enhance protein functionality while maintaining natural properties. Companies are investing in sustainable production practices and exploring alternative protein sources, including insect proteins for animal feed applications. This focus on sustainability extends to packaging and waste reduction initiatives, with many manufacturers adopting eco-friendly practices throughout their supply chains. The industry is also seeing growing collaboration between ingredient suppliers and end-product manufacturers to develop innovative protein applications that meet both functional requirements and sustainability goals.
North America Animal Protein Market Trends and Insights
The consumption growth of animal protein is fueling opportunities for key players in the ingredients segment
- Despite the rising vegan population, the demand for animal protein has been steady in the United States. The majority of protein in the American diet comes from beef and poultry, followed by dairy. In 2022, 80% of US adult consumers preferred pork, beef, poultry, and fish as their main protein sources. Due to its water-binding properties, the market is majorly driven by the growing usage of gelatin in the functional food industry.
- Consumers continue to demand traditional protein options, but they are signaling an expectation of the animal protein industry to do more to address environmental concerns. With a wide range of applications and consumer preferences toward a healthy lifestyle, many US ingredient manufacturers are trying to enter the collagen market, which is the major reason for the increase in per capita consumption patterns. From 2019 to 2021, the unadjusted prevalence of doctor-diagnosed arthritis in the United States was 24.2% among women and 17.9% among men. Owing to the prevalence of arthritis in the region, there is an increasing demand for collagen-based supplements for bone and joint health.
- Value-added dairy products drive the per capita consumption of milk protein in Canada. Fluid milk, cheese, cream, and yogurt are the dairy products mainly consumed in the country. In 2022, domestic cow milk consumption amounted to 10,243 thousand MT. The marketing year 2022-2023 sales data indicated that Canadians spent more on whole milk (3.25 % butterfat), less skim milk (0% butterfat), and reduced-fat milk. Canadians eat a moderate amount of red meat. Per capita consumption of beef and poultry is high in Canada compared to pig meat and sheep meat.

Understand The Key Trends Shaping This Market
Download PDF
Meat and milk production contribute majorly as raw materials for animal protein ingredients
- The graph given depicts the production data for raw materials such as meat of cattle, pigs, and chicken (with bone, fresh or chilled), raw milk from cattle and goats, skim milk from cows, and dry whey powder. In 2023, 2,408,7 pounds of milk was produced per cow, an increase of 1.30% from 23,777 pounds in 2020. As of 2022, the average number of milk cows in the United States was 9,402. Milk is usually separated through various processes into components and processed into fluid beverage milk or the manufacture of other dairy products.
- The United States is the world's largest producer of chicken meat and accounted for a 20% share of global chicken meat production in 2023. Cattle meat is one of the most common sources of collagen, providing a significant amount of this unique protein. With the largest fed-cattle industry in the world, the United States is also the world's largest producer of cattle meat, primarily high-quality, grain-fed cattle meat for domestic and export use.
- Nearly 70% of Canada’s milk production is concentrated in Quebec and Ontario. Milk produced in Canada supplies two markets: the fluid milk market, which includes fluid milk for direct consumption, creams, and flavored milk, and the industrial milk market. FAS/Canada forecasts total milk production to reach 10.310 million metric tons (MMT) in 2024, a modest increase from the 2023 estimate of 10.265 MMT. Canada’s meat processing companies manufacture a wide variety of meat products, ranging from fresh and frozen meat to processed, smoked, canned, and cooked meats. About 70% of processed meats in Canada, such as sausages or cold cuts, are made with pork.

Understand The Key Trends Shaping This Market
Download PDF
OTHER KEY INDUSTRY TRENDS COVERED IN THE REPORT
- Organic baby food is expected to drive the market in the future
- Fortified beverages are expected to witness a rise in sales during the forecast period
- An increase in the demand for single-serve packets may augment production
- Dairy alternatives are expected to witness a significant growth rate
- Great opportunities for meat alternative products
- Key players are focusing more on healthy ingredients post the COVID-19 pandemic
- Steady demand from the United States to support market growth
- Large commercial players lead the growth of the bakery industry
- Consumer shift toward low-carb diets poses a threat to market growth
- Key players are expected to focus on fortification and nutritional enrichment
- The emphasis on awareness and innovation is one of the major growth drivers of the elderly nutrition market
- E-commerce is expected to emerge as one of the most preferred channels
- Sport/performance nutrition to witness significant growth during the forecast period
- The cosmetic industry to be driven by synergy of innovation and social media influence
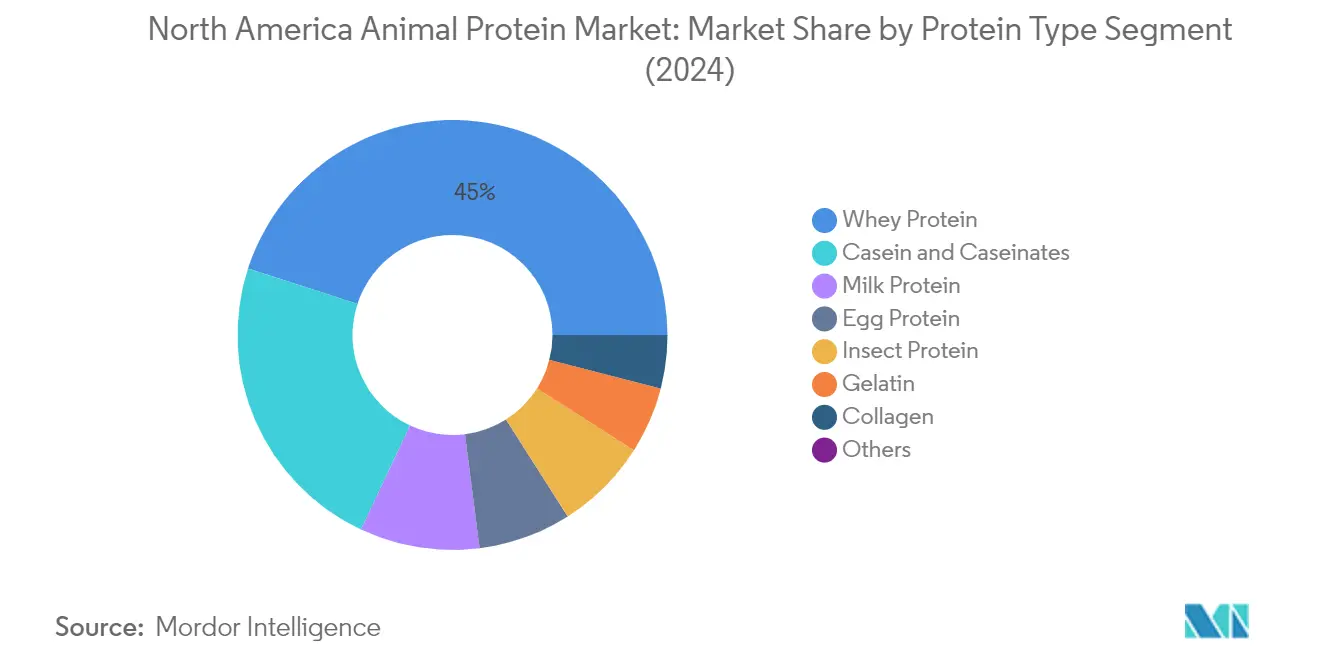
Segment Analysis: Protein Type
Whey Protein Segment in North America Animal Protein Market
Whey protein dominates the North American animal protein market, commanding approximately 45% market share in 2024. This significant market position is primarily attributed to its widespread application in the supplements segment, particularly in sports nutrition products. The segment's dominance is further strengthened by whey protein's superior nutritional profile, containing high levels of essential amino acids and branched-chain amino acids (BCAAs), making it particularly valuable for muscle development and recovery. Increasing consumer awareness about the benefits of whey protein, coupled with its versatility in various applications including beverages, snacks, and dietary supplements, continues to drive its market leadership. Additionally, technological advancements in processing methods have enabled manufacturers to produce different forms of whey protein, including concentrates, isolates, and hydrolysates, catering to diverse consumer needs and applications.
Collagen Segment in North America Animal Protein Market
The collagen segment is emerging as the fastest-growing segment in the North American animal protein market, projected to grow at approximately 6% during 2024-2029. This remarkable growth is primarily driven by increasing applications in the food and beverage sector, particularly in beverages and snacks. The surge in demand is largely attributed to collagen's perceived benefits for skin health, joint function, and overall wellness, making it increasingly popular among health-conscious consumers. The segment's growth is further accelerated by innovations in the F&B sector, particularly in functional foods and beverages. The rising acceptance of bovine collagen, especially suitable for complete body health and recovery, coupled with its cost-effectiveness compared to marine-sourced alternatives, is driving market expansion. Additionally, the personal care and cosmetics industry's growing incorporation of collagen in various products is contributing to this segment's rapid growth.
Remaining Segments in Protein Type
The other segments in the North American animal protein market, including milk protein, casein and caseinates, egg protein, gelatin, and insect protein, each play distinct roles in various applications. Milk protein and casein products are particularly significant in dairy applications and sports nutrition, while egg protein dominates in condiments and sauces due to its excellent emulsifying properties. Gelatin maintains a strong presence in confectionery and pharmaceutical applications, while insect protein is gaining traction in the animal feed sector due to its sustainability credentials. These segments collectively contribute to the market's diversity, offering manufacturers a wide range of options for different applications and helping meet varying consumer preferences and requirements across different industries.
Segment Analysis: End User
Food and Beverages Segment in North America Animal Protein Market
The Food and Beverages segment dominates the North American animal protein market, commanding approximately 47% market share in 2024. This significant market position is primarily driven by the growing consumer shift from carbonated beverages toward healthier protein-enriched drinks and protein-based snacks. The segment's dominance is further strengthened by the rising demand for whey proteins in various food applications, as manufacturers increasingly incorporate these proteins to replace high-fat and costly ingredients like milk, butter, and cream cheese while maintaining similar flavor profiles and textures. The breakfast cereals sub-segment within F&B has emerged as a particularly strong growth driver, fueled by increasing consumer awareness about obesity and type-2 diabetes, leading to higher acceptance of protein-fortified breakfast options.
Personal Care and Cosmetics Segment in North America Animal Protein Market
The Personal Care and Cosmetics segment is emerging as the fastest-growing sector in the North American animal protein market, projected to expand at approximately 7% CAGR from 2024 to 2029. This remarkable growth is primarily attributed to the increasing incorporation of collagen in beauty and skincare products, driven by its proven benefits in developing skin elasticity, maintaining hydration, and providing a youthful appearance. The segment's growth is further catalyzed by the fact that nearly 64% of US beauty customers prioritize maintaining a youthful appearance, while 54% incorporate beauty regimens into their daily routines. Companies are continuously innovating their product offerings in response to rising consumer demand, particularly focusing on natural and clean-label ingredients in personal care formulations.
Remaining Segments in End User Segmentation
The Animal Feed and Supplements segments constitute significant portions of the North American animal protein market, each serving distinct market needs. The Animal Feed segment maintains a strong presence due to the growing demand for animal feed protein-enriched animal nutrition, particularly in poultry and livestock industries. The segment's growth is supported by the increasing adoption of insect proteins as a sustainable and cost-effective protein source in animal feed formulations. Meanwhile, the Supplements segment continues to evolve, driven by the sports nutrition sub-segment and increasing consumer awareness about health and wellness. This segment particularly benefits from the rising popularity of animal protein powder supplements among fitness enthusiasts and health-conscious consumers seeking convenient nutrition solutions.
North America Animal Protein Market Geography Segment Analysis
North America Animal Protein Market in United States
The United States dominates the North American animal protein market, commanding approximately 82% market share in 2024. The country's market leadership is driven by its robust food and beverage sector, particularly the animal protein supplements segment, which has surpassed traditional sectors in recent years. The market has witnessed significant transformation with increasing consumer preference for protein-enriched products, especially in sports nutrition and functional foods. The country's advanced manufacturing capabilities and strong distribution networks have enabled efficient production and delivery of various animal protein products. Innovation in protein formulations, particularly in the whey and collagen segments, continues to drive market growth. The presence of major market players and their continuous investment in research and development has further strengthened the United States' position. Additionally, the growing trend toward clean-label products and natural ingredients has prompted manufacturers to develop premium protein offerings, catering to evolving consumer preferences.
North America Animal Protein Market in Mexico
Mexico represents one of the most dynamic markets in the North American region, projected to grow at approximately 6% CAGR during 2024-2029. The country's animal protein market is experiencing rapid transformation driven by increasing urbanization and growing awareness of protein-rich diets. The food and beverage segment, particularly the bakery and beverage sub-segments, has emerged as a significant growth driver, together accounting for over 25% of animal protein consumption. The market has witnessed substantial development in protein processing capabilities, with several international players establishing manufacturing facilities in the country. Rising disposable incomes and changing consumer preferences toward healthier food options have created new opportunities for protein-enriched products. The personal care segment has shown remarkable potential, especially in collagen-based products, supported by increasing beauty and wellness consciousness among consumers. Mexico's strategic location and trade agreements have also facilitated easier access to both North and South American markets, enhancing its position as a key player in the regional protein industry.
North America Animal Protein Market in Canada
Canada has established itself as a significant player in the North American animal protein market, with its strength particularly evident in the dairy protein segment. The country's market is characterized by high-quality standards and sustainable production practices, with a notable focus on grass-fed dairy protein. Canadian manufacturers have been at the forefront of innovation, particularly in developing specialized protein ingredients for various applications. The animal protein supplements segment, especially sports nutrition, has emerged as a key growth driver, reflecting the country's increasing health consciousness and active lifestyle trends. The nation's robust regulatory framework and commitment to food safety have enhanced its reputation as a reliable source of premium protein ingredients. Canadian producers have also demonstrated leadership in sustainable practices, responding to growing consumer demand for environmentally responsible protein production. The country's strong agricultural base and advanced processing capabilities continue to support market expansion, while its focus on research and development ensures continuous innovation in protein applications.
North America Animal Protein Market in Other Countries
The remaining North American countries, including Jamaica, Cuba, Panama, Costa Rica, and Guatemala, collectively represent an emerging market segment with unique characteristics and opportunities. These markets are primarily driven by the food and beverage sector, with particular strength in the snacks and beverages segments. The region demonstrates increasing adoption of processed animal protein products, reflecting growing health consciousness among consumers. These countries have shown particular interest in developing their protein processing capabilities, often through partnerships with established international players. The markets are characterized by growing urbanization and increasing disposable incomes, which have led to changing dietary preferences and increased protein consumption. The supplement segment shows promising growth potential, particularly in sports nutrition and functional foods. These countries also benefit from their strategic location, serving as important links in the regional protein supply chain, while their diverse agricultural base provides opportunities for local protein sourcing and processing.
Get Analysis on Important Geographic Markets
Download PDF
Competitive Landscape
Top Companies in North America Animal Protein Market
The North American animal protein market is characterized by continuous product innovation and strategic expansion initiatives by leading players. Companies are heavily investing in research and development to create novel animal protein formulations, particularly focusing on clean-label and functional ingredients that cater to evolving consumer preferences. Operational agility has become paramount, with manufacturers upgrading their production facilities to incorporate advanced technologies and improve efficiency. Strategic moves predominantly revolve around joint ventures and partnerships to strengthen distribution networks and enhance market presence. Geographic expansion remains a key focus, with companies establishing new production facilities and innovation centers across the region to better serve local markets and reduce supply chain complexities. The emphasis on sustainability and traceability has also driven investments in vertically integrated operations and sustainable sourcing practices.
Fragmented Market with Strong Regional Players
The North American animal protein market exhibits a fragmented structure with a mix of global conglomerates and specialized regional players. Global companies leverage their extensive research capabilities and diverse product portfolios to maintain market positions, while regional specialists thrive by offering customized solutions and maintaining strong relationships with local customers. The market is characterized by the presence of both dairy cooperatives and private companies, creating a diverse competitive landscape with varying business models and operational approaches. The industry has witnessed significant consolidation through strategic acquisitions, particularly in specialized segments like sports nutrition and infant formula.
Market dynamics are shaped by the strong presence of dairy cooperatives that maintain significant control over raw material supplies and processing capabilities. These organizations often collaborate with global players through joint ventures to enhance their market reach and technological capabilities. The competitive landscape is further influenced by the increasing presence of ingredient specialists who focus on specific protein types or applications, creating niche market segments. Companies with integrated operations, from raw material sourcing to final product manufacturing, tend to have stronger market positions due to better cost control and supply chain management.
Innovation and Sustainability Drive Future Success
Success in the North American animal protein market increasingly depends on companies' ability to innovate while maintaining sustainable operations. Market leaders are focusing on developing proprietary processing technologies and unique processed animal protein formulations to differentiate their offerings and command premium pricing. The ability to secure stable raw material supplies through strategic partnerships with farmers and cooperatives has become crucial for maintaining competitive advantages. Companies are also investing in digital capabilities to improve operational efficiency and enhance customer service, while building strong research and development capabilities to address evolving consumer preferences and application requirements.
Future market success will require companies to balance scale advantages with operational flexibility. Smaller players can gain ground by focusing on specialized market segments and developing innovative solutions for specific applications or customer groups. Regulatory compliance, particularly regarding food safety and labeling requirements, will continue to influence market dynamics and competitive strategies. Companies must also address the growing threat of plant-based protein substitutes by highlighting the unique nutritional and functional benefits of animal protein nutrition. Building strong relationships with end-users through technical support and customization capabilities will become increasingly important for maintaining market position and driving growth.
North America Animal Protein Industry Leaders
Ajinomoto Co. Inc.
Arla Foods amba
Darling Ingredients Inc.
Glanbia PLC
Kerry Group PLC
- *Disclaimer: Major Players sorted in no particular order

Need More Details on Market Players and Competitors?
Download PDF
Recent Industry Developments
- August 2022: Optimum Nutrition announced the launch of its new Gold Standard Protein Shake. The RTD is available in chocolate and vanilla flavors and is formulated with 24 grams of protein per serving.
- August 2021: Darling Ingredients expanded its existing manufacturing facility, which includes Nebraska's first operation dedicated solely to poultry conversion. This expanded manufacturing unit will also facilitate protein conversion.
- August 2021: Arla Foods amba launched MicelPure, a micellar casein isolate, into the market. The new micellar casein isolate contains a minimum of 87% native protein and is low in lactose and fat, heat-stable, and taste-neutral. It is majorly used in RTD, high-protein beverages, and powder shakes applications.
North America Animal Protein Market Report Scope
Casein and Caseinates, Collagen, Egg Protein, Gelatin, Insect Protein, Milk Protein, Whey Protein are covered as segments by Protein Type. Animal Feed, Food and Beverages, Personal Care and Cosmetics, Supplements are covered as segments by End User. Canada, Mexico, United States are covered as segments by Country.Protein Type
| Casein and Caseinates |
| Collagen |
| Egg Protein |
| Gelatin |
| Insect Protein |
| Milk Protein |
| Whey Protein |
| Other Animal Protein |
End User
| Animal Feed | ||
| Food and Beverages | By Sub End User | Bakery |
| Beverages | ||
| Breakfast Cereals | ||
| Condiments/Sauces | ||
| Confectionery | ||
| Dairy and Dairy Alternative Products | ||
| RTE/RTC Food Products | ||
| Snacks | ||
| Personal Care and Cosmetics | ||
| Supplements | By Sub End User | Baby Food and Infant Formula |
| Elderly Nutrition and Medical Nutrition | ||
| Sport/Performance Nutrition | ||
Country
| Canada |
| Mexico |
| United States |
| Rest of North America |
| Protein Type | Casein and Caseinates | ||
| Collagen | |||
| Egg Protein | |||
| Gelatin | |||
| Insect Protein | |||
| Milk Protein | |||
| Whey Protein | |||
| Other Animal Protein | |||
| End User | Animal Feed | ||
| Food and Beverages | By Sub End User | Bakery | |
| Beverages | |||
| Breakfast Cereals | |||
| Condiments/Sauces | |||
| Confectionery | |||
| Dairy and Dairy Alternative Products | |||
| RTE/RTC Food Products | |||
| Snacks | |||
| Personal Care and Cosmetics | |||
| Supplements | By Sub End User | Baby Food and Infant Formula | |
| Elderly Nutrition and Medical Nutrition | |||
| Sport/Performance Nutrition | |||
| Country | Canada | ||
| Mexico | |||
| United States | |||
| Rest of North America | |||
Need A Different Region or Segment?
Customize Now
Market Definition
- End User - The Protein Ingredients Market operates on a B2B basis. Food, Beverages, Supplements, Animal Feed, and Personal Care & Cosmetic manufacturers are considered to be end-consumers in the market studied. The scope excludes manufacturers buying liquid/dry whey to be used for application as a binding agent or thickener or other non-protein applications.
- Penetration Rate - Penetration Rate is defined as the percentage of Protein-Fortified End User Market Volume in the Overall End User Market Volume.
- Average Protein Content - Average protein content is the average protein content present per 100 g of product manufactured by all end-user companies considered under the scope of this report.
- End User Market Volume - End-user market volume is the consolidated volume of all types and forms of end-user products in the country or region.
| Keyword | Definition |
|---|---|
| Alpha-lactalbumin (α-Lactalbumin) | It is a protein that regulates the production of lactose in the milk of almost all mammalian species. |
| Amino acid | It is an organic compound that contains both amino and carboxylic acid functional groups, which are required for the synthesis of body protein and other important nitrogen-containing compounds, such as creatine, peptide hormones, and some neurotransmitters. |
| Blanching | It is the process of briefly heating vegetables with steam or boiling water. |
| BRC | British Retail Consortium |
| Bread improver | It is a flour-based blend of several components with specific functional properties designed to modify dough characteristics and give quality attributes to bread. |
| BSF | Black Soldier Fly |
| Caseinate | It is a substance produced by adding an alkali to acid casein, a derivative of casein. |
| Celiac disease | Celiac disease is an immune reaction to eating gluten, a protein found in wheat, barley, and rye. |
| Colostrum | It is a milky fluid that’s released by mammals that have recently given birth before breast milk production begins. |
| Concentrate | It is the least processed form of protein and has a protein content ranging from 40-90% by weight. |
| Dry protein basis | It refers to the percentage of "pure protein" present in a supplement after the water in it is completely removed through heat. |
| Dry whey | It is the product resulting from drying fresh whey which has been pasteurized and to which nothing has been added as a preservative. |
| Egg protein | It is a mixture of individual proteins, including ovalbumin, ovomucoid, ovoglobulin, conalbumin, vitellin, and vitellenin. |
| Emulsifier | It is a food additive that facilitates the blending of foods that are immiscible with one another, such as oil and water. |
| Enrichment | It is the process of addition of micronutrients that are lost during the processing of the product. |
| ERS | Economic Research Service of the USDA |
| Extrusion | It is the process of forcing soft mixed ingredients through an opening in a perforated plate or die designed to produce the required shape. The extruded food is then cut to a specific size by blades. |
| Fava | Also known as Faba, it is another word for yellow split beans. |
| FDA | Food and Drug Administration |
| Flaking | It is a process in which typically a cereal grain (like corn, wheat, or rice) is broken down into grits, cooked with flavors and syrups, and then pressed into flakes between cooled rollers. |
| Foaming agent | It is a food ingredient that makes it possible to form or maintain a uniform dispersion of a gaseous phase in a liquid or solid food. |
| Foodservice | It refers to the part of the food industry which includes businesses, institutions, and companies which prepare meals outside the home. It includes restaurants, school and hospital cafeterias, catering operations, and many other formats. |
| Fortification | It is the deliberate addition of micronutrients that are not found in them naturally or which are lost during processing, to improve a food product's nutritional value. |
| FSANZ | Food Standards Australia New Zealand |
| FSIS | Food Safety and Inspection Service |
| FSSAI | Food Safety and Standards Authority of India |
| Gelling agent | It is an ingredient that functions as a stabilizer and thickener to provide thickening without stiffness through the formation of gel. |
| GHG | Greenhouse Gas |
| Gluten | It is a family of proteins found in grains, including wheat, rye, spelt, and barley. |
| Hemp | It is a botanical class of Cannabis sativa cultivars grown specifically for industrial or medicinal use. |
| Hydrolysate | It is a form of protein manufactured by exposing the protein to enzymes that can partially break the bonds between the protein's amino acids and break down large, complicated proteins into smaller pieces. Its processing makes it easier and quicker to digest. |
| Hypoallergenic | It refers to a substance that causes fewer allergic reactions. |
| Isolate | It is the purest and most processed form of protein which has undergone separation to obtain a pure protein fraction. It typically contains ≥ 90% of protein by weight. |
| Keratin | It is a protein that helps form hair, nails, and the outer layer of skin. |
| Lactalbumin | It is the albumin contained in milk and obtained from whey. |
| Lactoferrin | It is an iron‑binding glycoprotein that is present in the milk of most mammals. |
| Lupin | It is the yellow legume seeds of the genus Lupinus. |
| Millenial | Also known as Generation Y or Gen Y, it refers to the people born from 1981 to 1996. |
| Monogastric | It refers to an animal with a single-compartmented stomach. Examples of monogastric include humans, poultry, pigs, horses, rabbits, dogs, and cats. Most monogastric are generally unable to digest much cellulose food materials such as grasses. |
| MPC | Milk protein concentrate |
| MPI | Milk protein isolate |
| MSPI | Methylated soy protein isolate |
| Mycoprotein | Mycoprotein is a form of single-cell protein, also known as fungal protein, derived from fungi for human consumption. |
| Nutricosmetics | It is a category of products and ingredients that act as nutritional supplements to care for skin, nails, and hair natural beauty. |
| Osteoporosis | It is a medical condition in which the bones become brittle and fragile from loss of tissue, typically as a result of hormonal changes, or deficiency of calcium or vitamin D. |
| PDCAAS | Protein digestibility-corrected amino acid score (PDCAAS) is a method of evaluating the quality of a protein based on both the amino acid requirements of humans and their ability to digest it. |
| Per-capita consumption of animal protein | It is the average amount of animal protein (such as milk, whey, gelatin, collagen, and egg proteins) that is readily available for consumption by each person in an actual population. |
| Per-capita consumption of plant protein | It is the average amount of plant protein (such as soy, wheat, pea, oat, and hemp proteins) that is readily available for consumption by each person in an actual population. |
| Quorn | It is a microbial protein manufactured using mycoprotein as an ingredient, in which the fungus culture is dried and mixed with egg albumen or potato protein, which acts as a binder, and then is adjusted in texture and pressed into various forms. |
| Ready-to-Cook (RTC) | It refers to food products that include all of the ingredients, where some preparation or cooking is required through a process that is given on the package. |
| Ready-to-Eat (RTE) | It refers to a food product prepared or cooked in advance, with no further cooking or preparation required before being eaten. |
| RTD | Ready-to-Drink |
| RTS | Ready-to-Serve |
| Saturated fat | It is a type of fat in which the fatty acid chains have all single bonds. It is generally considered unhealthy. |
| Sausage | It is a meat product made of finely chopped and seasoned meat, which may be fresh, smoked, or pickled and which is then usually stuffed into a casing. |
| Seitan | It is a plant-based meat substitute made out of wheat gluten. |
| Softgel | It is a gelatin-based capsule with a liquid fill. |
| SPC | Soy protein concentrate |
| SPI | Soy protein isolate |
| Spirulina | It is a biomass of cyanobacteria that can be consumed by humans and animals. |
| Stabilizer | It is an ingredient added to food products to help maintain or enhance their original texture, and physical and chemical characteristics. |
| Supplementation | It is the consumption or provision of concentrated sources of nutrients or other substances that are intended to supplement nutrients in the diet and is intended to correct nutritional deficiencies. |
| Texturant | It is a specific type of food ingredient that is used to control and alter the mouthfeel and texture of food and beverage products. |
| Thickener | It is an ingredient that is used to increase the viscosity of a liquid or dough and make it thicker, without substantially changing its other properties. |
| Trans fat | Also called trans-unsaturated fatty acids or trans fatty acids, it is a type of unsaturated fat that naturally occurs in small amounts in meat. |
| TSP | Textured soy protein |
| TVP | Textured vegetable protein |
| WPC | Whey protein concentrate |
| WPI | Whey protein isolate |
Need More Details on Market Definition?
Ask a Question
Research Methodology
Mordor Intelligence follows a four-step methodology in all our reports.
- Step-1: Identify Key Variables: The quantifiable key variables (industry and extraneous) pertaining to the specific product segment and country are selected from a group of relevant variables & factors based on desk research & literature review; along with primary expert inputs. These variables are further confirmed through regression modeling (wherever required).
- Step-2: Build a Market Model: In order to build a robust forecasting methodology, the variables and factors identified in Step-1 are tested against available historical market numbers. Through an iterative process, the variables required for market forecast are set and the model is built on the basis of these variables.
- Step-3: Validate and Finalize: In this important step, all market numbers, variables and analyst calls are validated through an extensive network of primary research experts from the market studied. The respondents are selected across levels and functions to generate a holistic picture of the market studied.
- Step-4: Research Outputs: Syndicated Reports, Custom Consulting Assignments, Databases & Subscription Platforms

Get More Details On Research Methodology
Download PDF


