
Market Overview
| Study Period | 2021 - 2031 |
|---|---|
| Forecast Data Period | 2026 - 2031 |
| Base Year Market Size (2025) | USD 40.0 Billion |
| Market Size (2026) | USD 41.63 Billion |
| Market Size (2031) | USD 50.85 Billion |
| Growth Rate (2026 - 2031) | 4.08 % |
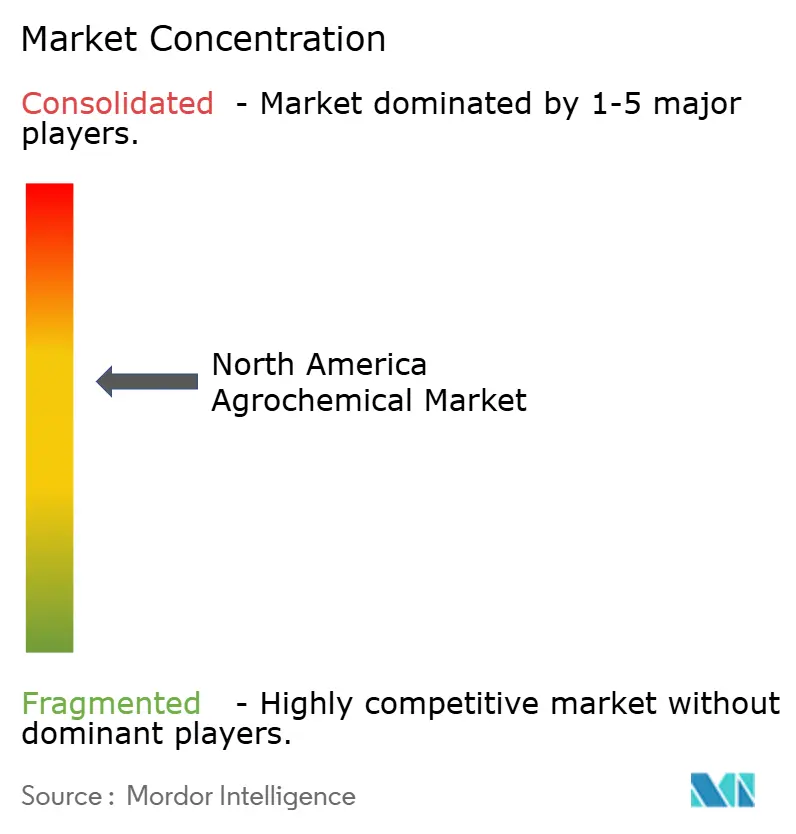
| Market Concentration | Medium |
Major Players *Disclaimer: Major Players sorted in no particular order Image © Mordor Intelligence. Reuse requires attribution under CC BY 4.0. | |
North America Agrochemical Market Analysis by Mordor Intelligence
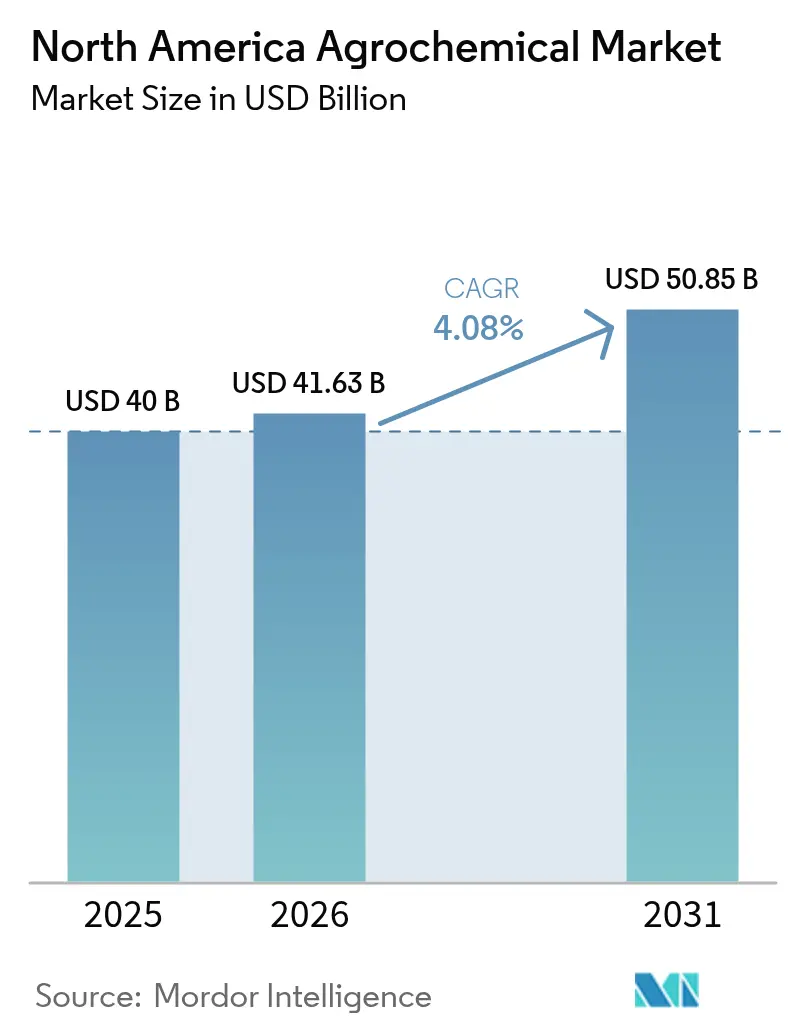
The North America agrochemical market size is expected to grow from USD 40.0 billion in 2025 to USD 41.63 billion in 2026 and is forecast to reach USD 50.85 billion by 2031 at 4.08% CAGR over 2026-2031. The market exhibits stability while transforming through precision-application technologies, regulatory changes, and increased focus on input efficiency. Fertilizers represent the largest product segment, with precision spraying tools and digital agronomy platforms optimizing chemical application methods and timing, resulting in reduced volumes despite higher per-acre value. Market dynamics are influenced by supply chain adjustments due to tariffs and Environmental Protection Agency (EPA) regulations on endangered species protection, affecting both pricing and product selection. The demand for carbon-linked enhanced-efficiency fertilizers drives premium market segments. The industry undergoes channel destocking following the 2022-24 inventory accumulation, sustained investments in new action modes, and digital services indicate robust market fundamentals[1].
Key Report Takeaways
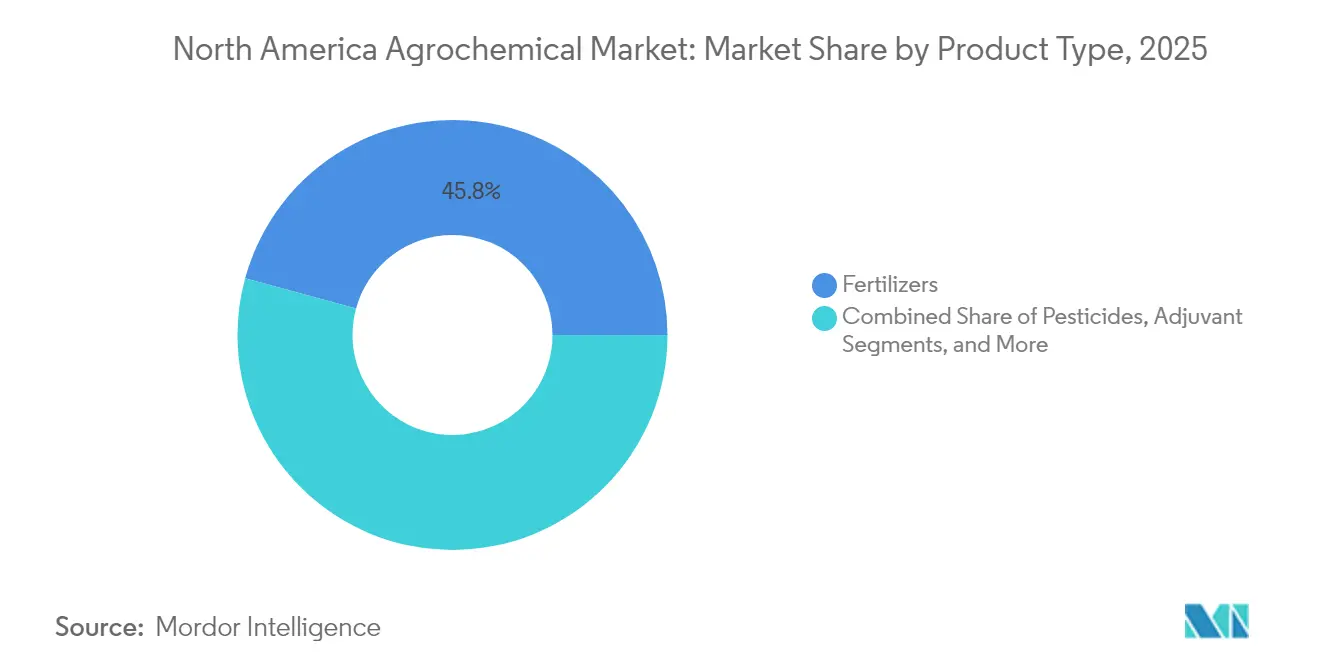
- By product type, fertilizers led with 45.75% of the North America agrochemical market share in 2025, while adjuvants are projected to expand at a 6.18% CAGR through 2031.
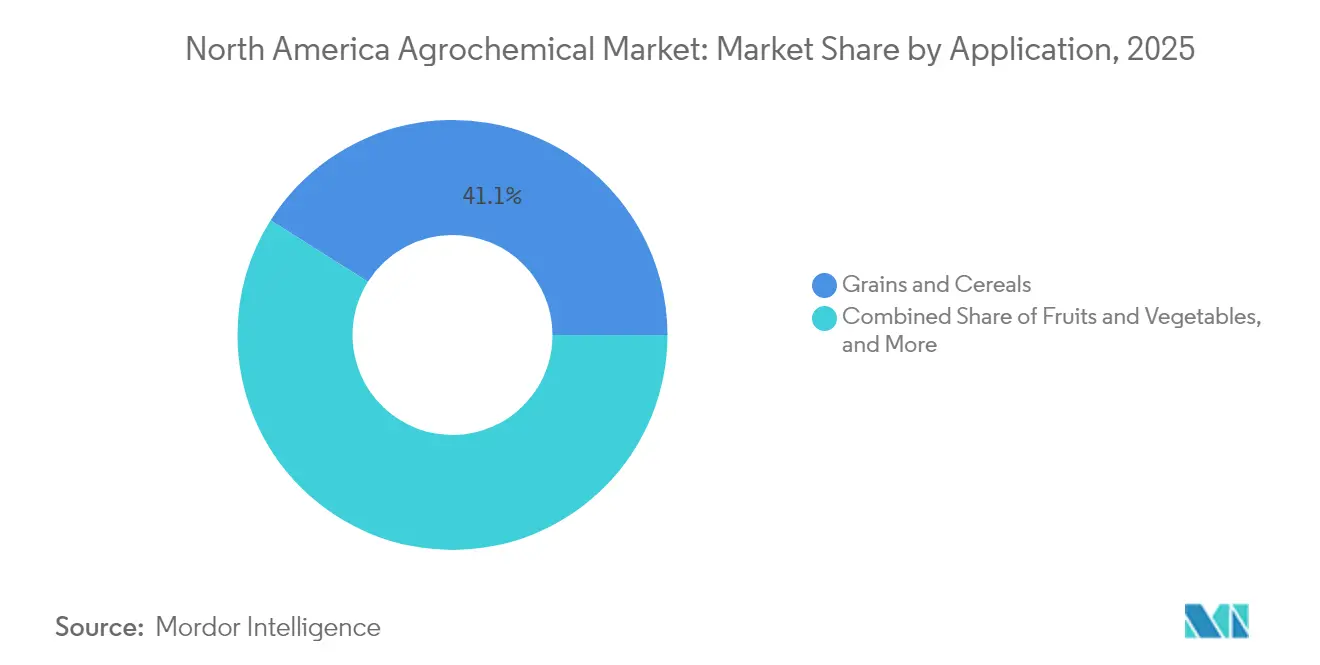
- By application, grains and cereals captured 41.05% of the North America agrochemical market size in 2025, while fruits and vegetables are advancing at a 5.32% CAGR through 2031.
- By geography, the United States held a 70.62% market share in 2025, whereas Mexico was projected to have the highest CAGR of 4.98% through 2031.
- Syngenta Group, Bayer AG, Corteva Agriscience, BASF SE, and FMC Corporation collectively account for around 59.70% of the market share in 2025.
Note: Market size and forecast figures in this report are generated using Mordor Intelligence’s proprietary estimation framework, updated with the latest available data and insights as of 2026.
Market Trends and Insights
Drivers Impact Analysis of North America Agrochemical Market*
| Driver | (~) % Impact on CAGR Forecast | Geographic Relevance | Impact Timeline |
|---|---|---|---|
| Rising demand for higher crop yields | +1.0% | United States Midwest and Canadian Prairies | Medium term (2-4 years) |
| Government agrochemicals purchase subsidy programs | +0.8% | United States and Mexico | Short term (≤ 2 years) |
| Precision farming driving optimized inputs | +0.9% | United States and Canada | Long term (≥ 4 years) |
| Rising pest resistance and demand for modified solutions | +0.6% | Herbicide-intensive regions | Medium term (2-4 years) |
| Carbon-credit linked enhanced-efficiency agrochemicals | +0.3% | United States and Canada | Long term (≥ 4 years) |
| Expansion of specialty micronutrient blends | +0.2% | North America | Medium term (2-4 years) |
| Source: Mordor Intelligence | |||
Rising Demand for Higher Crop Yields
The United States Department of Agriculture projects that corn productivity must increase by 1.2% annually to meet food demand by 2030. Field trials demonstrate that plant-growth regulators, specifically Ascend 2, increase corn yields by 3 bushels per acre. The combination of precision application techniques reduces nutrient losses while facilitating participation in carbon-credit programs. Agricultural producers across the Midwest United States and Canadian Prairies implement these yield-enhancing technologies, as incremental percentage improvements translate to substantial revenue increases. This market dynamic influences manufacturers to focus research and development on formulations that provide quantifiable yield improvements rather than maintaining existing productivity levels.
Government Agrochemicals Purchase Subsidy Programs
Government funding initiatives are reducing barriers to adopting modern agricultural inputs across North America. In 2024, the United States Department of Agriculture allocated USD 236 million to increase domestic fertilizer production, aiming to reduce price volatility and decrease import dependency. In Mexico, government programs support sustainable crop protection products, maintaining demand despite glyphosate limitations. Canadian provinces implement cost-sharing programs for precision agriculture technologies, including variable rate application equipment and soil testing services. These subsidies effectively reduce farmers' input costs and facilitate the adoption of advanced technologies by shortening the return on investment period for precision equipment and specialized agricultural chemicals.
Precision Farming Driving Optimized Inputs
Research demonstrates variable-rate sprayers reduce herbicide volumes by 42% while maintaining effectiveness. Precision AI's autonomous aerial systems treat 92 acres per hour at USD 2.85 per acre, influencing traditional ground-based providers and driving development of concentrated, low-drift formulations. FMC Corporation's 3RIVE 3D technology reduces water usage by 90% compared to conventional systems and covers 480 acres per fill, enhancing both operational efficiency and environmental impact. Application systems incorporating artificial intelligence and machine learning facilitate real-time pest detection and precise chemical application, with specialty crop farmers reporting annual cost savings of USD 40,000. This technological advancement is shifting the market toward high-value, digitally-enhanced products rather than volume-based sales.
Carbon-Credit Linked Enhanced-Efficiency Agrochemicals
Slow-release nitrogen fertilizers reduce nitrous-oxide emissions by 30-50%, enabling farmers to earn carbon credits that partially offset higher prices[2]. Companies, including Nutrien, combine agronomic support with verification services, transforming input sales into outcome-based agreements. Adoption is highest in the United States and Canadian row-crop farming, where large-scale operations maximize environmental benefits. University of Saskatchewan research shows that polymer-coated products have different levels of effectiveness depending on application timing and environmental conditions, necessitating expert agronomic guidance to optimize both environmental and crop performance benefits. This trend continues as carbon credit programs develop and regulations strengthen, generating ongoing demand for enhanced efficiency products that provide measurable environmental improvements while maintaining agricultural productivity.
Restraints Impact Analysis of North America Agrochemical Market*
| Restraint | (~) % Impact on CAGR Forecast | Geographic Relevance | Impact Timeline |
|---|---|---|---|
| Stringent Environmental Protection Agency (EPA) re-registration requirements | -0.9% | United States | Medium term (2-4 years) |
| Escalating research and development and registration costs | -0.7% | Global | Long term (≥ 4 years) |
| Consumer push for residue-free produce | -0.5% | North America specialty-crop belts | Medium term (2-4 years) |
| Biological solutions displacing conventional chemicals | -0.4% | United States and Canada | Long term (≥ 4 years) |
| Source: Mordor Intelligence | |||
Stringent Environmental Protection Agency (EPA) Re-Registration Requirements
The annual maintenance fees of USD 4,875 per product and enhanced ecological assessments increase compliance costs, affecting smaller registrants and leading to product withdrawals[3]. The implementation of the Herbicide Strategy necessitates mitigation measures for over 900 endangered species, which include application restrictions and buffer zone requirements that impact product usage patterns. In October 2024, 131 Federal Insecticide, Fungicide, and Rodenticide Act section 3 registrations and 44 Federal Insecticide, Fungicide, and Rodenticide Act section 24(c) registrations were cancelled due to non-payment of maintenance fees. The Pesticide Registration Improvement Act of 2022 requires bilingual labeling, with Spanish translations for health and safety sections mandatory by 2025 for high-toxicity products and for all pesticide labels by 2030.
Consumer Push for Residue-Free Produce
The United States International Trade Commission's Global Economic Impact analysis reveals that varying maximum residue levels across markets disrupt trade and increase compliance costs for agricultural exporters. Specialty crop producers must manage different maximum residue limits in various countries, which increases testing expenses and requires shorter intervals between spraying. Studies indicate that 93% of no-till corn and soybean production uses chemical pesticides, with a substantial portion deemed hazardous to human health. Retailers have implemented protocols favoring reduced-risk pesticides and post-harvest washing due to residue concerns[4]. These factors drive demand for low-persistence pesticides while limiting overall chemical usage.
*Our forecasts treat driver/restraint impacts as directional, not additive. The impact forecasts reflect baseline growth, mix effects, and variable interactions.
North America Agrochemical Market Segment Analysis
By Product Type:
Fertilizers Lead as Adjuvants Gain SpeedFertilizers hold 45.75% of the North America agrochemical market share in 2025, maintaining their essential position in nutrient management across major corn, soybean, and wheat production areas. Enhanced-efficiency fertilizers, featuring controlled-release mechanisms, gain market share through their compatibility with carbon-credit programs and precision application equipment. Digital soil-mapping enables suppliers to offer customized blends, increasing revenue per metric ton despite stable overall volumes.
Adjuvants represent the fastest-growing segment in the North American agrochemical market, with a 6.18% CAGR through 2031. This growth stems from rising demand for spray-quality enhancers that minimize drift and improve foliar absorption. The growth correlates with increased adoption of drone and autonomous sprayer technologies, which require specialized surface-active agents due to lower carrier volumes. Despite their smaller market share, adjuvants achieve mid-single-digit CAGR, exceeding pesticides and fertilizers, as regulatory requirements emphasize improved spray deposition accuracy. Pesticides maintain their position as the second-largest product category, with herbicides predominant due to widespread herbicide-tolerant crop adoption and weed control needs. Plant growth regulators remain a specialized segment, with products like WinField United's Ascend 2 delivering corn yield increases of 3 bushels per acre, supporting premium pricing despite limited market reach.

By Application:
Grains Dominate, Fruits and Vegetables AccelerateGrains and cereals account for 41.05% of the North America agrochemical market size in 2025. This dominance stems from the adoption of genetic technology and high acreage concentration in the United States Corn Belt and the Canadian Prairies. Herbicide-tolerant traits form the foundation of chemical programs, while growers adopt pre-emergence residuals and post-emergence combinations to manage resistance. Large grain farms effectively implement precision nutrient and variable-rate lime applications, thereby supporting demand for fertilizers and liming products.
The fruits and vegetables segment grows at a 5.32% CAGR, driven by intensive management practices and adoption of premium chemistries to meet residue-free retail requirements. While the North America agrochemical market size for specialty crops remains smaller than grains, it generates higher revenue per acre. The segment's growth comes from investments in low Pre-Harvest Interval (PHI) fungicides, targeted miticides, and pollinator-safe insecticides. Pulses and oilseeds constitute a major application category, with soybean production relying on herbicide programs for weed control in no-till systems. The turf and ornamentals segment maintains premium pricing due to aesthetic requirements and specific pest challenges, as demonstrated by fluopyram's effectiveness against Pacific shoot-gall nematode in golf course applications.
Geography Analysis
United States Agrochemical Market
The United States holds 70.62% of the North America agrochemical market share in 2025. The market growth through 2031 depends on the adoption of precision spraying technology, which reduces herbicide usage by 42% while maintaining effectiveness. Federal initiatives to increase domestic fertilizer production capacity combine agricultural input security with farm policy, ensuring a stable supply amid stricter regulations.
Mexico Agrochemical Market
Mexico shows the highest growth rate at 4.98% CAGR through 2031. The country's agricultural exports to the United States now exceed Chinese volumes, driven by nearshoring of produce supply chains. The planned reduction in glyphosate usage drives farmers to adopt integrated weed management systems that combine mechanical methods and alternative chemical solutions. Government-funded loans and infrastructure development enhance cold-storage and logistics capabilities, which increase chemical demand through improved market access.
Canada Agrochemical Market
Canada maintains its market share through Prairie grain operations that utilize extensive variable-rate application systems. Research by the University of Saskatchewan demonstrates a 30-50% reduction in nitrous-oxide emissions when combining enhanced-efficiency fertilizers with zone-based application methods, providing both financial and environmental benefits. Provincial support through grants for soil mapping and drone monitoring strengthens these agricultural practices.
Regulatory Landscape
Agrochemicals in North America are subject to tighter pesticide registration and stewardship requirements, with the US Environmental Protection Agency (EPA) operating under FIFRA and Clean Water Act permitting for certain application-related discharges. EPA continues to update its registration review program, including an updated schedule and a stated deadline of October 1, 2026 for completing final decisions for pesticides registered before October 1, 2007, while also implementing process changes such as a draft PR Notice in early 2026 that updates guidance for notifications, non-notifications, and minor formulation amendments.
In Canada, Health Canada’s Pest Management Regulatory Agency (PMRA) continues to adjust submission and use frameworks through consultations, including PRO2026-01 (February 2026) on permitting the use of Remotely Piloted Aircraft Systems (drones) for applying pesticides already registered for aerial application, and a July 2026 update to the Management of Submissions Policy. Trade and labeling requirements also shape compliance and supply chains, including the Pesticide Registration Improvement Act of 2022 bilingual labeling pathway in the United States and the July 2026 start of the mandatory USMCA review process, which introduces uncertainty for cross-border input flows and agricultural trade rules that affect product movement and pricing across the region.
Competitive Landscape
Syngenta Group, Bayer AG, Corteva Agriscience, BASF SE, and FMC Corporation collectively held around 60.0% share of the North America agrochemical market in 2024, indicating moderate market concentration. Syngenta maintained its market leadership despite a 24% decline in regional crop-protection sales in 2024, primarily due to distributor inventory adjustments. The company's strong position is based on its robust development pipeline for fungicides and insecticides. In 2025, Bayer AG strengthened its market position by leveraging digital platforms to presell Vyconic soybeans with five-way tolerance, targeting fields affected by resistance for a 2027 launch. Corteva demonstrated financial resilience through its balanced revenue streams from crop protection products, achieving first-quarter 2025 earnings per share of USD 1.13, which exceeded market expectations.
FMC's 3RIVE 3D in-furrow application system demonstrates technological advancement in the sector, reducing water consumption by 90% and providing 480-acre coverage per fill. BASF's consideration of an initial public offering for its Agricultural Solutions division indicates potential changes in resource allocation and research development strategies. The market faces competition from agricultural technology companies such as Precision AI, whose autonomous aerial sprayers operate at costs below USD 2.85 per acre, challenging traditional application methods.
Companies are focusing on artificial intelligence for pest prediction, variable rate application systems for chemical optimization, and enhanced formulations that balance efficacy with environmental considerations. The industry demonstrates increased investment in digital platforms to improve agricultural decision-making and product performance.
North America Agrochemical Industry Leaders
-
Syngenta Group
-
Bayer AG
-
Corteva Agriscience
-
BASF SE
-
FMC Corporation
- *Disclaimer: Major Players sorted in no particular order
North America Agrochemical Market Companies Covered in this Report
- Syngenta Group
- Bayer AG
- Corteva Agriscience
- BASF SE
- FMC Corporation
- UPL Limited
- Nutrien Ltd.
- The Mosaic Company
- CF Industries Holdings, Inc.
- Yara International ASA
- Sumitomo Chemical America, Inc.
- ICL Group Ltd.
- Nufarm Limited
- Haifa Chemicals Ltd.
- Helena Agri-Enterprises, LLC (Marubeni Corporation)
Market Opportunities and Future Outlook
Technology and regulatory-driven shifts are opening space for higher-value, lower-use-rate solutions and application-enabling services. Precision application systems already discussed in the market (including variable-rate tools and in-furrow approaches) increase the value of adjuvants, drift-control features, and concentrated formulations. At the same time, Endangered Species Act compliance workstreams expand demand for mitigation-aligned product labels, decision-support tools, and stewardship programs as EPA advances strategies beyond herbicides, including its Draft Fungicide Strategy released for public comment in July 2026.
On the fertilizer side, investment and reshoring activity supports opportunities in premium nitrogen and enhanced-efficiency portfolios linked to carbon-linked programs and supply reliability. A concrete proof point is Yara International’s July 2026 agreement to acquire Gulf Coast Ammonia’s Texas City, Texas facility for USD 1.3 billion, targeting end-2026 commissioning and ramp-up to 1.3 million metric tons per year nameplate capacity, alongside continued momentum behind large US low-carbon ammonia initiatives such as the Blue Point project in Louisiana highlighted in 2026. In crop protection, licensing and supply models are expanding access to new actives and helping retailers and growers manage resistance, including the June 2026 FMC-Corteva co-exclusive strategic supply and license agreement around rimisoxafen for corn and soybean systems across the Americas.
Recent Industry Developments in North America Agrochemical Market
- July 2026: FMC Corporation filed its first global regulatory submission for the herbicide active ingredient rimisoxafen with the US Environmental Protection Agency, targeting uses that include corn and soybeans, plus sunflower and select pulse crops. The submission advances a new herbicide option toward commercialization and adds momentum to the industry push for novel tools as resistance pressures intensify.
- June 2026: FMC Corporation and Corteva Agriscience announced a co-exclusive strategic supply and license agreement to expand access to FMC’s rimisoxafen technology across North and South American corn and soybean markets. FMC retains ownership and supplies the active ingredient, while Corteva makes an initial USD 200 million prepurchase payment and takes on formulation and commercialization, accelerating route-to-market scale through Corteva’s channel reach.
- June 2025: FMC Corporation signed a strategic agreement with Corteva Agriscience to expand FMC’s fluindapyr fungicide technology in the United States corn and soybean markets. The agreement broadened access to a newer fungicide active ingredient aimed at foliar disease control, supporting portfolio refresh and helping distributors position differentiated disease management programs.
North America Agrochemical Market Report Scope and Research Methodology
Market Definition and Coverage
For this report, the market is defined as the value of agrochemical products sold for agricultural use across North America, covering fertilizers, pesticides, adjuvants, and plant growth regulators, across major crop and non-crop applications.
Scope exclusions: The estimate does not include agricultural machinery, precision spraying hardware, irrigation equipment, or farm services because these are typically reported separately from agrochemical product revenues.
Segments Covered in This Report
- By Product Type
- Fertilizers
- Nitrogenous
- Phosphatic
- Potassic
- Other Fertilizers
- Pesticides
- Herbicides
- Insecticides
- Fungicides
- Other Pesticides
- Adjuvants
- Plant Growth Regulators
- Fertilizers
- By Application
- Grains and Cereals
- Pulses and Oilseeds
- Fruits and Vegetables
- Turfs and Ornamentals
- Other Applications
- By Geography
- United States
- Canada
- Mexico
- Rest of North America
Data Sources, Market Sizing, and Validation
Desk Research
Desk research was used to set the market boundary, build the demand drivers, and sanity-check how fast acres and input intensity can realistically move year to year in North America.
We typically rely on public sources such as USDA crop acreage and farm input tables, USGS mineral and fertilizer-related statistics, FAOSTAT for crop and fertilizer use context, and national statistics bodies in Canada and Mexico for agriculture output and trade. Where possible, these were cross-checked against each other to ensure fertilizer and crop use context did not drift by geography or product definition.
To make the model usable in real life, we also reviewed supplier annual reports, investor presentations, product labels and registrations published by regulators, and reputable agriculture press to track pricing direction and product mix shifts. Where needed, paid subscriptions focused on company financials and patent databases were used to confirm corporate exposure and innovation intensity around active ingredients and formulations. These sources are illustrative, and many other public and paid references were also used for data collection, validation, and clarification.
Primary Interviews and Surveys
Primary work was used to pressure-test assumptions that are not cleanly visible in public data, especially how channel inventories, pricing programs, and crop mix changes translate into realized sales for agrochemical products. We spoke with manufacturers, distributors, retailers, agronomists, and large farm operators across the United States, Canada, and Mexico so gaps from desk research could be filled and then checked again from multiple angles.
Distribution of primary research fieldwork respondents
| Company type | Respondent position |
|---|---|
| Top tier: 25% | CXOs: 17% |
| Mid tier: 58% | Functional/Unit leaders: 39% |
| Smaller Players: 17% | Managers: 44% |
Market-Sizing & Forecasting
Sizing starts from a top-down demand pool that is reconstructed using crop acreage and planting mix, typical application intensity by crop, and average price realization by product group. Regional totals are then adjusted for seasonality and channel inventory movements.
Once the regional totals are formed, they are corroborated using selective bottom-up approximations like sampling distributor throughput, cross-checking supplier revenue exposures, and applying sampled price per ton or price per hectare logic to observed volume signals. In the North America context, this helps prevent value swings driven by timing mismatches between reported volumes and realized pricing.
A few inputs matter a lot in this market, so they are treated explicitly in the model rather than being buried inside a single growth rate. These include planted area for grains and oilseeds, nutrient application rates and fertilizer price direction, pest and disease pressure that shifts pesticide intensity, the share of specialty crops versus broad-acre crops, and the adoption pace of newer formulations and adjuvants that can change doses and pricing. When gaps appear in bottom-up checks, they are handled through conservative interpolation and then re-tested with interview feedback so the final totals do not depend on a single company or one channel view.
For forecasting, scenario analysis was used to translate uncertainty in crop prices, acreage shifts, and fertilizer and pesticide pricing into a small set of plausible paths, followed by a central case that aligns with what most primary respondents expect. The forecast is then rolled forward by product group and application so the growth rate is earned through drivers, not assumed.
Data Validation & Update Cycle
Outputs are validated through triangulation across independent signals, including acreage trends, input intensity ranges shared by practitioners, and price direction visible in public reporting and channel commentary. Large variances are flagged, and the model is re-run after assumptions are revisited, followed by a second analyst review before sign-off.
The report is refreshed annually, and interim updates are triggered when material events occur, such as major regulatory changes, sharp fertilizer price shocks, or large shifts in planting decisions. Before delivery, an analyst performs a final pass to make sure the narrative and numbers reflect the most recent public releases and interview-based checks, particularly where 2025 to 2026 transition effects could affect realized pricing.
Mordor Intelligence's North America Agrochemicals Market Sizing Compared With Other Published Estimates
Published market sizes for North America agrochemicals can look different even when the topic sounds identical, mostly because scope boundaries and year labeling are handled differently. Another common reason is that some estimates lean heavily on a single indicator like crop acreage, even though pricing and product mix can swing the value result.
By tracking crop acreage, application intensity, and realized price movements together, Mordor Intelligence keeps the estimate anchored to what is actually applied and sold across fertilizers, pesticides, adjuvants, and plant growth regulators, rather than expanding the scope into adjacent farm equipment or services.
Benchmark comparison
| Source | Market Size | Gaps in Research Methodology |
|---|---|---|
| Mordor Intelligence | USD 41.63 B (2026) | |
| Global Databook A | USD 41.10 B (2025) | Uses a different labeled base year and its grouping is presented as revenue by broad product buckets, which can shift totals when price timing and segment mapping differ from a 2026-current-year view. |
| Regional Publisher B | USD 25.00 B (2024) | Appears to apply a narrower value capture in 2024, which likely undercounts fertilizer and full crop input coverage, and it also sets a different historical window that changes inflation and pricing carryover into the base. |
Across the three estimates, the spread is mainly explained by what gets counted inside agrochemicals and how the base year is set when pricing was moving. When the scope is kept consistent across fertilizers and crop protection inputs and the value is tied back to acreage, intensity, and price checks, the market total becomes easier to reproduce and audit over time.
Key Questions Answered in the Report
How large is the North America agrochemical market in 2026?
It stands at USD 41.63 billion and is projected to reach USD 50.85 billion by 2031, implying a 4.08% CAGR over the forecast period.
Which product category currently generates the most revenue?
Fertilizers lead with 45.75% of 2025 sales, driven by both commodity NPK and rising enhanced-efficiency formulations.
What is the fastest-growing geographic segment through 2031?
Mexico is expanding at a 4.98% CAGR as nearshoring of produce supply chains and modernization programs boost input demand.
Which companies control the majority of regional sales?
Syngenta Group, Bayer AG, Corteva Agriscience, BASF SE, and FMC Corporation collectively hold around 59.70% of revenue, reflecting moderate concentration and ongoing innovation rivalry.