
Market Overview
| Study Period | 2021 - 2031 |
|---|---|
| Forecast Data Period | 2026 - 2031 |
| Base Year Market Size (2025) | USD 54.30 Billion |
| Market Size (2026) | USD 57.5 Billion |
| Market Size (2031) | USD 76.60 Billion |
| Growth Rate (2026 - 2031) | 5.90 % |
| Market Concentration | High |
Major Players *Disclaimer: Major Players sorted in no particular order Image © Mordor Intelligence. Reuse requires attribution under CC BY 4.0. | |
North America Agricultural Machinery Market Analysis by Mordor Intelligence
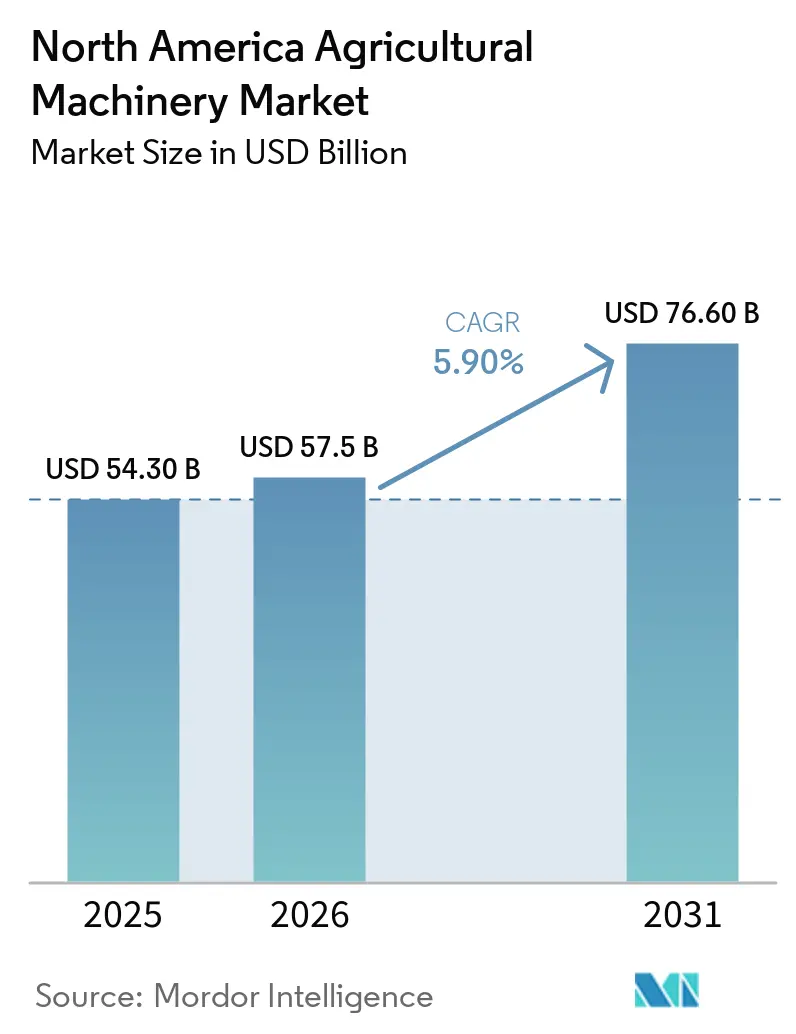
The North America agricultural machinery market was valued at USD 54.30 billion in 2025 and is projected to grow from USD 57.50 billion in 2026 to USD 76.60 billion by 2031, at a CAGR of 5.90% from 2026 to 2031. Federal support, rising labor costs, and precision‑ag adoption are reshaping farm equipment demand[1]. Robust payments have preserved grower liquidity even as crop prices returned to long‑term averages, while a tightening labor pool has accelerated automation in spraying, tillage, and harvesting. Precision technologies are increasingly integrated into large farms, driving demand for autosteer‑ready tractors and sensor‑equipped combines. At the same time, financing arms of major manufacturers are underwriting a majority of machinery purchases, helping producers manage higher interest rates. Together, these factors are shortening replacement cycles and lifting annual equipment sales across the North America agricultural machinery market.
Key Report Takeaways
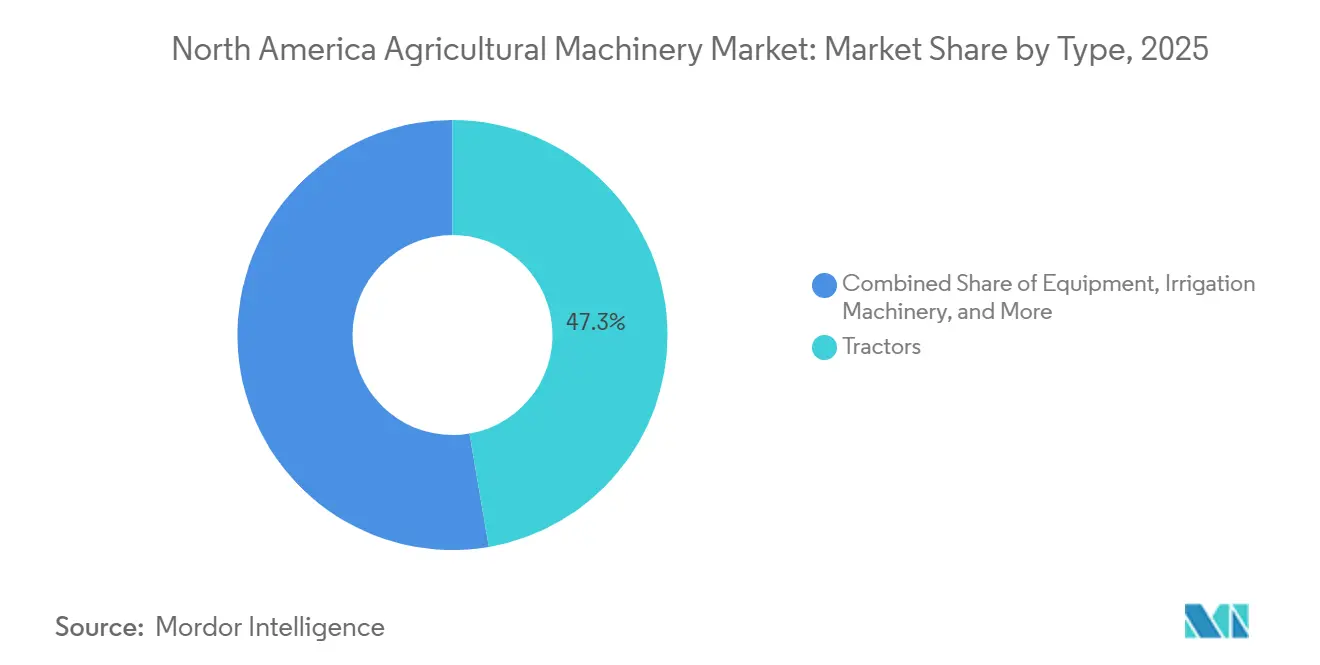
- By type, the tractor segment accounted for the largest market share, at 47.3% of the North America agricultural machinery market in 2025, while irrigation machinery is projected to grow at the fastest CAGR, at 6.4%, from 2026 to 2031.
- By geography, the United States accounted for the largest share at 61.4% in 2025, while Mexico is projected to grow at the fastest CAGR of 6.6% from 2026 to 2031.
Note: Market size and forecast figures in this report are generated using Mordor Intelligence’s proprietary estimation framework, updated with the latest available data and insights as of 2026.
Market Trends and Insights
Drivers Impact Analysis of North America Agricultural Machinery Market*
| Driver | (~)% Impact on CAGR Forecast | Geographic Relevance | Impact Timeline |
|---|---|---|---|
| Robust Farm-Income Outlook and Subsidy Programs | +1.2% | United States, Canada, selective support in Mexico | Medium term (2-4 years) |
| Rising Labor Scarcity and Wage Inflation | +1.0% | United States and Canada, emerging in Mexico | Short term (≤ 2 years) |
| Precision-Agriculture Adoption Accelerating Equipment Replacement | +0.9% | United States Corn Belt, Canadian prairies, pilot zones in Mexico | Medium term (2-4 years) |
| Original Equipment Manufacturer (OEM) Embedded-Finance Boosting Purchasing Power | +0.7% | United States and Canada, expanding in Mexico | Short term (≤ 2 years) |
| Subscription-Based Machinery Access Models | +0.4% | United States, early trials in Canada | Long term (≥ 4 years) |
| Climate-Smart Grants Driving Low-Emission Equipment | +0.5% | United States, spillover to Canada | Long term (≥ 4 years) |
| Source: Mordor Intelligence | |||
Robust Farm-Income Outlook and Subsidy Programs
Federal support programs continue to underpin machinery demand even as crop receipts soften. In March 2022, the Government of Canada invested in agricultural machinery innovation and technology, reinforcing the role of public funding in sustaining capital expenditure. Direct government payments, including climate-focused allocations, have provided a cushion that allowed producers to maintain investment despite lower crop prices. The Farm Bill extended crop insurance subsidies and introduced targeted grants for precision equipment that reduce nitrogen runoff, lowering the effective cost of GPS-guided planters and variable-rate spreaders. Canada mirrors this pattern through programs that stabilized income for prairie growers, while Mexico’s initiatives allocated significant funding to smallholder mechanization, disproportionately benefiting key agricultural states. Subsidy-driven liquidity compresses replacement cycles, as operators trade in older tractors for precision-ready fleets.
Rising Labor Scarcity and Wage Inflation
Agricultural labor markets have tightened sharply, with many producers ranking workforce availability as their primary constraint. Average farm wages have continued to climb, while seasonal visa processing delays have extended hiring timelines. According to the Association of Equipment Manufacturers (AEM), sales of 4WD tractors increased by 31.7%, from 3,466 units in 2022 to 4,564 in 2023, reflecting the increasing adoption of mechanization to offset labor shortages. This wage pressure disproportionately affects labor-intensive segments such as vegetable harvesting, orchard management, and livestock handling, driving the adoption of autonomous tractors, robotic weeders, and self-propelled forage harvesters [2]. Canada faces parallel constraints: provinces offer incentives to attract operators during harvest, while Mexico’s rural-to-urban migration is eroding the traditional labor pool. Cooperatives are pooling capital for shared machinery fleets, making mechanization a survival imperative for mid-sized operations.
Precision-Agriculture Adoption Accelerating Equipment Replacement
Precision agriculture penetration has expanded rapidly among large farms, with autosteer systems and connected platforms becoming standard. This adoption wave compels producers to retire older equipment lacking modern architecture, as retrofitting is often cost-prohibitive relative to purchasing new units [3]. The shift is particularly pronounced in the Corn Belt, where growers use yield maps to adjust seeding density and nitrogen application rates, achieving input savings and yield gains. Integrated platforms from leading manufacturers aggregate data across planters, sprayers, and combines, creating ecosystem lock-in effects that favor bundled purchases. Canada’s prairie provinces, with their large field sizes, see even higher uptake of precision agriculture.
Climate-Smart Grants Driving Low-Emission Equipment
Climate-focused initiatives have allocated substantial funding for equipment upgrades that reduce greenhouse gas emissions. Eligible investments include electric tractors, methane digesters, and precision sprayers that cut chemical use. New electric tractor models have entered vineyards, orchards, and dairy operations, supported by rebates under state and federal programs. Canada’s clean technology programs mirror this approach, disbursing funds for solar-powered irrigation pumps and electric utility vehicles. The constraint remains the availability of battery-grade semiconductors, as agricultural demand competes with the automotive and grid-storage sectors, extending lead times for electric models. Climate-focused subsidies are bifurcating the market, creating a premium tier of low-emission equipment that commands higher prices but qualifies for grants that offset costs, making total ownership competitive with diesel alternatives for operators in carbon-credit programs.
Restraints Impact Analysis of North America Agricultural Machinery Market*
| Restraint | (~)% Impact on CAGR Forecast | Geographic Relevance | Impact Timeline |
|---|---|---|---|
| High Upfront and Maintenance Costs of Advanced Machinery | -0.8% | United States and Canada, acute in Mexico | Short term (≤ 2 years) |
| Volatile Commodity Prices Curbing Capital Expenditure (CapEx) Cycles | -0.6% | United States and Canada, moderate in Mexico | Medium term (2-4 years) |
| Interest-Rate-Driven Credit Tightening at the Farm Level | -0.5% | United States and Canada | Short term (≤ 2 years) |
| Battery-Grade Semiconductor Supply Constraints for E-Tractors | -0.3% | United States and Canada, minimal in Mexico | Long term (≥ 4 years) |
| Source: Mordor Intelligence | |||
High Upfront and Maintenance Costs of Advanced Machinery
The rising cost of tractors, planters, and combines has placed significant financial pressure on producers, particularly smaller operators. Modern precision equipment carries high purchase prices, while maintenance expenses add further strain through software subscriptions and premium replacement parts. For smallholders, even compact machinery can be prohibitively expensive without subsidized financing. The result is a widening technology gap between large-scale farms, which can spread costs across extensive acreage, and smaller producers, who struggle to justify investments. This dynamic concentrates market growth among larger operations that can achieve payback through efficiency gains and precision farming benefits.
Volatile Commodity Prices Curbing Capital Expenditure (CapEx) Cycles
Commodity price fluctuations continue to compress margins for row‑crop producers, curbing their ability to commit to new machinery purchases. Farmers often defer capital expenditure until futures markets stabilize above breakeven thresholds, extending the age of existing equipment fleets. In Canada, growers have postponed replacements for combines and air seeders, while in Mexico, government price supports have provided more stability for staple crops. Export‑oriented producers, however, have scaled back investments in irrigation and other systems as demand softened. The broader implication is that volatility in commodity markets introduces cyclicality into equipment replacement cycles, with producers waiting for sustained recovery before committing to multi‑year financing.
*Our forecasts treat driver/restraint impacts as directional, not additive. The impact forecasts reflect baseline growth, mix effects, and variable interactions.
North America Agricultural Machinery Market Segment Analysis
By Type:
Tractors Lead while Irrigation Machinery Gains SpeedBy type, tractors accounted for the largest market share, at 47.3% of the North America agricultural machinery market in 2025. Tractors remain the backbone of crop operations, reflecting their indispensable role across diverse farming systems. The segment benefits from autonomous retrofits that have been extensively tested, thereby validating real‑world uptime and reducing skepticism about driverless tillage. These innovations highlight tractors as the central hub of mechanization, integrating precision technologies that improve efficiency and productivity. Their dominance underscores how farms continue to prioritize versatile equipment capable of handling multiple tasks, while also adapting to new digital platforms that enhance connectivity and operational control.
Irrigation machinery is projected to grow at the fastest CAGR of 6.4% from 2026 to 2031. Irrigation equipment is gaining momentum as water‑scarcity mitigation projects expand across North America, with center‑pivot conversions accelerating adoption in Mexico. This segment is anticipated to outpace other categories, driven by the need for sustainable water management and climate resilience. Precision irrigation systems are increasingly integrated with digital monitoring tools, enabling farmers to optimize water use while maintaining yields. The growth trajectory reflects how irrigation machinery is evolving from a support function into a strategic investment, positioning itself as one of the most dynamic areas of agricultural equipment demand.

Geography Analysis
United States Agricultural Machinery Market
The United States accounted for the largest share at 61.4% in 2025. Tractors remain central to large-scale operations, with Corn Belt farms regularly upgrading fleets to stay compatible with telematics and precision systems. California specialty-crop growers continue to invest in irrigation to comply with groundwater regulations, while cotton producers in the Southern Plains adopt precision sprayers to manage herbicide resistance. Replacement-driven demand is anticipated to sustain growth, reflecting the United States market’s reliance on technology upgrades to maintain productivity and efficiency across diverse agricultural regions.
Mexico Agricultural Machinery Market
Mexico is projected to grow at the fastest CAGR, 6.6%, from 2026 to 2031. Government funding programs that cover a portion of equipment costs for small cooperatives are accelerating adoption across fragmented landholdings. Sinaloa’s vegetable growers dominate tractor uptake, Jalisco’s avocado orchards invest in hillside-stable sprayers, and Sonora’s irrigated wheat farms expand combine use. Rental platforms are bridging affordability gaps for smallholders, enabling broader access to modern machinery. This dynamic positions Mexico as the fastest-growing geography in the region, with mechanization increasingly viewed as essential for competitiveness and resilience in both domestic and export-oriented agriculture.
Canada Agricultural Machinery Market
Canada contributed a significant share of regional sales, concentrated in Saskatchewan, Alberta, and Manitoba. Large-scale air seeders dominate spring drilling in the Prairies, while dairy heartlands in Ontario and Quebec sustain demand for forage harvesters and manure spreaders. British Columbia’s berry growers prefer compact tractors with narrow wheelbases suited to specialty crops. Diverse crop profiles across provinces continue to drive steady demand for modern machinery, reinforcing Canada’s role as a stable and important contributor to the North America agricultural machinery market.
Regulatory Landscape
Agricultural machinery in North America operates under a mix of safety, road visibility, and emissions rules that shape product design and after-sales requirements. In the United States, OSHA requires roll-over protective structures (ROPS) for agricultural tractors manufactured after October 25, 1976 (29 CFR 1928.51), while for road operation, new agricultural equipment is subject to lighting and marking requirements (49 CFR Part 562, referencing ANSI/ASAE 279.14). For powertrain compliance, the U.S. EPA regulates emissions from nonroad compression-ignition engines under 40 CFR Part 1039 (Tier 4), driving OEM focus on engine controls and aftertreatment integration.
Canada aligns closely with engine emissions regulations through Environment and Climate Change Canada, maintaining requirements consistent with US-equivalent standards for farm tractors and other machines. Policy attention has also shifted toward serviceability and uptime. In 2025, the U.S. EPA issued guidance clarifying that the Clean Air Act does not prevent farmers from repairing their own equipment and that manufacturers cannot restrict access to essential repair tools or software, reinforcing the role of access to diagnostics in ownership costs and dealer-OEM service models. Legislative activity such as H.R. 7849 also signals ongoing debate around how emissions compliance should be applied to nonroad agricultural engines, adding compliance-watch complexity for manufacturers and fleet operators.
Competitive Landscape
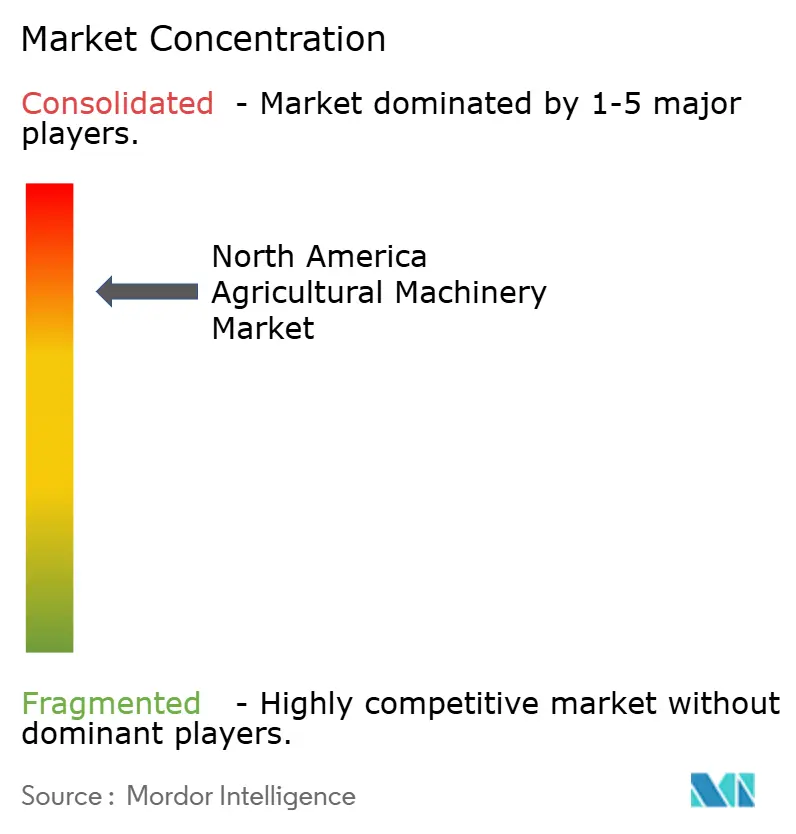
The North America agricultural machinery market remains consolidated in 2025, with the top five original equipment manufacturers commanding the majority of revenue. Deere & Company leads the segment, followed by CNH Industrial N.V., AGCO Corporation, Kubota Corporation, and CLAAS KGaA mbH. Competitive focus has shifted from mechanical specifications to digital ecosystems. Deere & Company emphasizes a per‑acre software model, CNH Industrial N.V. integrates Raven autonomy, and AGCO Corporation leverages its joint venture with Trimble Inc. to deliver a mixed‑fleet open platform. In April 2025, AGCO Corporation expanded its dealer footprint with Carter Agri-Systems in Utah and the launch of Delta Ag Equipment, Mississippi’s first full-line Fendt and Massey Ferguson outlet, enhancing market access for advanced machinery. These strategies highlight how digital integration, connectivity, and precision technologies now define leadership in agricultural machinery.
Smaller brands differentiate through customer intimacy and innovation. Kubota Corporation has earned strong dealer satisfaction and showcased its electric tractor lineup at major industry events. CLAAS KGaA mbH reorganized distribution in Dakota to strengthen direct touchpoints, while Butler Machinery continues to supply parts during the transition. Embedded finance strategies from leading OEMs create barriers to entry for startups, but subscription‑based access models such as MachineryLink Sharing are beginning to challenge traditional ownership structures. By monetizing idle capacity, these platforms introduce new ways for producers to access advanced machinery without full capital commitments.
Innovators in field robotics and sensing increasingly partner with established OEMs to accelerate commercialization. Autonomous implement specialists integrate onto existing tractor platforms, expanding functionality and reducing adoption hurdles. Precision‑ag software companies grow revenue by offering application‑specific modules that operate across brands and run seamlessly on cab displays. This cross‑compatibility could gradually erode lock‑in effects, encouraging more open ecosystems. Partnerships with firms such as Horsch Maschinen GmbH, KUHN SAS, Bernard Krone Holding SE & Co. KG, The Toro Company, Vermeer Corporation, and J.C. Bamford Excavators Ltd. illustrate how collaboration between innovators and OEMs is reshaping the competitive landscape.
North America Agricultural Machinery Industry Leaders
-
Deere & Company
-
AGCO Corporation
-
CLAAS KGaA mbH
-
Kubota Corporation
-
CNH Industrial N.V.
- *Disclaimer: Major Players sorted in no particular order
North America Agricultural Machinery Market Companies Covered in this Report
- Deere & Company
- CNH Industrial N.V.
- AGCO Corporation
- Kubota Corporation
- CLAAS KGaA mbH
- Mahindra & Mahindra Limited
- Netafim Inc.
- Lindsay Corporation
- Trimble Inc.
- Horsch Maschinen GmbH
- KUHN SAS
- Bernard Krone Holding SE & Co. KG
- The Toro Company
- Vermeer Corporation
- J.C. Bamford Excavators Ltd.
Market Opportunities and Future Outlook
Precision agriculture and automation are creating new demand pockets across tractors, implements, and irrigation systems, supported by named public programs and OEM ecosystem strategies. In April 2026, USDA launched the National Proving Grounds Network for AgTech (NPG-Ag), managed by Grand Farm, to evaluate and validate agricultural technologies in real-world conditions, which helps shorten the path from prototype to scaled deployment for autonomy, sensing, and connected implements. In Canada, Sustainable Canadian Agricultural Partnership funding has also shifted toward AI-enabled field decision tools, with Agriculture and Agri-Food Canada backing A.U.G. Signals Ltd. for AI-driven crop health and yield forecasting (announced July 2026), strengthening the data pipeline behind variable-rate application and sensor-equipped equipment adoption.
Manufacturing localization and parts availability are also becoming practical levers alongside digital capability upgrades. Deere announced a long-term commitment to invest in US manufacturing and, in January 2026, detailed facility investments including a parts distribution center in Hebron, Indiana, to support faster service fulfillment for connected fleets where uptime is monetized through per-acre and subscription models. Separately, AEM-reported volatility in 2026 tractor and combine sales highlights the value of flexible access models, including rental, sharing, and embedded finance, along with retrofits that extend fleet compatibility with modern precision platforms. Together, these shifts concentrate opportunity in autonomy-ready tractors, sensor-forward sprayers, and irrigation automation where program-backed validation, dealer service density, and parts availability influence adoption and replacement timing.
Recent Industry Developments in North America Agricultural Machinery Market
- April 2026: AGCO Corporation expanded its production-ag dealer coverage in the Upper Midwest as Ritchie Implement began operating as an authorized full-line production agriculture dealer in southwest Wisconsin under the FarmerCore hub-and-spoke model. The expansion increases local service density and on-farm support, which is important for the uptime of precision and connected equipment, and strengthens AGCO Corporation's route-to-market in a key row-crop geography.
- January 2025: Deere & Company unveiled autonomous agriculture solutions at CES 2025, including fully autonomous tillage and retrofit options for 8 Series and 9 Series tractors with a low upfront, per-acre monetization approach. The rollout reinforced the shift toward software and autonomy as a bundled value proposition that can pull through new equipment sales while creating recurring revenue tied to machine utilization.
- July 2024: CLAAS KGaA mbH introduced the LEXION 8900 TT combine, expanding its high-capacity harvesting lineup with a track-equipped configuration. The update targeted growers and custom harvesters focused on productivity and soil protection, supporting the premium combine segment where performance upgrades and technology packages drive replacement decisions.
North America Agricultural Machinery Market Report Scope and Research Methodology
Market Definition and Coverage
This market covers the value of agricultural machinery sold and used across North America for core farm activities like land preparation, planting, irrigation, crop care, harvesting, and forage handling, with values tracked in USD.
Scope exclusions: This sizing does not count farm inputs or services such as seeds, fertilizers, crop chemicals, custom-hire contracting, or farm labor services.
Segments Covered in This Report
- By Type
- Tractor
- Less Than 40 HP
- 40 to 100 HP
- More than 100 HP
- 4WD Tractors
- Equipment
- Plows
- Harrows
- Cultivators and Tillers
- Other Equipment
- Irrigation Machinery
- Sprinkler
- Drip
- Other Irrigation
- Harvesting Machinery
- Combine Harvesters
- Forage Harvesters
- Other Harvesting
- Haying and Forage Machinery
- Mowers
- Balers
- Other Haying and Forage
- Other Types
- Tractor
- By Geography
- United States
- Canada
- Mexico
- Rest of North America
Data Sources, Market Sizing, and Validation
Desk Research
Desk research was used to set the guardrails for the model, especially which equipment families are counted and how the region split is handled across the United States, Canada, and Mexico. We referred to public statistics and technical references such as USDA and Statistics Canada data tables, Mexico agriculture statistics releases, FAO data series, and UN Comtrade trade flows for relevant machinery categories.
To convert these signals into usable market inputs, the desk work also used items like company annual reports and investor presentations, product catalogs and dealer network disclosures, and reputable press coverage of equipment demand cycles. A paid subscription for company financials and news intelligence was used selectively to validate revenue exposure and to sanity-check timing of major product launches, and patent databases were referenced to track where automation and precision features are most active. These desk research sources are illustrative only, and many other public and paid references were also used for cross-checks and clarification during the study.
Primary Interviews and Surveys
Interviews and surveys with manufacturers, distributors, dealers, farm operators, and agricultural finance specialists in the United States, Canada, and Mexico clarify product demand, channel inventory, financing conditions, and replacement timing. Respondents also help fill country and product gaps and test ASP assumptions against equipment volumes. Unusual responses are checked against unit, trade, and farm income signals before final triangulation.
Distribution of primary research fieldwork respondents
| Company type | Respondent position |
|---|---|
| Top tier: 27% | CXOs: 18% |
| Mid tier: 48% | Functional/Unit leaders: 32% |
| Smaller Players: 25% | Managers: 50% |
Market-Sizing & Forecasting
Sizing starts with a top-down build where North America demand is reconstructed from machinery production and trade indicators, farm activity proxies, and equipment replacement behavior, and then mapped into the covered equipment groups. After this, we cross-check results with selective bottom-up approximations, such as sampled dealer sell-through checks and ASP-by-unit calculations for a few high-volume categories, which helps us correct overstatement from one data series.
Key inputs used in the model include tractor and combine shipment direction, dealer inventory levels, farm income and cash receipts trends, interest rate and financing availability, planted area shifts for major crops, and equipment price inflation (and discounting) observed in the channel. Forecasts were prepared using scenario analysis supported by expert views, since the market is sensitive to weather-led income swings and credit conditions. Where bottom-up visibility is incomplete for smaller equipment lines, gaps are handled through ratio-based expansion from better-tracked categories, and then re-validated through interviews so the totals stay realistic.
Data Validation & Update Cycle
Outputs are validated by checking whether implied unit volumes and the price progression fit independent signals such as trade flows, farm income direction, and channel commentary. Any sharp jumps are investigated, and assumptions are revisited, followed by a second analyst review before numbers are signed off.
The report is refreshed annually, and interim updates are triggered when material events occur, such as major policy shifts, unusual financing moves, or rapid price changes in equipment. Right before delivery, a final pass is done to confirm the latest data points and ensure the model stays consistent across history and forecast.
Mordor Intelligence's North America Agricultural Machinery Market Size Measured Against Other Published Estimates
Different published market values for North America agricultural machinery can look far apart because the scope is not always consistent and the base year can shift between sources. In our checks, the spread usually comes from whether aftermarket parts and farm services are included, how irrigation and crop processing equipment are treated, and how pricing is projected during high inflation years.
Some estimates expand the definition to include aftermarket revenue, service and repair activity, and broader farm mechanization spend. For Mordor Intelligence, the market is counted as equipment value across tractors, equipment, irrigation machinery, harvesting machinery, haying and forage machinery, and other types, and then kept aligned to country-level demand signals across the region.
Benchmark comparison
| Source | Market Size | Gaps in Research Methodology |
|---|---|---|
| Mordor Intelligence | USD 57.50 B (2026) | |
| Regional Consultancy A | USD 38.52 B (2024) | Uses a farm mechanization framing that is narrower on equipment categories and may exclude parts of irrigation and forage equipment, and it also anchors the cycle to a different base year with a longer horizon. |
| Global Consultancy B | USD 67.06 B (2024) | Appears to apply a broader scope that can roll in aftermarket and a wider set of applications and channels, which can lift totals versus an equipment-only view, even when the geography is similar. |
The comparison shows that the largest swings usually come from what is counted as machinery spend and how pricing and timing are handled around the base year. By keeping the inputs traceable to equipment demand indicators and by validating ASP and replacement assumptions through primary checks, the final number stays easier to explain and repeat when users update the same variables later.
Key Questions Answered in the Report
How large is the North America agricultural machinery market in 2026?
North America agricultural machinery market is valued at USD 57.50 billion in 2026.
What is the anticipated CAGR for agricultural machinery demand in North America?
The North America agricultural machinery market is forecast to grow at a CAGR of 5.90% from 2026 to 2031.
Which equipment type commands the largest revenue share?
Tractors held the largest market share, at 47.3% in 2025, reflecting their versatility across agricultural operations.
Who are the leading OEMs in the region?
In 2025, Deere & Company, CNH Industrial N.V., AGCO Corporation, Kubota Corporation, and CLAAS KGaA mbH collectively control majority of the market.
How do USDA Climate-Smart grant influence equipment purchases?
Grants subsidize low-emission machinery, effectively lowering acquisition costs and accelerating adoption of electric or fuel-efficient models.