
Nordic Countries Renewable Energy Market Size and Share
Market Overview
| Study Period | 2021 - 2031 |
|---|---|
| Forecast Data Period | 2026 - 2031 |
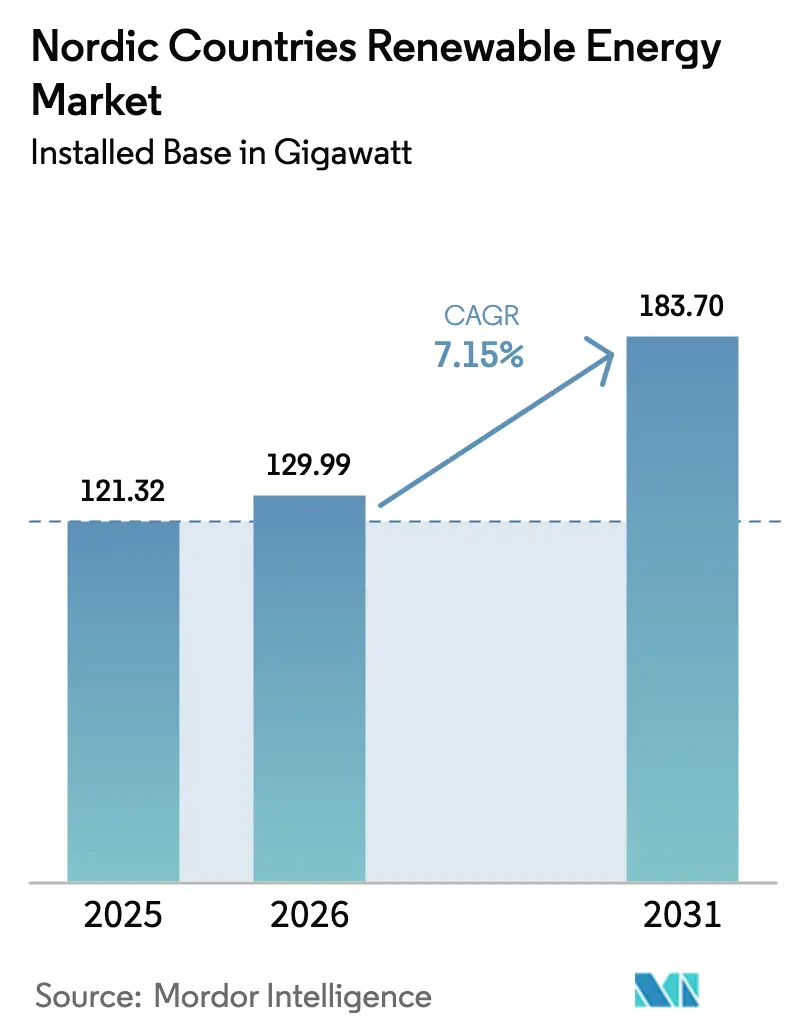
| Base Year Market Size (2025) | 121.32 gigawatt |
| Market Volume (2026) | 129.99 gigawatt |
| Market Volume (2031) | 183.7 gigawatt |
| Growth Rate (2026 - 2031) | 7.15 % |
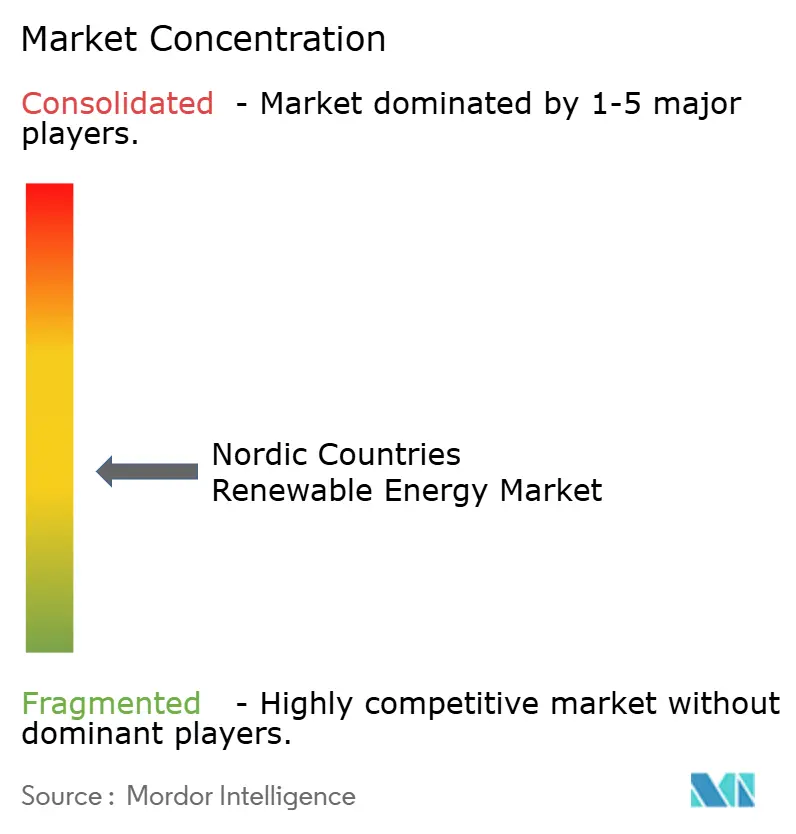
| Market Concentration | Medium |
Major Players *Disclaimer: Major Players sorted in no particular order Image © Mordor Intelligence. Reuse requires attribution under CC BY 4.0. | |
Nordic Countries Renewable Energy Market Analysis by Mordor Intelligence
The Nordic Countries Renewable Energy Market size was valued at 121.32 gigawatt in 2025 and estimated to grow from 129.99 gigawatt in 2026 to reach 183.7 gigawatt by 2031, at a CAGR of 7.15% during the forecast period (2026-2031).
Regional growth is driven by the combination of long-established hydropower assets, accelerated offshore wind deployment, and a rapidly developing green hydrogen value chain. Early achievement of the EU 2030 renewables target, renewables accounted for 49% of gross energy use in 2023, allowing Nordic stakeholders to monetize advanced grid-balancing services through dense cross-border interconnectors. Growing corporate demand for clean electricity, declining levelized costs for onshore wind and solar PV, and supportive carbon-pricing reforms further reinforce the upward trajectory of the Nordic countries' renewable energy market. Competitive intensity is moderate as traditional utilities defend market positions against specialist developers, while regulatory uncertainty in Norway introduces a degree of strategic risk.
Key Report Takeaways
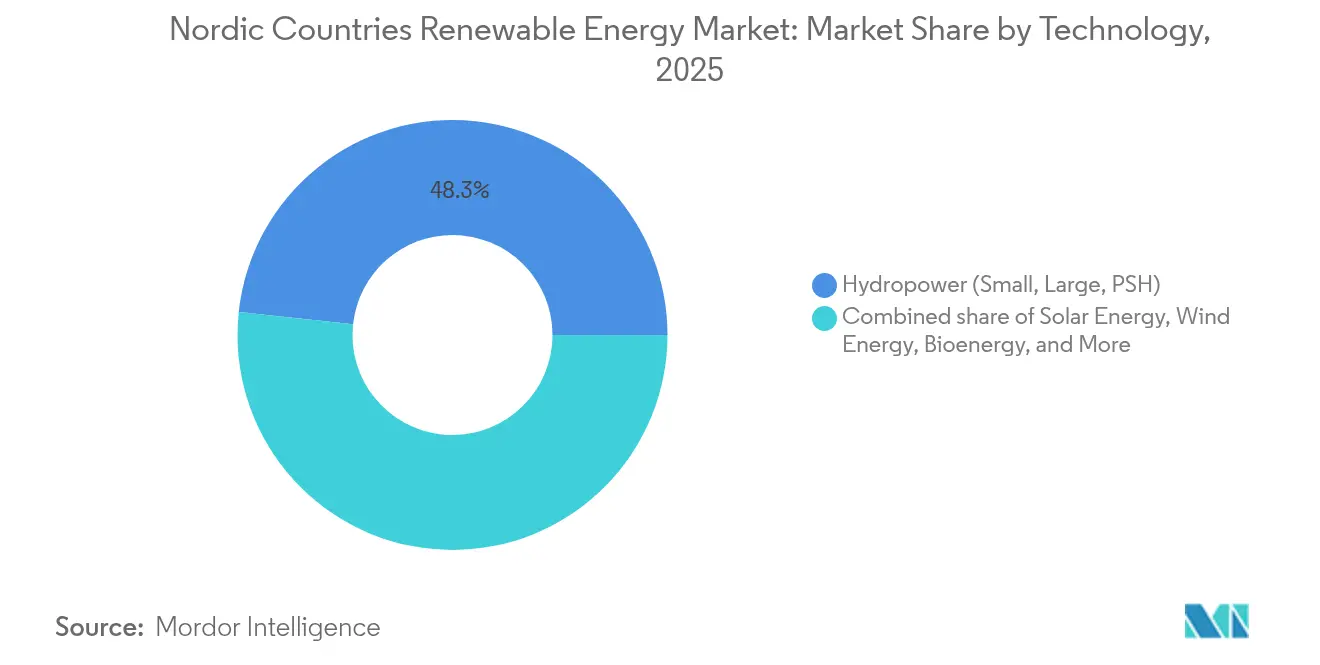
- By technology, hydropower led with 48.30% of the Nordic countries' renewable energy market share in 2025, whereas solar energy is advancing at a 18.24% CAGR through 2031.
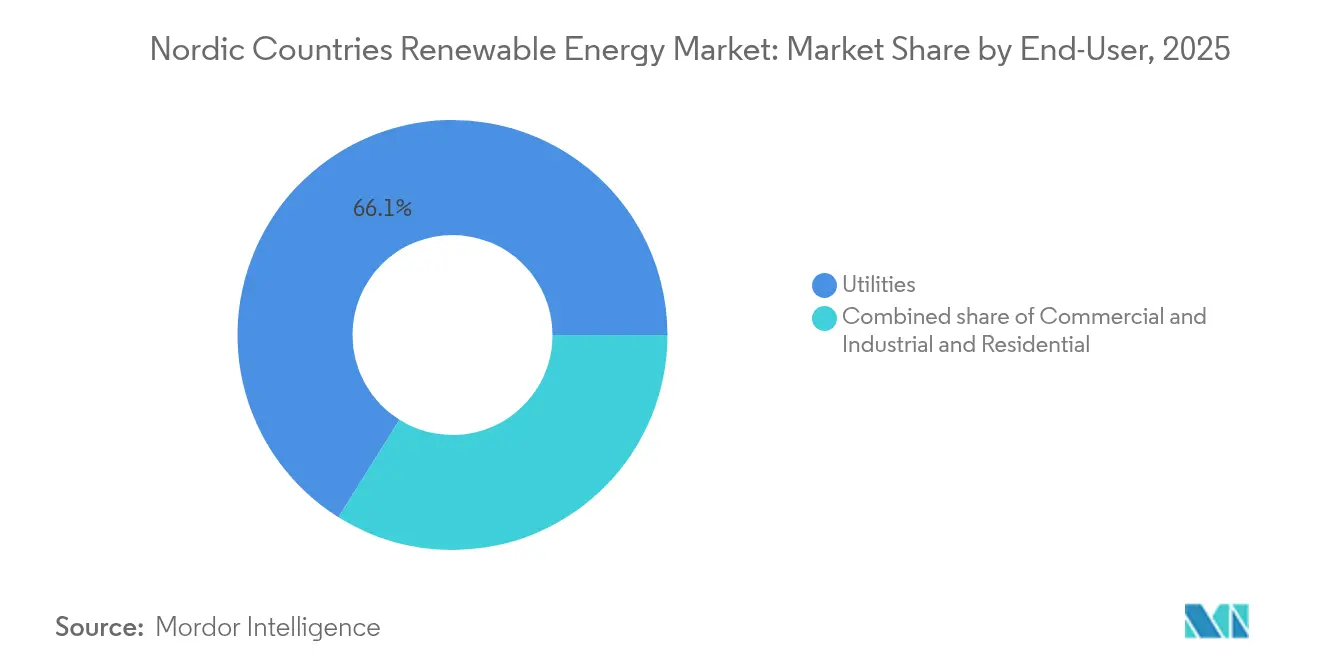
- By end-user, utilities controlled 66.10% of demand in 2025, while the commercial and industrial segment is forecast to expand at a 10.55% CAGR to 2031.
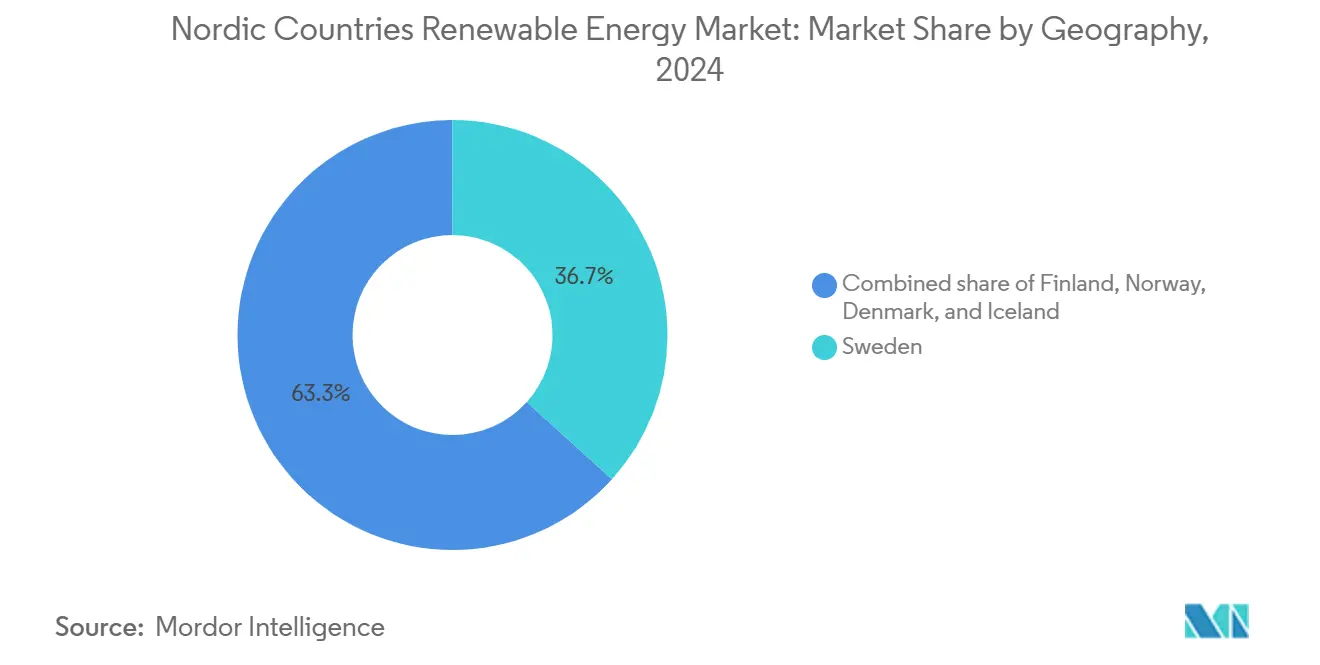
- By geography, Sweden commanded 36.20% of the capacity in 2025; Finland is expected to post the fastest growth rate of 11.95% through 2031.
Note: Market size and forecast figures in this report are generated using Mordor Intelligence’s proprietary estimation framework, updated with the latest available data and insights as of 2026.
Market Trends and Insights
Drivers Impact Analysis of Nordic Countries Renewable Energy Market*
| Driver | (~) % Impact on CAGR Forecast | Geographic Relevance | Impact Timeline |
|---|---|---|---|
| Rapid build-out of offshore wind hubs | 1.8% | Denmark, Norway, Sweden | Medium term (2-4 years) |
| EU Fit-for-55 targets accelerating PPAs | 1.2% | All Nordic countries (strongest in Sweden, Finland) | Short term (≤ 2 years) |
| Grid-balancing revenues from Nordic cross-border interconnectors | 0.9% | Norway, Denmark | Medium term (2-4 years) |
| Declining LCOE for onshore wind and solar PV | 1.5% | Sweden, Finland, Denmark | Long term (≥ 4 years) |
| Surge in green-hydrogen-linked offtake MOUs | 0.8% | Norway, Sweden | Long term (≥ 4 years) |
| Data-center waste-heat offtake contracts boosting bio-energy CHP | 0.5% | Finland, Sweden | Medium term (2-4 years) |
| Source: Mordor Intelligence | |||
Rapid Build-out of Offshore Wind Hubs
Denmark's North Sea Energy Island, designed to connect 10 GW of offshore capacity by 2030, exemplifies the region's shift toward hub-based development, which maximizes grid utilization and enables high-volume cross-border trading.[1] Complementary projects underway in Sweden and Finland form a continuous offshore wind corridor, leveraging economies of scale in turbine procurement and operations. Floating wind pilots in Norwegian deep waters further enlarge the resource base. Collective progress positions the Nordic countries' renewable energy market as a global proving ground for advanced offshore technologies, creating cost-reduction pathways that are not achievable through isolated projects.
EU Fit-for-55 Targets Accelerating PPAs
The Fit-for-55 package has shifted Nordic procurement dynamics from feed-in tariffs to corporate power purchase agreements, guaranteeing revenue certainty for generators and clean-energy credentials for buyers. Statkraft and regional utilities have structured multi-year PPAs that hedge against price volatility while meeting the countries' additionality rules, as embedded in EU policy.[2] Ambitious national solar strategies, such as Denmark's plan to quadruple capacity, dovetail with EU objectives to produce a sustained demand pull. This convergence maintains premium pricing for exports from the Nordic countries' renewable energy market.
Grid-Balancing Revenues from Nordic Cross-Border Interconnectors
Interconnectors, such as Viking Link (Denmark-UK) and NordLink (Norway-Germany), enable the flexible output of hydropower and wind to stabilize neighboring grids during demand peaks. The 2024 Nordic power market experienced over 200 hours of negative pricing due to a hydrological surplus, yet interconnector arbitrage enabled utilities to capture revenue in high-price adjacent markets. Such optimization enhances profitability and underscores the strategic importance of the Nordic renewable energy market in Europe's broader decarbonization efforts.
Declining LCOE for Onshore Wind & Solar PV
IRENA cost data confirm that onshore wind and solar PV reached grid parity across Nordic jurisdictions by 2024.[3] Larger rotor diameters, higher hub heights, and increasing panel efficiency secure capacity factors that rival those of legacy baseload assets. Merchant renewables have become bankable, fostering a self-reinforcing cycle of investment within the Nordic countries' renewable energy market. Cost competitiveness also unlocks adjacent avenues such as biogas and hybrid projects, broadening the market's technology mix.
Restraints Impact Analysis of Nordic Countries Renewable Energy Market*
| Restraint | (~) % Impact on CAGR Forecast | Geographic Relevance | Impact Timeline |
|---|---|---|---|
| Limited transmission capacity in northern Scandinavia | –0.7% | Norrbotten, Finnmark | Medium term (2-4 years) |
| Lengthy environmental permitting for new wind parks | –0.5% | Norway, Sweden | Short term (≤ 2 years) |
| Turbine-blade recycling bottlenecks | –0.3% | All Nordic, acute in Denmark and Sweden | Long term (≥ 4 years) |
| Volatility in Swedish green certificate prices post-2025 | –0.4% | Sweden | Short term (≤ 2 years) |
| Source: Mordor Intelligence | |||
Limited Transmission Capacity in Northern Scandinavia
Resource-rich northern Scandinavia lacks sufficient high-voltage lines to deliver growing wind and hydropower output to southern demand centers. Curtailment risk erodes project economics and dampens investor confidence. Norway's pledge to invest NOK 400 million (USD 37 million) in the Kaggefoss upgrade signals recognition of the infrastructure gap.[4] Yet large-scale reinforcement projects demand multi-year planning, so the constraint will continue to temper the Nordic countries' renewable energy market expansion over the long term.
Lengthy Environmental Permitting for New Wind Parks
Comprehensive impact assessments, stakeholder consultations, and legal appeals lengthen approval cycles to three to five years in Sweden and Norway. Smaller developers find it difficult to carry financing costs throughout the extended timeline, concentrating projects in the hands of capital-rich incumbents. The recent clearance of Denmark's Jammerland Bugt and Lillebaelt Syd farms demonstrates that streamlining is possible, but only after protracted review phases. Until permitting reforms gain traction, this bottleneck will act as a drag on the Nordic countries' renewable energy market.
*Our forecasts treat driver/restraint impacts as directional, not additive. The impact forecasts reflect baseline growth, mix effects, and variable interactions.
Nordic Countries Renewable Energy Market Segment Analysis
By Technology:
Hydropower Anchors, Solar SurgesHydropower retained 48.30% of 2025 capacity and commanded ancillary-services income of EUR 1.2 billion, illustrating its foundational role in the Nordic countries' renewable energy market share. However, solar is expanding at 18.24% CAGR, the fastest among technologies, because bifacial modules and trackers improve yields in snow-covered southern Sweden and Denmark. Offshore wind clusters in Danish and Norwegian waters account for most new capacity, aided by energy-island concepts that aggregate exports via HVDC cables. Pumped-storage feasibility studies using abandoned mines may unlock eight-hour storage, yet capital intensity and decade-long build timelines stall near-term decisions. Geothermal beyond Iceland remains niche, but Sweden's 3 MW Västerås pilot confirmed technical viability in crystalline bedrock, hinting at long-term diversification.
Bioenergy's role is shifting from baseload to mid-merit. Fortum retrofitted 12 plants in 2024 to ramp 40% faster, and data-center waste-heat capture trims feedstock costs. Ocean energy trials in Norway reached only 1.5 MW amid grid-connection expenses topping EUR 4 million/MW. Overall, hydropower will continue to anchor flexibility, but multi-technology hybrids and solar outperformance will propel the Nordic countries' renewable energy market size over the forecast period.

By End-User:
Utilities Dominate, Industrials AccelerateUtilities owned 66.10% of 2025 capacity through long-term hydropower concessions and offshore-wind seabed leases, underscoring their scale advantages in the Nordic countries' renewable energy market. Nevertheless, commercial and industrial demand is forecast to rise 10.55% annually, outpacing utility growth. SSAB's 1.2 GW PPA with Vattenfall to power hydrogen-based steel represents the largest single industrial offtake to date. Hyperscale data centers executed 2.4 GW of PPAs in 2024, lured by sub-EUR 35/MWh prices and free-cooling economics. Aluminum smelters in Norway and Iceland are adding load-flex technologies that monetize balancing services, boosting returns without sacrificing metal quality. Residential solar uptake stays muted under wholesale-only net-metering, but battery prices below EUR 150/kWh after 2027 could unlock rooftop growth.
Geography Analysis
Sweden Countries Renewable Energy Market
Sweden retained 36.20% of total capacity in 2025, drawing on robust hydropower and steady onshore wind additions. Cross-border cables enable the export of surplus generation, and planned offshore projects will further increase variable output. Despite some wind farms operating at a loss during 2024, falling capital expenditures and more accurate forecasting are improving margins. The nation’s untapped geothermal potential could introduce a fresh dispatchable option.
Finland Countries Renewable Energy Market
Finland posts the strongest 11.95% CAGR outlook to 2031. The Nurmo liquefied biogas plant confirms diversification beyond hydro and wind, while North’s data center cluster utilizes waste heat for district heating, creating a stacked revenue stream. Strategic interconnectors with the Baltic position Finland as a renewable export bridge into continental Europe.
Europe Countries Renewable Energy Market
Denmark continues to lead in technology export and offshore wind know-how. A 2025 reform increased CO₂ taxes on fossil fuels by over 400%, tilting the economics decisively in favor of renewables. Norway’s deep hydropower reserve provides Europe’s key balancing resource; however, political turbulence following the 2025 coalition collapse clouds long-term project certainty. Iceland’s geothermal innovation pipeline, spearheaded by direct magma drilling, can reshape global high-enthalpy markets.
Regulatory Landscape
The Nordic renewable energy framework is shaped by EU-wide climate and energy rules, alongside national permitting, grid-access, and market-design measures. EU Member States implemented RED III by 1 May 2025, reinforcing faster renewable buildout pathways, while Denmark specified licensing process rules through regulation no. 773 dated 20 June 2024. Corporate procurement is also tied to EU Fit-for-55-driven decarbonization requirements, supporting the region's shift away from legacy subsidy schemes toward PPAs and market-based revenue structures.
National rules continue to influence project bankability and development timelines. Norway introduced regulatory changes effective 1 January 2025 that prioritize grid access for mature projects amid capacity constraints, which affects how new wind and grid-connected assets move through the queue. Finland advanced institutional reform through a partial Electricity Market Act reform, and from 1 January 2026 it combined regional environmental permitting and supervisory authorities into a new national Finnish Supervisory Agency, changing how developers engage with permitting and oversight. Nordic Energy Research has also pointed to non-technical barriers such as Sweden's municipal veto risk and defense-related constraints in Sweden and Finland, which remain central considerations for wind permitting and site selection.
Competitive Landscape
The Nordic countries' renewable energy market features a moderate concentration with dominant incumbents counterbalanced by agile specialists. Ørsted, Vattenfall, and Statkraft leverage multi-technology portfolios and established grid access. Their strategies include upgrading existing hydropower, integrating AI for geothermal optimization, and exploring hybrid offshore concepts, such as wave-wind arrays. Vertical integration into green hydrogen is gaining traction, exemplified by Ørsted's bid to co-locate electrolysers at offshore hubs.
Private equity inflows accelerate consolidation. Nordic Capital's rise to lead shareholder status in Soltech demonstrates financial players' appetite for scalable solar platforms. Asset sweeps by Renewable Power Capital and VINCI signal the pursuit of larger project pipelines to capture economies of scale. Meanwhile, technology-led entrants focus on turbine recycling, floating foundations, and long-duration storage, seeking niches where incumbents hold less advantage.
Government-backed entities, such as Norges Bank Investment Management, co-invest with corporates like RWE, reflecting an increasing sovereign interest in stable renewable returns. Market participants who master integrated solutions—combining generation, flexibility services, and sector-coupled products—are best placed to thrive as the Nordic countries' renewable energy market moves toward cross-sector decarbonization.
Nordic Countries Renewable Energy Industry Leaders
-
Vattenfall AB
-
Fortum Oyj
-
Ørsted A/S
-
Statkraft AS
-
Equinor ASA
- *Disclaimer: Major Players sorted in no particular order
Nordic Countries Renewable Energy Market Companies Covered in this Report
- Ørsted A/S
- Vattenfall AB
- Statkraft AS
- Fortum Oyj
- Equinor ASA
- Siemens Gamesa Renewable Energy SA
- GE Vernova
- RES Group
- Scatec ASA
- Svea Renewable Solar AB
- Axpo Holding AG
- InnoVentum AB
- Swedish Biofuels AB
- Nordic Solar A/S
- Ilmatar Energy Oy
- Fred. Olsen Renewables
- OX2 AB
- St1 Nordic Oy
- Wärtsilä Oyj (renewables & hybrid)
- Hitachi Energy Ltd
Read Analysis of Nordic Countries Renewable Energy Companies
Market Opportunities and Future Outlook
Offshore wind tendering and market-based contracting provide a direct route for new capacity and supporting services across the Nordics. Denmark's plan for new CfD rounds for offshore wind allocates 3 GW for auction from late 2025. Cross-border interconnector operations already support arbitrage and balancing in the region, which increases demand for grid-support technologies such as storage, digital forecasting, and flexible hydropower operations that reduce curtailment and support ancillary-service revenues. There is also clear whitespace in hybridization and co-location, where developers can pair wind with solar and batteries to manage negative price hours and congestion in parts of the region.
Capital allocation points to sustained build activity and room for suppliers, EPCs, and developers with permitting and grid-integration capabilities. Vattenfall's 2026-2030 investment plan totals SEK 165 billion, with 56% directed to growth investments including new wind and grids. Ørsted guides 2026 gross investments of DKK 50-55 billion, and Statkraft has outlined annual investments of NOK 16-20 billion with 51 BNOK of net committed investments for 2026-2030. Sector coupling adds another set of opportunities through hydrogen valleys and industrial offtake structures, including the NORHyWAY project in Mid-Norway (2026-2031) targeting 37,081 tonnes per year of green hydrogen by 2030, Sweden's HiWHyV aiming at 4,000 tonnes per year by 2030, and Denmark's CONVEY project in Hirtshals Port targeting 550 tonnes per year. Together, these initiatives widen the addressable market for renewable power supply, grid connections, and long-term contracting models that link generation to industrial decarbonization demand.
Recent Industry Developments in Nordic Countries Renewable Energy Market
- July 2026: Vattenfall - Installed the first monopile for the 980 MW Nordlicht I offshore wind farm in the German North Sea, marking the commencement of the offshore construction phase for the Nordlicht cluster. This development expands Vattenfall's offshore capacity and supports Nordic offshore wind execution in core European markets.
- June 2026: Statkraft - Signed a seven-year power purchase agreement with Elkem ASA for the supply of 1,534 GWh of electricity to the Bjølvefossen plant in Norway for the 2031-2037 period. The deal secures stable demand and supports continued operation of a major industrial facility, reinforcing Statkraft's role as a long-term energy provider in the Nordic region.
- June 2026: Vattenfall - Inaugurated the Bruzaholm hybrid park in southern Sweden, featuring 139 MW of wind capacity paired with 38 MW / 38 MWh of battery storage. The capacity addition supports grid flexibility and highlights utility-scale integration of hybrid energy assets within the Nordic market.
Nordic Countries Renewable Energy Market Report Scope and Research Methodology
Market Definition and Coverage
For this report, the market refers to renewable electricity generation capacity installed across the Nordic countries, tracked as total installed capacity (GW) across major renewable technologies and end users.
Scope exclusions: We exclude fossil-based power capacity, nuclear capacity, and upstream fuel commodity markets that are not directly tied to renewable power generation assets.
Segments Covered in This Report
- By Technology
- Solar Energy (PV and CSP)
- Wind Energy (Onshore and Offshore)
- Hydropower (Small, Large, PSH)
- Bioenergy
- Geothermal
- Ocean Energy (Tidal and Wave)
- By End-User
- Utilities
- Commercial and Industrial
- Residential
- By Geography
- Norway
- Sweden
- Denmark
- Finland
- Iceland
Data Sources, Market Sizing, and Validation
Desk Research
Desk research was used to build a clean fact base for installed capacity, annual additions, and policy timelines across Denmark, Finland, Iceland, Norway, and Sweden. We relied on public energy statistics and grid level signals, including the International Energy Agency, IRENA, Eurostat, European Commission energy datasets, and inputs from national transmission system operators and energy agencies.
To connect these facts into a sizing model, we also reviewed company annual reports and investor presentations, national auction and permitting releases, and reputable press coverage of major commissioning events. Where needed, we used paid subscriptions for company financial intelligence, patent lookups, and import or export shipment level checks for selected equipment categories. The sources listed above are illustrative only, and additional public documents and databases were referenced to collect, cross-check, and clarify inputs.
Primary Interviews and Surveys
Interviews and surveys with developers, utilities, equipment suppliers, advisers, and energy users in Europe help clarify capacity additions, project timing, pricing, and policy effects across the five Nordic markets. Respondents also help resolve missing country detail and test assumptions where secondary data differs before final analysis.
Distribution of primary research fieldwork respondents
| Company type | Respondent position |
|---|---|
| Top tier: 30% | CXOs: 20% |
| Mid tier: 45% | Functional/Unit leaders: 30% |
| Smaller Players: 25% | Managers: 50% |
Market-Sizing & Forecasting
Sizing starts with a top-down reconstruction of installed renewable capacity by country, where national capacity registers, grid updates, and official energy statistics are consolidated into a single time series. Once country totals were aligned, the split by technology was derived using reported technology mixes and commissioning schedules, then carried into end user allocation using utility versus behind-the-meter signals.
To keep the model practical, we treated a few inputs as key drivers, including annual capacity additions (GW), project pipeline maturity (permitted, under construction, and planned), observed curtailment and grid connection constraints, and auction or support-scheme timelines that affect commissioning speed. Hydro refurbishments and life extensions were also tracked because they can change capacity even when new builds slow down. Forecasting used scenario analysis supported by time series smoothing on historical additions, then adjusted with expert expectations on bottlenecks such as interconnection queues and supply lead times. We ran selective bottom-up checks by sampling major project announcements and testing whether implied annual additions match recent build rates, and where gaps appeared we applied conservative commissioning probability factors by project stage.
Data Validation & Update Cycle
Outputs were validated through multiple checks, starting with reconciling country totals to independent public datasets and then reviewing variance at the technology level to spot step changes that needed explanation. When a number moved outside a reasonable range, we re-checked assumptions such as commissioning dates, de-ratings, and re-powering treatment, and then revisited the related desk sources before sign-off.
A multi-step internal review is used so definitions stay consistent across countries and years, and so forecast logic remains explainable and repeatable. Reports are refreshed annually, with interim updates when material events occur, such as policy shifts, major project cancellations, or large capacity additions being commissioned earlier than expected. Before delivery, a final analyst pass is completed to incorporate the latest public releases and interview feedback.
Mordor Intelligence's Nordic Countries Renewable Energy Market Size Versus Other Published Estimates
Published estimates for this market can look far apart because the word "market" is not always treated consistently, and because some sources switch between capacity, generation, and spending without clearly stating which metric they are using. Differences also show up when country coverage changes, or when pipelines are treated as installed even if grid connection is not complete.
By tracking grid-connected installed capacity and refreshing country-level commissioning assumptions, Mordor Intelligence keeps the total tied to what is operational in the Nordics (Denmark, Finland, Iceland, Norway, and Sweden), rather than mixing in investment revenue or non-commissioned pipeline volumes.
Benchmark comparison
| Source | Market Size | Gaps in Research Methodology |
|---|---|---|
| Mordor Intelligence | USD 121.32 B (2025) | |
| Regional Consultancy A | USD 120.02 B (2024) | Uses a revenue-based definition that can bundle equipment sales, EPC, and services, which makes it hard to reconcile to installed capacity changes year by year, and it also uses a longer forecast window that can amplify assumed growth. |
| Trade Journal B | USD 78.40 B (2026) | Covers a broader Northern Europe scope and reports a forward-year value, which can understate the Nordics-only installed base when compared to a base-year capacity estimate, and it is sensitive to currency timing and price assumptions. |
The comparison shows that the spread is mainly created by unit choice (capacity versus spending), geography boundaries, and how strictly installation is defined. Our approach stays repeatable because the total is built from country capacity series, then cross-checked with commissioning news and expert feedback before the forecast is finalized.
Key Questions Answered in the Report
How large is the Nordic countries renewable energy market in 2026?
It stands at 129.99 GW of installed capacity and is projected to reach 183.7 GW by 2031.
What CAGR is expected for Nordic renewable capacity between 2026 and 2031?
The forecast CAGR is 7.15% over the 2026-2031 period.
Which technology is growing fastest in the Nordics?
Solar photovoltaics lead with a projected 18.24% CAGR to 2031.
Why are corporate PPAs booming in the region?
The EU Fit-for-55 package, low wind and solar LCOEs, and carbon-border-adjustment risks are driving industrial buyers to lock in green electricity.
Which Nordic country will grow capacity quickest to 2031?
Finland, supported by CfD auctions and newly upgraded 400 kV transmission lines, is forecast to expand at 11.95% CAGR.
How concentrated is competitiveness among utilities?
Five vertically integrated utilities control about 60% of the pipeline, yielding a moderate concentration score of 6.