
Non-alcoholic Steatohepatitis Therapeutics And Diagnostics Market Size and Share
Market Overview
| Study Period | 2020 - 2031 |
|---|---|
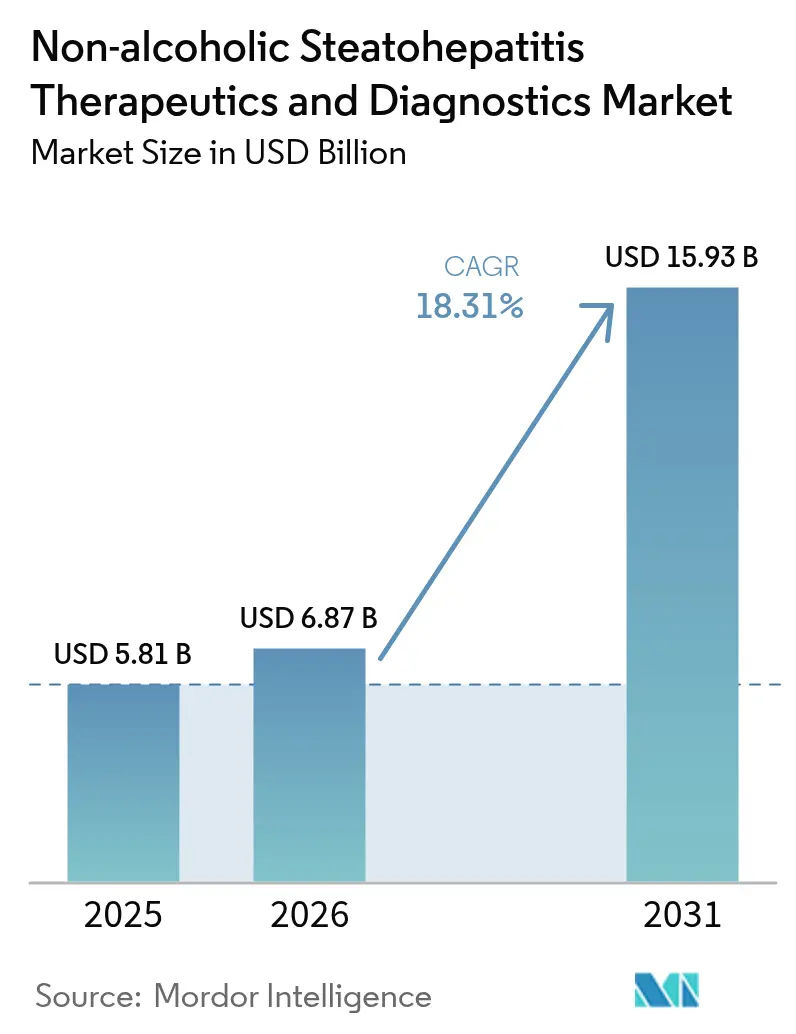
| Market Size (2026) | USD 6.87 Billion |
| Market Size (2031) | USD 15.93 Billion |
| Growth Rate (2026 - 2031) | 18.31 % |
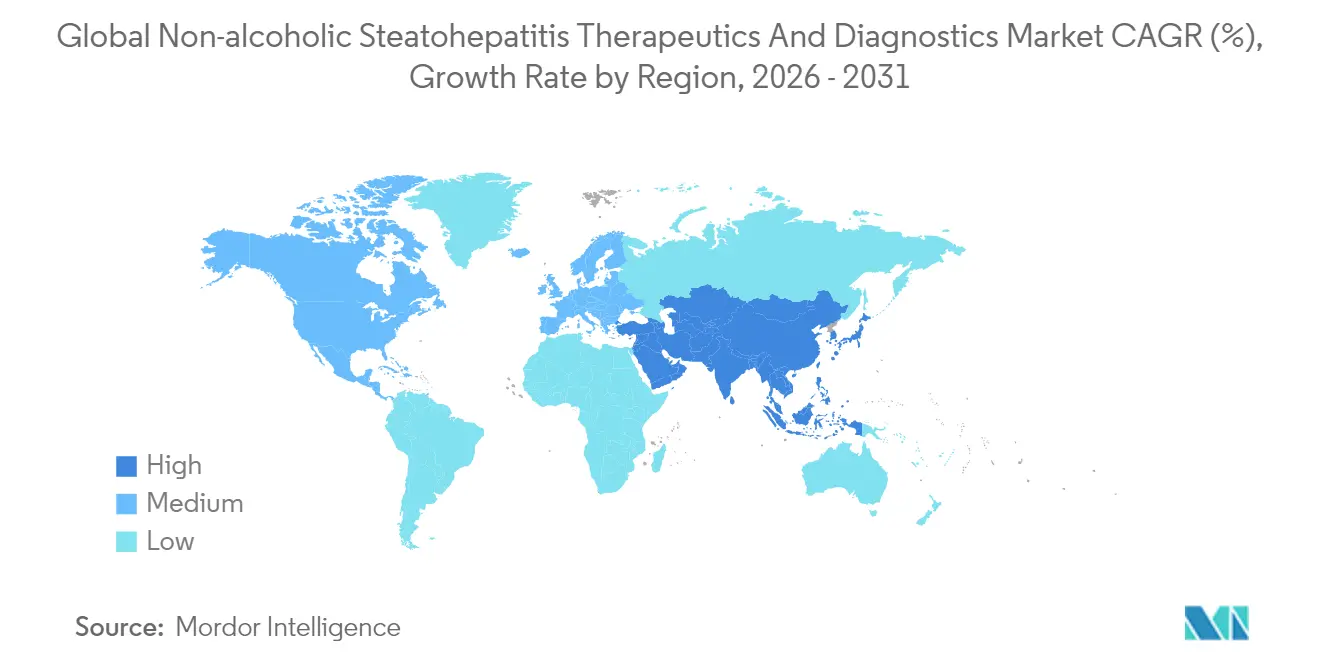
| Fastest Growing Market | Asia-Pacific |
| Largest Market | North America |
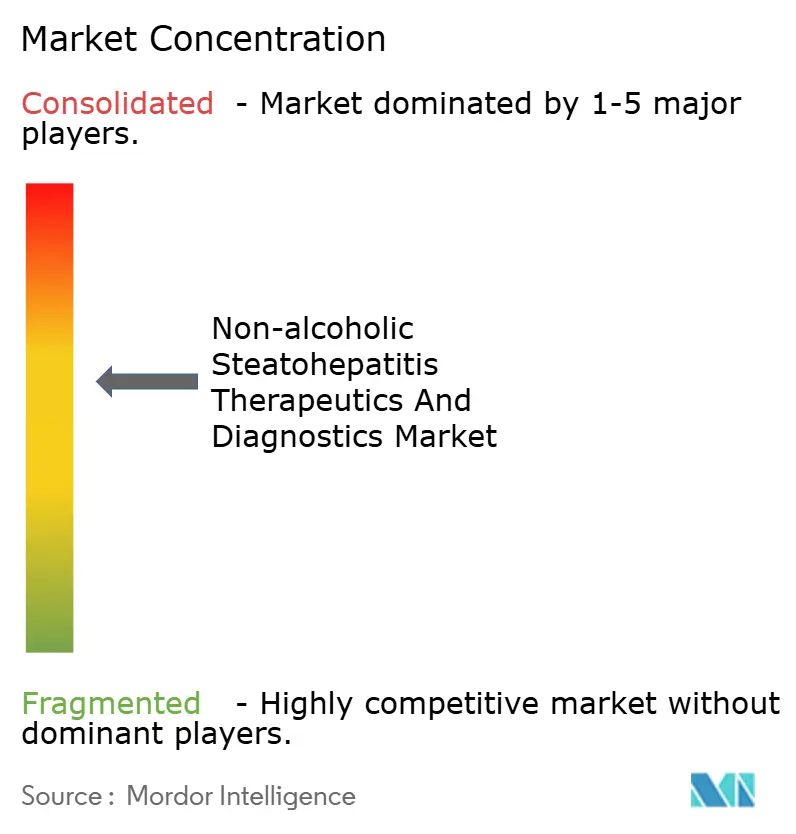
| Market Concentration | Medium |
Major Players *Disclaimer: Major Players sorted in no particular order Image © Mordor Intelligence. Reuse requires attribution under CC BY 4.0. | |
Non-alcoholic Steatohepatitis Therapeutics And Diagnostics Market Analysis by Mordor Intelligence
The Nonalcoholic Steatohepatitis therapeutics and diagnostics market size is expected to grow from USD 5.81 billion in 2025 to USD 6.87 billion in 2026 and is forecast to reach USD 15.93 billion by 2031 at 18.31% CAGR over 2026-2031. Escalating global prevalence of metabolic syndrome, the March 2024 FDA approval of resmetirom, and payer support for non-invasive testing collectively reposition the Nonalcoholic Steatohepatitis therapeutics and diagnostics market for sustained double-digit growth. Diagnostic solutions currently dominate revenues, yet the therapeutics pipeline is converting into commercial launches at a record pace, tilting future value creation toward treatment-centred models. Hospital demand remains robust, but specialized diagnostic centers are scaling rapidly on the back of AI-enabled workflows. Competitive intensity is heightened by fast-track drug designations, strategic licensing in Asia, and the race to integrate blood-based biomarkers into routine care pathways.
Key Report Takeaways
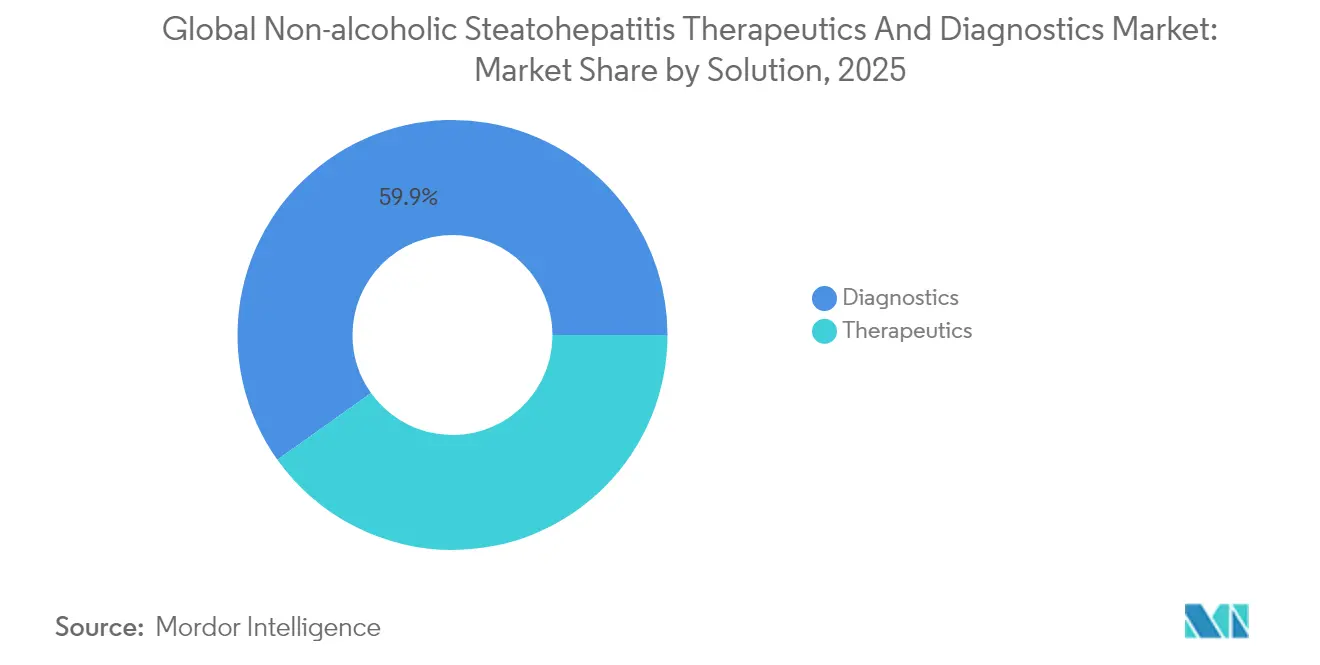
- By solution, diagnostics held 59.85% of the Nonalcoholic Steatohepatitis therapeutics and diagnostics market share in 2025, while therapeutics are advancing at a 19.11% CAGR to 2031.
- By end user, hospitals and clinics accounted for 44.52% of the Nonalcoholic Steatohepatitis therapeutics and diagnostics market size in 2025; diagnostic centers post the fastest growth at an 18.42% CAGR through 2031.
- By geography, North America led with 36.78% revenue share in 2025; Asia-Pacific is forecast to expand at a 18.67% CAGR to 2031.
Note: Market size and forecast figures in this report are generated using Mordor Intelligence’s proprietary estimation framework, updated with the latest available data and insights as of 2026.
Market Trends and Insights
Drivers Impact Analysis of Non-alcoholic Steatohepatitis Therapeutics And Diagnostics Market*
| Driver | (~) % Impact on CAGR Forecast | Geographic Relevance | Impact Timeline |
|---|---|---|---|
| Rising prevalence of obesity & metabolic syndrome | +4.2% | Global, with highest impact in North America & Asia-Pacific | Long term (≥ 4 years) |
| Advancement in non-invasive diagnostic technologies | +3.8% | Global, early adoption in North America & Europe | Medium term (2-4 years) |
| Accelerated clinical trials & fast-track designations | +3.1% | North America & Europe, expanding to Asia-Pacific | Short term (≤ 2 years) |
| Payer willingness to reimburse biomarker tests | +2.9% | North America & Europe | Medium term (2-4 years) |
| Combination-therapy pipeline expansion | +2.4% | Global | Medium term (2-4 years) |
| AI-enabled imaging partnerships with liver clinics | +1.8% | North America & Europe, selective Asia-Pacific markets | Short term (≤ 2 years) |
| Source: Mordor Intelligence | |||
Rising Prevalence of Obesity & Metabolic Syndrome
Obesity and metabolic dysfunction now affect close to one-third of the global population, creating an expanding clinical pool for MASLD and, by progression, nonalcoholic steatohepatitis. The demographic tilt toward younger cohorts accelerates fibrosis at earlier ages and stretches lifetime treatment windows. Latin America illustrates the trend as prevalence nears 24%, driving payer interest in community-level screening programs. U.S. projections indicate 27 million affected adults by 2030, a 63% jump versus 2015, redefining transplant-planning models and stimulating commercial urgency. Governments and professional societies respond by integrating fibrosis scores into primary-care check-ups, further enlarging addressable volumes for both diagnostics and therapeutics.
Advancement in Non-Invasive Diagnostic Technologies
Market momentum pivots around rapid adoption of blood-based panels and elastography that replace invasive liver biopsy. Roche’s Elecsys PRO-C3 returns fibrosis staging in 18 minutes, enabling same-visit clinical decisions and widening provider acceptance. AI algorithms now mine electronic health records to flag undiagnosed MASLD with 83% accuracy, adding scale without incremental imaging capacity. FibroScan, ELF, and FIB-4 scores are embedded in new treatment guidelines across the U.S. and Europe, prompting laboratories to upgrade equipment portfolios. Earlier detection increases therapeutic eligibility pools and underpins value-based reimbursement arguments that emphasize avoided transplant costs.
Payer Willingness to Reimburse Biomarker Tests
Commercial insurers increasingly reimburse ELF and NIS4 panels once linked to reduced downstream expenditures. Labcorp’s NASHnext™ secured broad coverage in early 2024, signalling payer readiness to reward diagnostics that avert high-cost cirrhosis care. Medicare’s 2025 National Coverage Determination for non-invasive fibrosis testing further normalizes reimbursement pathways. Europe follows with country-level health technology assessments validating clinical utility. The resulting financial clarity encourages diagnostic-centric startups to scale distribution and accelerates hospital procurement of elastography devices.
Combination-Therapy Pipeline Expansion
Clinical rationale for multi-target regimens strengthens as monotherapies struggle to deliver dual endpoints of fibrosis improvement and NASH resolution. Novo Nordisk’s GLP-1 plus FXR agonist research and Gilead’s paired FGF21 analogue strategy widen therapeutic possibilities without requiring de-novo modes of action. Combination paradigms appeal to regulators when mechanistic synergy addresses heterogeneity in disease pathways, motivating collaborative trials and intellectual-property cross-licensing. Successful proof-of-concept data would expand addressable market value by enabling tailored regimens across fibrosis stages.
Restraints Impact Analysis of Non-alcoholic Steatohepatitis Therapeutics And Diagnostics Market*
| Restraint | (~) % Impact on CAGR Forecast | Geographic Relevance | Impact Timeline |
|---|---|---|---|
| High late-stage drug-trial failure rate | -2.8% | Global, particularly impacting North America & Europe | Medium term (2-4 years) |
| Uncertain reimbursement for novel diagnostics | -2.1% | Global, with highest impact in emerging markets | Short term (≤ 2 years) |
| Limited patient awareness & under-diagnosis | -1.9% | Global, most pronounced in Asia-Pacific & emerging markets | Long term (≥ 4 years) |
| Stringent histological endpoint requirements | -1.6% | North America & Europe, regulatory-driven impact | Medium term (2-4 years) |
| Source: Mordor Intelligence | |||
High Late-Stage Drug-Trial Failure Rate
Historical attrition has eroded investor sentiment each time a promising candidate underperformed in Phase 2b or Phase 3. Akero’s efruxifermin missed key fibrosis endpoints with response rates of 18–29% versus 13% placebo, reviving concerns over surrogate markers versus hard histological outcomes. Companies react by tightening inclusion criteria, but smaller sample sizes raise statistical-power questions that regulators scrutinize. The cyclical pattern of hype and disappointment elongates development timelines, tempers deal valuations, and moderates the Nonalcoholic Steatohepatitis therapeutics and diagnostics market growth curve despite headline breakthroughs.
Uncertain Reimbursement for Novel Diagnostics
Emerging AI and multi-omic panels confront fragmented payer frameworks, especially in Latin America and parts of Asia where public budgets prioritize primary care. Health technology assessment agencies demand longitudinal outcome data, lengthening approval cycles beyond what venture-backed diagnostic firms can often fund. Europe’s differential acceptance benches novel panels against well-established FIB-4 or FibroScan, forcing companies to conduct added head-to-head studies. Until consistent coverage materializes, adoption curves in cost-sensitive regions remain shallow, partially offsetting growth elsewhere.
*Our forecasts treat driver/restraint impacts as directional, not additive. The impact forecasts reflect baseline growth, mix effects, and variable interactions.
Non-alcoholic Steatohepatitis Therapeutics And Diagnostics Market Segment Analysis
By Solution:
Therapeutics Drive Future Growth Despite Diagnostic DominanceDiagnostics retained 59.85% revenue share in 2025 on the strength of widespread use of elastography and blood-based panels across primary and secondary care sites. Nevertheless, therapeutics exhibit the fastest momentum, expanding at a 19.11% CAGR, powered initially by resmetirom’s launch. Within the solution stack, imaging tests and biomarker assays continue to diversify, while biopsy volumes contract as clinicians shift to guideline-endorsed non-invasive monitoring. Resmetirom generated USD 137 million in Q1 2025 alone, proving willingness to pay even at an annual USD 47,400 price point. Pipeline depth in GLP-1, THR-β, and FGF21 classes suggests sustained innovation cycles that can progressively narrow fibrosis progression rates.
Expanded therapeutic access is expected to rebalance spending patterns such that therapeutics account for the larger share of the nonalcoholic Steatohepatitis therapeutics and diagnostics market size by late-decade. The current gap between diagnosis and treatment adoption generates pent-up demand suited to first-in-class entrants. Diagnostics still accrue steady transactional revenue from repeat fibrosis monitoring; however, growth rates taper as market saturation rises in high-income countries. Technology suppliers pivot to value-added analytics and longitudinal patient-management platforms to protect margins. Multimodal diagnostic algorithms that integrate imaging, serum biomarkers, and electronic health record data differentiate service offerings and lock-in provider relationships.

By End User:
Diagnostic Centers Emerge as Growth LeadersHospitals and clinics generated 44.52% of Nonalcoholic Steatohepatitis therapeutics and diagnostics market revenue in 2025, reflecting entrenched referral pathways and bundled billing practices. Yet diagnostic centers are tracking an 18.42% CAGR, outpacing all other settings as patients gravitate toward convenience and shorter appointment backlogs. Urban Asia-Pacific illustrates the shift, where standalone imaging chains add dedicated liver units supported by AI-enabled interpretation and cloud-based reporting. Academic institutes continue to shape clinical guidelines and attract early-stage trials, making them critical gatekeepers for technology validation.
Integration between diagnostic centers and hepatology specialists accelerates care coordination, leading to higher therapy conversion rates. Telehealth follow-up, remote FibroScan vans, and mobile phlebotomy further erode hospital dominance for routine monitoring. For providers, profitability hinges on high throughput and pay-for-performance contracts that reward early disease interception.
Geography Analysis
North America Non-alcoholic Steatohepatitis Therapeutics and Diagnostics Market
North America retained its 36.78% revenue lead in 2025, underpinned by early regulatory approvals, broad insurance coverage, and high obesity prevalence. U.S. hepatologists rapidly incorporated resmetirom into practice after March 2024 approval, elevating prescription volumes even before full guideline integration. Canada mirrors trends on a smaller scale, benefitting from centralized health-technology assessments that green-light non-invasive diagnostics for provincial coverage. The region’s innovation ecosystem, anchored by Boston and San Diego biotech clusters, ensures a continual influx of trial candidates and venture capital, reinforcing first-mover advantages in therapeutics and AI-powered diagnostics.
Europe Non-alcoholic Steatohepatitis Therapeutics and Diagnostics Market
Europe contributes steady, mid-teen revenue shares with Germany, the United Kingdom, and France accounting for the bulk of uptake. EMA approval of resmetirom, anticipated mid-2025, will unlock pent-up demand. National reimbursement agencies are already modeling budget impacts, suggesting quicker formulary listings than seen with earlier metabolic drugs. Non-invasive diagnostic penetration is mature, yet opportunities remain in integrating AI-triaged imaging into regional liver networks to tackle workforce shortages. Parallel import regulations may exert mild downward pressure on launch prices, but volume growth is expected to compensate.
APAC Non-alcoholic Steatohepatitis Therapeutics and Diagnostics Market
Asia-Pacific is the fastest-growing theatre, set to surge at a 18.67% CAGR as diabetes and obesity climb across China, India, and Southeast Asia. Multinational companies localize clinical trials to satisfy diverse ethnic profiles and streamline China’s National Medical Products Administration approvals. Madrigal’s July 2025 USD 2 billion licensing pact with CSPC exemplifies route-to-market strategies that combine local manufacturing with multinational science. Government prevention programs and growing middle-class awareness enlarge screening volumes for fibrosis tests. Australia and South Korea, with advanced reimbursement systems, act as gateway markets for new diagnostics before broader regional rollout.
MEA and South America Non-alcoholic Steatohepatitis Therapeutics and Diagnostics Market
South America and the Middle East & Africa collectively represent nascent but rising prospects. Brazil’s public-private hospital model experiments with capitated payments that reward early fibrosis detection. GCC nations invest in specialty liver centers, leveraging high per-capita health spending to adopt latest diagnostics. However, reimbursement fragmentation and workforce imbalances temper near-term gains, keeping their combined share in single digits through 2031.
Regulatory Landscape
Regulation in nonalcoholic steatohepatitis (MASH/NASH) therapeutics and diagnostics is increasingly shaped by accelerated and conditional approval pathways for drugs, alongside qualification routes for trial endpoints and tools. In the United States, the FDA granted accelerated approval to resmetirom in March 2024, and in August 2025 the FDA accepted a letter of intent to qualify vibration-controlled transient elastography (VCTE) as a reasonably likely surrogate endpoint for adult MASH trials with moderate-to-advanced fibrosis. In Europe, the EMA advanced GLP-1-based therapy access with a CHMP positive opinion in January 2026, followed by EU conditional marketing authorization in March 2026 for Kayshild (semaglutide) in non-cirrhotic MASH with moderate-to-advanced fibrosis.
Regulators are also formalizing digital pathology and AI within development programs, tightening expectations for analytical validity and reproducibility. The EMA issued a Qualification Opinion for the AIM-NASH AI tool in March 2025 for analysis of liver biopsy scans, and the FDA later qualified AIM-NASH under its Drug Development Tool program in December 2025, reinforcing a regulatory pathway for algorithm-supported histology reads in pivotal trials. For device-drug combinations and software-enabled diagnostics, the Primary Mode of Action framework in the US (for example, CDER vs CDRH lead review) and EU Medical Device Regulation requirements, including Notified Body involvement for certain combinations, remain central to planning evidence packages, labeling, and market access sequencing.
Value Chain Analysis
The value chain spans discovery and clinical development of therapeutics (biopharma sponsors, CRO networks, and trial sites), alongside diagnostic R&D and manufacturing (assay developers, imaging and elastography OEMs, and software/AI vendors), culminating in clinical delivery through hospitals, diagnostic centers, and large laboratory networks. A key inflection is the tighter coupling of diagnostics with drug development, shown by Echosens expanding its collaboration with Boehringer Ingelheim in June 2025 to embed FibroScan screening and monitoring into Survodutide Phase III trials, and by Echosens receiving FDA CDER acceptance in September 2025 of its Letter of Intent to qualify FibroScan liver stiffness measurement as a surrogate endpoint for MASH trials. These moves push demand upstream toward standardized, scalable non-invasive tests that can recruit, stratify, and monitor trial populations while reducing reliance on biopsy logistics.
Downstream commercialization is increasingly driven by partnerships that provide distribution scale, clinical adoption, and reimbursement execution. In diagnostics, GENFIT launched NASHnext (powered by NIS4) via Labcorp OnDemand in June 2026 to broaden access to at-risk MASH identification, and it subsequently announced US Medicare coverage with reimbursement scheduled from August 10, 2026, reinforcing the payer-to-provider link that supports recurring testing volumes. Capability-building alliances also extend AI-enabled diagnostic services at clinical sites, such as HistoIndex partnering with Houston Research Institute in January 2026 to deploy AI-based FibroSIGHT Plus testing across multiple centers, where algorithm validation, laboratory operations, and reimbursement strategy increasingly shape time-to-scale.
Competitive Landscape
The Nonalcoholic Steatohepatitis therapeutics and diagnostics market features moderate concentration as the leading ten companies control roughly half of therapeutic and diagnostic revenues. Madrigal, Novo Nordisk, and Eli Lilly headline therapeutics, each advancing differentiated mechanisms backed by large-scale outcome data. Madrigal leverages the first-mover benefits of resmetirom while negotiating regional deals such as the CSPC partnership to amplify its footprint. Novo Nordisk extends its metabolic franchise by positioning semaglutide as a dual obesity-liver disease solution, a narrative that resonates with payers seeking holistic risk reduction. Eli Lilly’s tirzepatide, exhibiting 52-73% MASH resolution in Phase 2, signals competitive pressure on incumbent GLP-1 players.
Diagnostic leadership rests with Roche, Siemens Healthineers, and Abbott, each bundling assay reagents, instrumentation, and decision-support software. Roche’s Elecsys PRO-C3 launch adds a rapid fibrosis tool to laboratories already using its core chemistry analyzers, enhancing switching costs. Siemens integrates AI-based elastography analysis into its ultrasound portfolio, while Abbott advances multi-analyte panels leveraging its immunoassay footprint. Competitive dynamics pivot on ecosystem lock-in, where proprietary algorithms and reagent leases secure annuity streams.
Strategic collaboration defines recent activity. Pharmaceutical-diagnostic pairing speeds companion-diagnostic development, illustrated by Labcorp’s alignment with multiple therapeutics sponsors to co-validate biomarker endpoints. Acquisition activity focuses on filling mechanism or technology gaps; GSK’s USD 1.2 billion buyout of an FGF19 analogue signaled willingness to pay premiums for late-stage hepatic assets. Overall, players mix organic R&D, in-licensing, and geographic expansion to construct defensible growth runways against a backdrop of accelerating scientific advances.
Non-alcoholic Steatohepatitis Therapeutics And Diagnostics Industry Leaders
-
Genfit SA
-
Intercept Pharmaceuticals, Inc.
-
General Electric Company (GE Healthcare)
-
Siemens Healthineers
-
Tawazun Health
- *Disclaimer: Major Players sorted in no particular order
Non-alcoholic Steatohepatitis Therapeutics And Diagnostics Market Companies Covered in this Report
- Madrigal Pharmaceuticals Inc.
- Gilead Sciences
- Novo Nordisk
- Intercept Pharmaceuticals
- Akero Therapeutics Inc.
- Viking Therapeutics Inc.
- Terns Pharmaceuticals Inc.
- Eli Lilly and Company
- Novartis
- Pfizer
- Galectin Therapeutics Inc.
- 89bio Inc.
- Regeneron Pharmaceuticals
- Roche
- Siemens Healthineers
- Abbott Laboratories
- Echosens SA
- Quest Diagnostics
Read Analysis of Non-alcoholic Steatohepatitis Therapeutics And Diagnostics Companies
Market Opportunities and Future Outlook
A gap persists between high diagnostic detection volumes and conversion into therapy initiation, creating opportunity for integrated care pathways that combine non-invasive staging, longitudinal monitoring, and payer-aligned treatment criteria. Recent regulatory and reimbursement signals support this integration, including the FDA accepting a proposal tied to reasonably likely surrogate endpoints for MASH-related clinical outcomes, and progressing non-invasive surrogate endpoint qualification activity around VCTE. Medicare coverage actions have also expanded access to non-invasive fibrosis and biomarker testing. Together, these steps reduce friction for diagnostic centers and laboratories to embed fibrosis risk stratification into routine workflows, particularly when combined with same-visit tools such as rapid biomarker assays and scalable ordering models like direct-to-lab channels.
Therapeutics commercialization is broadening beyond the first THR-beta approval into additional mechanism classes and geographies, creating room for companion diagnostics, combination regimens, and differentiated patient segmentation by fibrosis stage. In addition to resmetirom's March 2024 FDA approval, semaglutide received EU conditional marketing authorization in March 2026 for non-cirrhotic MASH with moderate-to-advanced fibrosis, and the UK MHRA granted conditional marketing authorization in July 2026, expanding the set of reimbursable treatment pathways and increasing the need for standardized non-invasive monitoring. Pipeline investment also points to modality expansion beyond small molecules, with Madrigal announcing in February 2026 an exclusive global licensing agreement covering six preclinical siRNA programs intended to expand its MASH pipeline. This reinforces demand for biomarker strategies capable of tracking mechanism-specific response and supporting differentiated labeling claims.
Recent Industry Developments in Non-alcoholic Steatohepatitis Therapeutics And Diagnostics Market
- July 2026: GENFIT announced US Medicare coverage for NASHnext, its non-invasive diagnostic test powered by NIS4 technology, with reimbursement slated to begin on August 10, 2026. The milestone strengthens the commercial pathway for blood-based MASH risk identification by reducing patient out-of-pocket uncertainty and supporting broader ordering across routine care settings.
- July 2025: Madrigal Pharmaceuticals entered a potential USD 2 billion-plus licensing deal with CSPC to commercialize resmetirom in Greater China, combining upfront consideration with milestone-linked payments. The agreement adds a scaled route-to-market in Asia-Pacific and underscores how regional partners are being used to accelerate access, local execution, and lifecycle expansion for first-in-class MASH therapies.
- March 2024: The US FDA approved resmetirom (Rezdiffra), the first treatment for adults with non-cirrhotic NASH/MASH with moderate to advanced fibrosis. This approval established an actionable treatment pathway, increasing the clinical and payer focus on non-invasive diagnostics that can stage fibrosis and monitor response without relying on biopsy.
Non-alcoholic Steatohepatitis Therapeutics And Diagnostics Market Report Scope and Research Methodology
Market Definition and Coverage
This market covers revenues generated from diagnosing and managing nonalcoholic steatohepatitis (NASH). It includes diagnostic services and tests, as well as therapeutic products used across routine clinical care and specialist settings, measured in current USD across the covered geographies.
Scope exclusions: We exclude alcoholic liver disease, viral hepatitis, and non-NASH cirrhosis care. We also exclude general metabolic screening that is not tied to an NASH diagnostic or treatment decision.
Segments Covered in This Report
- By Solution (Value)
- Therapeutics
- By Drug Class
- FXR Agonists
- THR-β Agonists
- GLP-1 Agonists
- Others
- By Drug Class
- Diagnostics
- By Diagnostic Modality
- Imaging Tests
- Biomarker-based Blood Tests
- Liver Biopsy
- Elastography
- By Diagnostic Modality
- Therapeutics
- By End User (Value)
- Hospitals & Clinics
- Diagnostic Centers
- Academic & Research Institutes
- Others
- By Geography (Value)
- North America
- United States
- Canada
- Mexico
- Europe
- Germany
- United Kingdom
- France
- Italy
- Spain
- Rest of Europe
- Asia-Pacific
- China
- India
- Japan
- South Korea
- Australia
- Rest of Asia-Pacific
- South America
- Brazil
- Argentina
- Rest of South America
- Middle East and Africa
- GCC
- South Africa
- Rest of Middle East and Africa
- North America
Data Sources, Market Sizing, and Validation
Desk Research
Desk work starts with building the disease and testing pathway so the numbers follow how patients move from suspicion to confirmation, then into treatment and monitoring. We typically pull prevalence and risk-factor signals from sources such as the US CDC, the WHO, and national health statistics agencies. We then align these inputs with liver-disease guidance and coding notes from bodies such as AASLD and EASL.
To ground the commercial side, we review product labels and safety updates from regulators such as the FDA and EMA, plus public payer coverage notes where available. Company annual reports and investor presentations help us map trial milestones and likely adoption timing, along with references from reputable medical journals that describe current diagnostic practice. Patent databases are used selectively, and import-export shipment-level datasets are also applied to sanity-check diagnostic supply movement and innovation activity. These desk sources are not exhaustive, and additional public references were used for data collection, validation, and clarification.
Primary Interviews and Surveys
Primary calls and surveys pressure-test the desk assumptions with people who see NASH patients or support testing and treatment decisions, including hepatologists, radiologists, pathologists, lab leaders, and commercial and market-access roles. Since adoption and reimbursement differ by geography, we balanced input across major regions. When pricing, approval timing, or testing practice changed enough to create a visible break in the time series, we re-contacted sources to confirm what had shifted.
Distribution of primary research fieldwork respondents
| Company type | Respondent position | Region |
|---|---|---|
| Top tier: 38% | CXOs: 15% | APAC: 45% |
| Mid tier: 47% | Functional/Unit leaders: 27% | EMEA: 29% |
| Smaller Players: 15% | Managers: 58% | Americas: 26% |
Market-Sizing & Forecasting
Sizing is built using a top-down demand pool reconstructed from NASH prevalence, diagnosis rates, and the share of patients moving into confirmatory workups and ongoing monitoring. Where data is uneven across countries, we use proxy indicators such as obesity and type 2 diabetes burden, specialist density, and testing access. We then adjust the reconstructed pool using feedback collected from clinicians and lab stakeholders.
The value build translates those patient and testing volumes into revenue using measurable inputs, including the volume of non-invasive tests, biopsy utilization where it remains standard, average testing frequency for monitoring, the share of patients eligible for therapy, and typical annual therapy cost ranges by market. Bottom-up checks are done selectively through sampled price points and volume logic for diagnostic centers and hospital pathways, and through channel checks on how quickly new therapies are being written into practice. For gaps in smaller countries, we use calibrated peer-market analogs, then review whether those analogs match local reimbursement and care access.
For forecasting, we use scenario analysis because approvals, label scope, and payer behavior can shift quickly in this space. Each scenario is tied to specific levers, such as new product entry timing, non-invasive test substitution versus biopsy, diagnosis expansion through screening of high-risk cohorts, and the pace of guideline adoption. We reconcile scenario outputs back to the overall growth curve.
Data Validation & Update Cycle
Results are validated by comparing the model outputs with independent signals, including test adoption momentum, clinical-trial progression visibility, and changes in reimbursement language. We then investigate variances that do not fit the care pathway. When a country shows a sudden jump, we re-check drivers such as currency conversion timing and launch dates, and also confirm whether diagnostic volumes were double counted.
Before sign-off, the model and assumptions go through multi-step analyst reviews. Sources are re-contacted when a material event changes the expected trajectory. Reports are refreshed annually, with interim updates when approvals, safety warnings, or reimbursement changes are meaningful. Right before delivery, a final pass is completed so clients get an updated view based on the latest available inputs.
Mordor Intelligence's Nonalcoholic Steatohepatitis Therapeutics and Diagnostics Market Sizing Compared With Other Published Estimates
It is normal to see different published market sizes for NASH therapeutics and diagnostics because the condition sits at the intersection of testing, imaging, pathology, and emerging therapies. Differences usually come from what each publisher counts as an NASH-specific diagnostic, how patient eligibility is defined, and whether the forecast assumes faster or slower reimbursement adoption.
In this study, the biggest driver behind the spread is the handling of diagnostics revenues. Some estimates fold in broader fatty liver screening and general liver panels, while others treat pipeline therapies as if they are fully commercial across the entire eligible pool too early. Currency conversion timing, the year chosen as the starting point, and how quickly average selling prices are allowed to rise also create visible gaps in the final totals.
Benchmark comparison
| Source | Market Size | Gaps in Research Methodology |
|---|---|---|
| Mordor Intelligence | USD 6.87 B (2026) | |
| Global Consultancy A | USD 8.95 B (2025) | Uses an earlier base year and a broader therapy and diagnostics basket, and the diagnostics side appears to include some adjacent liver testing that is not always NASH-confirmatory in routine care. |
| Industry Publisher B | USD 3.97 B (2025) | Starts from a narrower commercial demand view in 2025, and may apply more conservative uptake and pricing progression assumptions for both non-invasive testing expansion and therapy adoption. |
The table shows that scope and timing choices matter as much as the math. When the demand pool is limited to NASH-linked testing decisions and therapy use is tied to realistic diagnosis and eligibility progression, the total lands in a middle range that is easier to trace and replicate. This is the approach applied by Mordor Intelligence.
Key Questions Answered in the Report
How large is the global Nonalcoholic Steatohepatitis therapeutics and diagnostics market in 2026?
The Nonalcoholic Steatohepatitis therapeutics and diagnostics market size stands at USD 6.87 billion in 2026.
What is the expected CAGR for the sector through 2031?
Market value is forecast to rise at an 18.31% CAGR to reach USD 15.93 billion by 2031.
Which solution category is growing fastest?
Therapeutics expand at a 19.11% CAGR, overtaking diagnostics later in the decade.
Which region shows the highest growth momentum?
Asia-Pacific posts the strongest trajectory with a 18.67% CAGR to 2031.
Why are diagnostic centers gaining share?
AI-enabled workflows, shorter wait times, and payer support for non-invasive tests drive an 18.42% CAGR for diagnostic centers.