
Non-invasive Ventilators Market Size and Share
Market Overview
| Study Period | 2020 - 2031 |
|---|---|
| Market Size (2026) | USD 3.37 Billion |
| Market Size (2031) | USD 4.47 Billion |
| Growth Rate (2026 - 2031) | 5.85 % |
| Fastest Growing Market | Asia Pacific |
| Largest Market | North America |
| Market Concentration | Low |
Major Players *Disclaimer: Major Players sorted in no particular order Image © Mordor Intelligence. Reuse requires attribution under CC BY 4.0. | |
Non-invasive Ventilators Market Analysis by Mordor Intelligence
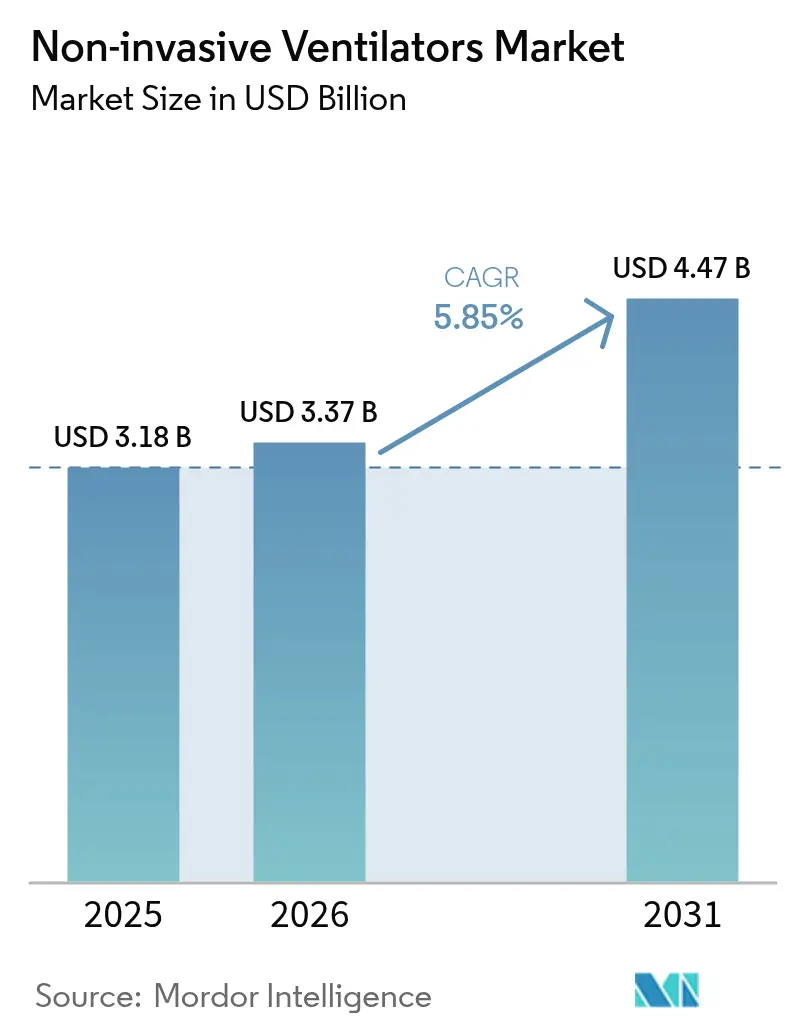
The non-invasive ventilator market size is expected to grow from USD 3.18 billion in 2025 to USD 3.37 billion in 2026 and is forecast to reach USD 4.47 billion by 2031 at 5.85% CAGR over 2026-2031. Demand is shifting from pandemic-driven surges to secular growth anchored in chronic respiratory disease management, geriatric care requirements and rising home-based therapy adoption. Artificial-intelligence algorithms that fine-tune pressure delivery, together with simplified negative-pressure concepts for resource-limited settings, are broadening the clinical footprint of the non-invasive ventilator market. Device makers focus on comfort-oriented interfaces, noise reduction and cloud connectivity to keep patients on therapy, while payers in the United States and selected European Union countries expand reimbursement to ease budget constraints. Asia-Pacific healthcare build-outs, semiconductor supply-chain stabilization and FDA fast-track clearances for portable platforms support a resilient outlook for the non-invasive ventilator market beyond traditional hospital walls.
Key Report Takeaways
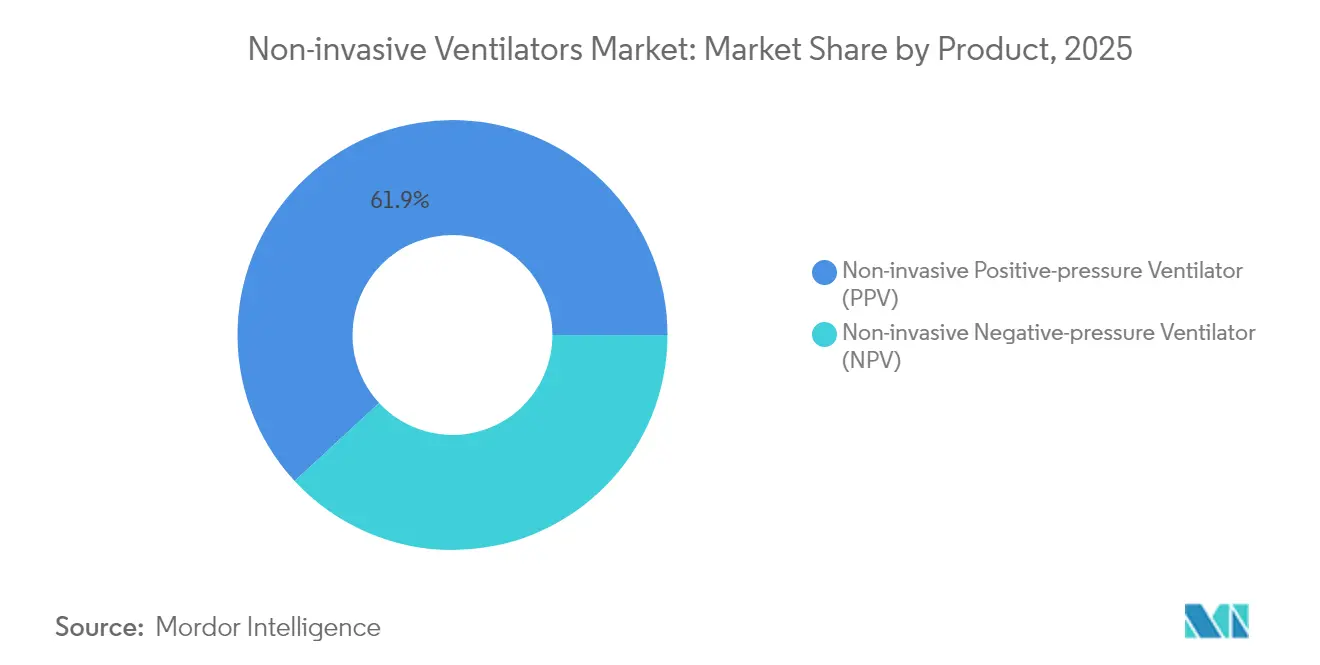
- By product category, non-invasive positive-pressure ventilators led with 61.88% revenue share in 2025; non-invasive negative-pressure ventilators are projected to grow at a 6.92% CAGR to 2031.
- By application, COPD & asthma captured 58.05% of non-invasive ventilator market share in 2025, while respiratory distress syndrome is poised for the fastest 7.05% CAGR through 2031.
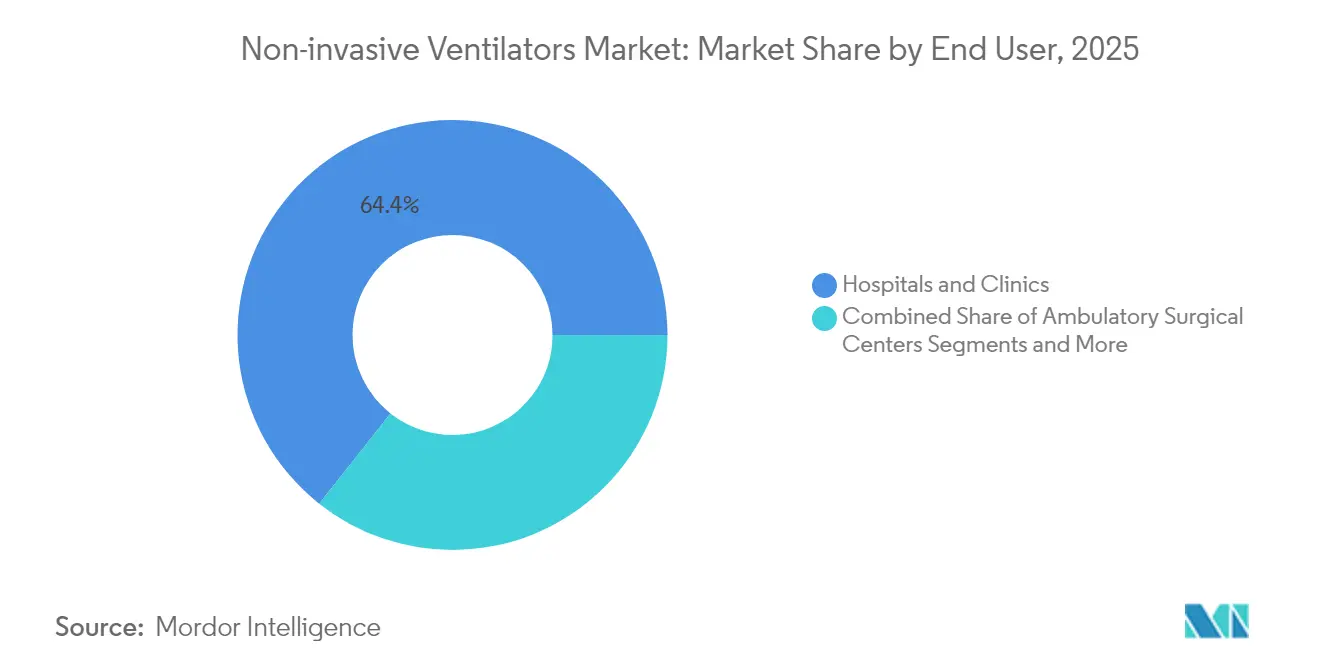
- By end user, hospitals & clinics accounted for 64.35% of the non-invasive ventilator market size in 2025, yet homecare settings are set to expand at a 7.45% CAGR between 2026-2031.
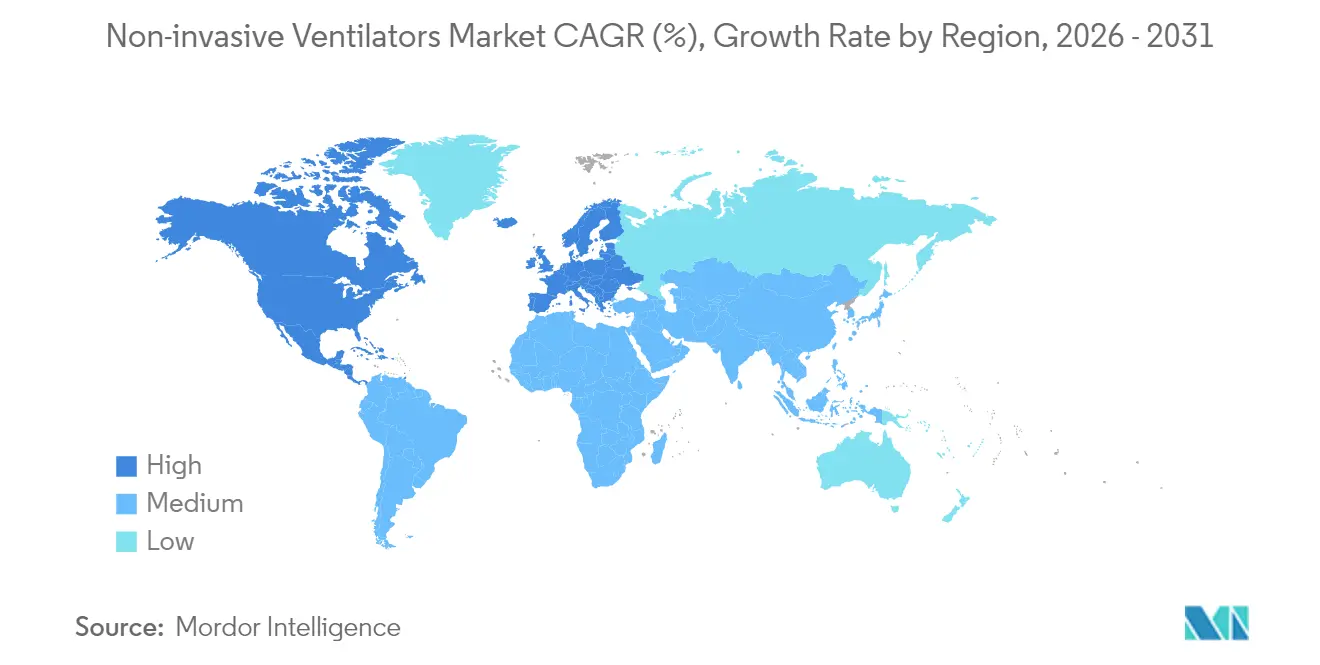
- By geography, North America commanded 42.80% of revenue in 2025, whereas Asia-Pacific is expected to post the highest 7.68% CAGR over the forecast period.
Note: Market size and forecast figures in this report are generated using Mordor Intelligence’s proprietary estimation framework, updated with the latest available data and insights as of 2026.
Market Trends and Insights
Drivers Impact Analysis of Non-invasive Ventilators Market*
| Driver | (~) % Impact on CAGR Forecast | Geographic Relevance | Impact Timeline |
|---|---|---|---|
| Surging Prevalence Of COPD & Asthma Cases | +1.8% | Global, with concentration in North America & Europe | Long term (≥ 4 years) |
| Increasing ICU Admissions Among Geriatrics | +1.2% | Global, particularly APAC and North America | Medium term (2-4 years) |
| Shift Toward Home-Based NIV Therapy | +1.5% | North America & EU, expanding to APAC | Medium term (2-4 years) |
| Reimbursement Expansion For Home NIV | +0.9% | North America, selective EU markets | Short term (≤ 2 years) |
| AI-Driven Closed-Loop NIV Modes Gain Traction | +0.6% | Global, led by developed markets | Long term (≥ 4 years) |
| Rise Of Low-Cost Negative-Pressure NIV Devices For LMICs | +0.4% | APAC, MEA, Latin America | Long term (≥ 4 years) |
| Source: Mordor Intelligence | |||
Surging Prevalence of COPD & Asthma Cases
More than 390 million people live with COPD and 262 million with asthma worldwide, generating steady demand for advanced ventilation support. Meta-analyses show that long-term non-invasive ventilation reduces mortality in obstructive sleep apnea and hypercapnic COPD cohorts. The 2025 GOLD report adds cardiovascular risk control and climate-related exacerbation management to treatment pathways, favoring intelligent ventilation that adapts to fluctuating physiology. Average Volume Assured Pressure Support paired with transcutaneous CO₂ monitoring lowers 48-hour reintubation risk and shortens stays for acute-on-chronic COPD cases. Real-time analytics platforms further personalize therapy and cut unplanned admissions by predicting decompensation events.
Increasing ICU Admissions Among Geriatrics
Adults over 65 account for a growing portion of intensive-care occupancy, often presenting with respiratory failure and multiple comorbidities. Non-invasive ventilation reduces inspiratory effort and improves tidal volumes in elderly patients compared with high-flow nasal oxygen. Device protocols now incorporate lower trigger thresholds and synchrony features to match diminished muscle strength, lowering extubation failure odds. Health systems expand ICU beds yet prefer NIV to avoid invasive airway complications and to shorten length of stay, protecting budgets while raising quality scores.
Shift Toward Home-Based NIV Therapy
Portable platforms weighing under 2 kg, battery runtimes exceeding 10 hours and Bluetooth telemetry create viable substitutes for overnight hospital monitoring. CMS opened a national coverage analysis for home non-invasive ventilation in COPD, generating momentum for outpatient care models [1]. Randomized trials confirm that home NIV significantly elevates quality-of-life metrics and slashes readmissions in severe stable COPD. Internet-of-Things dashboards transmit adherence, leak and pressure data to clinicians, enabling same-day setting tweaks that keep patients in therapeutic ranges. Cost savings accrue from avoided inpatient days and reduced transport needs.
Reimbursement Expansion for Home NIV
New HCPCS code E0468 for dual-function respiratory devices took effect in April 2024, reflecting policymaker acceptance of hybrid ventilation technologies. Proposed 2025 fee-schedule updates refine relative value units for respiratory services, potentially lifting physician participation in home NIV programs. Commercial insurers mirror Medicare moves, citing studies that document 25% lower 30-day readmission rates in patients managed with remote-monitored NIV. Streamlined 510(k) clearances for portable units reduce time-to-market for innovators while maintaining post-market surveillance rigor.
Restraints Impact Analysis of Non-invasive Ventilators Market*
| Restraint | (~) % Impact on CAGR Forecast | Geographic Relevance | Impact Timeline |
|---|---|---|---|
| Ventilator-Associated Pneumonia (VAP) Risk | -0.8% | Global, higher impact in developing markets | Medium term (2-4 years) |
| High Device & Maintenance Cost | -0.7% | APAC, MEA, Latin America | Short term (≤ 2 years) |
| Skill Gap In Handling Advanced NIV Modes | -0.5% | Global, particularly LMICs | Long term (≥ 4 years) |
| Supply-Chain Fragility For Critical Components | -0.4% | Global, concentrated in semiconductor-dependent regions | Short term (≤ 2 years) |
| Source: Mordor Intelligence | |||
Ventilator-Associated Pneumonia Risk
VAP incidence ranges from 9.2% to 30% in mechanically ventilated cohorts, adding roughly USD 544,467 per case to hospital bills versus non-VAP patients. Diagnostic variability complicates prevention, prompting global infection societies to standardize bundles that combine head-of-bed elevation, circuit hygiene and early mobilization. While NIV avoids intubation, mask leaks and secretion buildup can still seed infection, requiring design tweaks such as automatic secretion drainage and antimicrobial surfaces. Education campaigns in low- and middle-income countries show that bundle adherence cuts VAP rates by up to 35%, protecting fragile budgets.
High Device & Maintenance Cost
Advanced ventilators entail upfront capital outlays that strain emerging-market providers, while annual upkeep can equal 3-5% of hospital revenue dedicated to supply-chain services. Component complexity demands periodic calibration and skilled biomedical engineers. Simplified negative-pressure units fabricated from locally sourced materials at roughly USD 262 per device ease cost pressures without compromising safety when used under strict protocols. Leasing programs that bundle hardware, consumables and tele-support spread expenses over multi-year horizons, granting smaller hospitals access to premium therapy.
*Our forecasts treat driver/restraint impacts as directional, not additive. The impact forecasts reflect baseline growth, mix effects, and variable interactions.
Non-invasive Ventilators Market Segment Analysis
By Product:
Positive Pressure Dominance Sustains InnovationThe non-invasive ventilator market size for positive-pressure devices stood at USD 1.97 billion in 2025, corresponding to a 61.88% revenue share that reflects their entrenched role in acute and chronic care settings. Continuous Positive Airway Pressure and Bilevel PAP remain gold standards for obstructive sleep apnea and COPD exacerbations, benefiting from auto-adjusting algorithms that calibrate pressure in five-millisecond cycles. Manufacturers add humidification controls and noise-attenuation chambers to lift adherence above 80% during the first 90 days of therapy. Cloud-native dashboards push ventilatory parameters to clinicians, allowing remote titration that reduces follow-up visits. Patient-facing mobile apps gamify nightly use and flag mask-fit issues in real time.
Negative-pressure ventilators are experiencing a technical renaissance, recording the fastest 6.92% CAGR through 2031. Modern shells use lightweight composites and compact vacuum pumps, enabling patients to sit upright, converse and ingest food without therapy interruption. Clinical studies in acute respiratory distress syndrome report 15% higher PaO₂/FiO₂ ratios compared with positive-pressure modes, suggesting lung-protective advantages. Philanthropic consortia fund open-source designs aimed at district hospitals in low-resource geographies, and regulatory agencies have published fast-track guidelines to validate essential safety features.

By Application:
COPD Leadership Amid DiversificationCOPD & asthma accounted for 58.05% of non-invasive ventilator market share in 2025, supported by GOLD guideline endorsements for chronic hypercapnic management. Long-term NIV reduces mortality and mitigates cardiovascular comorbidity risks, prompting integrated disease management programs that pair ventilation with tele-coaching. Advanced Average Volume Assured Pressure Support linked to transcutaneous CO₂ sensors lowers 48-hour re-intubation from 18% to 10% in severe AECOPD cases. Algorithmic weaning tracks dyspnea scores and accelerates hospital discharge by 1.5 days on average.
Respiratory distress syndrome shows a 7.05% CAGR outlook as emergency departments adopt NIV for preoxygenation during intubation, cutting hypoxemia incidence to 9.1% versus 18.5% with standard mask approaches . Trials such as RENOVATE confirm NIV’s efficacy across mixed-etiology acute respiratory failure, broadening clinical confidence. Pediatric and postoperative indications join the pipeline, with size-adaptive masks and leak-compensation modes extending applicability.
By End User:
Hospital Dominance Meets Home ExpansionHospitals & clinics retained 64.35% of the non-invasive ventilator market size in 2025, leveraging multidisciplinary teams that manage complex comorbidities. Intensive-care protocols now pair NIV with closed-loop oxygen titration, minimizing desaturation episodes. Infection-control bundles that coordinate suction, oral hygiene and positioning have cut VAP rates by 25% inside large academic centers. Capital-planning committees prioritize hybrid devices capable of both invasive and non-invasive modes to hedge against future pandemic shocks.
Homecare settings post a market-leading 7.45% CAGR thanks to lightweight turbines, 4G connectivity and reimbursement liberalization. Ventilation-as-a-service models bundle hardware, disposables and 24-hour helplines, giving payers predictable cost lanes while boosting patient satisfaction scores above 90%. Remote-physiology dashboards feed machine-learning engines that identify leak spikes or apnea clusters, triggering automated alerts to nurses. Early data from North American insurers reveal 22% fewer readmissions in home-managed COPD compared with center-based pathways.
Geography Analysis
North America Non-invasive Ventilators Market
North America commanded 42.80% of non-invasive ventilator market revenue in 2025 on the back of high disease prevalence, sophisticated reimbursement and rapid device approvals. The FDA granted 510(k) clearance to the Servo-air portable ventilator in June 2024, adding choice for outpatient programs. CMS’s national coverage analysis for home NIV therapy is expected to widen beneficiary access in late 2025, stimulating supplier investment in cloud ecosystems. Data-integration mandates encourage interoperability between ventilators, electronic health records and payer portals, creating a virtuous cycle of evidence generation and reimbursement reinforcement.
APAC Non-invasive Ventilators Market
Asia-Pacific records the fastest 7.68% CAGR through 2031. Healthcare expenditure in China surpassed CNY 8.5 trillion in 2022 and is projected to hit CNY 20.5 trillion by 2030, enabling tertiary-care network upgrades . Governments introduce pilot schemes for negative-pressure ventilation kits in rural clinics to address acute pneumonia outbreaks without relying on scarce intensive-care beds. Local assembly lines shorten lead times and insulate procurement from currency volatility. Regional academic partnerships generate data on NIV efficacy in tuberculosis-coexistent COPD, guiding tailored protocols.
Europe Non-invasive Ventilators Market
Europe stabilizes growth at mid-single digits, supported by universal health systems and stringent safety standards. The European Respiratory Society’s latest guideline endorses early application of NIV in postoperative respiratory failure, feeding procurement pipelines for high-flow capable machines. ESG initiatives push suppliers to design recyclable circuits and to measure carbon footprints across the ventilator life cycle.
MEA and South America Non-invasive Ventilators Market
Middle East & Africa and South America contribute modest base-effect expansion. Oil-exporting economies channel surplus revenue into critical-care capacity, while public-private partnerships in Brazil fund tele-ventilation projects that connect secondary hospitals with urban pulmonology hubs. Development banks back equipment-leasing pools to sidestep high import tariffs, further democratizing access.
Regulatory Landscape
In the United States, non-invasive ventilators are generally regulated by the FDA as Class II devices under the 21 CFR 868 series (for example, continuous ventilators under 21 CFR 868.5895). 510(k) clearances remain a key route to market, with submissions commonly validated against FDA-recognized consensus standards for ventilatory support equipment (including the ISO 80601 family), reinforcing expectations for alarms, performance testing, and essential safety.
Reimbursement and coverage policy continues to shape adoption pathways for home use. CMS implemented a National Coverage Determination for noninvasive positive pressure ventilation (NIPPV) in the home for chronic respiratory failure due to COPD effective June 2025, and CMS manual updates in 2026 adjusted terminology around home mechanical ventilators. This has prompted providers and industry groups such as the American Association for Respiratory Care (AARC) to seek clarifications tied to device programming and patient access. In Europe, ventilators fall under the Medical Devices Regulation (EU) 2017/745 and typically require Notified Body involvement for conformity assessment. MDR technical documentation expectations are reinforced through Notified Body community guidance (for example, Team-NB technical documentation positions released in April 2026).
Value Chain Analysis
The value chain spans component and material suppliers (turbines, sensors, electronics, and medical-grade polymers), sub-assembly and final device manufacturing by OEMs, and production of patient interfaces and consumables (masks, circuits, humidification accessories) that directly affect therapy effectiveness and adherence. OEMs such as ResMed, Philips, Fisher & Paykel Healthcare, and Hamilton Medical integrate proprietary control algorithms for leak compensation and alarms, then route products through regulatory release activities (FDA 510(k) in the United States and EU MDR conformity assessment with Notified Bodies) before distribution through hospital procurement channels, home medical equipment (HME) providers, and respiratory care clinics.
Regulatory re-qualification requirements add friction to supply continuity, since changes in materials, electronics, or interface design can require additional validation and documentation updates. This raises switching costs for alternative suppliers. Post-pandemic resilience efforts increasingly emphasize dual-sourcing for critical components (including polymer parts and electronics) and securing sterilization and packaging capacity for accessories, since constraints in validated sterile packaging and circuit or mask availability can cascade into device backorders and delayed deployments in homecare programs.
Competitive Landscape
Market structure remains moderately consolidated. ResMed recorded 11% fiscal-2024 revenue growth as cloud-connected AirView and myAir ecosystems drove patient engagement. Medtronic exited its Puritan Bennett ventilator line in February 2024 to redeploy capital toward robotic surgery, opening share opportunities for mid-tier entrants. ZOLL acquired select Vyaire platforms for USD 37 million, adding bellavista and LTV models that bolster its acute-care franchise.
Competitive advantage hinges on proprietary algorithms, seamless data flows and flexible financing. Philips continues remediation under an FDA consent decree that caps new Respironics shipments until quality-management milestones are met. Fisher & Paykel focuses on humidification patents that lower mucosal dryness, while Hamilton Medical markets turbine-driven units that cut oxygen consumption by 25% in high-altitude regions. Start-ups develop open-source negative-pressure shells priced under USD 300 for humanitarian missions, a niche that established players monitor for reverse-innovation cues.
Strategic partnerships proliferate. Device makers sign APIs with electronic medical record vendors to embed ventilation dashboards within clinician workflows. Telecom operators co-develop low-latency 5G gateways that transmit waveform data to cloud AI engines, enabling instant leak detection.
Non-invasive Ventilators Industry Leaders
-
ResMed Inc.
-
Teleflex Incorporated
-
Hamilton Bonaduz AG
-
Koninklijke Philips N.V.
-
heyer medical AG
- *Disclaimer: Major Players sorted in no particular order

Non-invasive Ventilators Market Companies Covered in this Report
- Resmed
- Koninklijke Philips
- Fisher & Paykel Healthcare
- Hamilton Medical
- Teleflex
- Medtronic
- GE Healthcare
- Dragerwerk
- Vyaire Medical
- Nihon Kohden Corp.
- Smiths Group
- Getinge
- Airon
- Air Liquide
- Ventec Life Systems
- Phoenix Medical Systems
- Heyer Medical
- Zoll Medical Corp.
Market Opportunities and Future Outlook
Home-based NIV programs for COPD create an actionable whitespace around patient selection, setup, and monitoring workflows, anchored by CMS coverage expansion for NIPPV in the home for chronic respiratory failure due to COPD effective June 2025. This policy anchor increases the importance of fit-for-purpose device configurations, connected adherence and performance reporting, and provider education, especially as stakeholders such as AARC continued to raise access and criteria-clarity issues in 2026. For manufacturers and HME networks, the opportunity is to standardize documentation and device-setting pathways that map clearly to coverage requirements.
Technology differentiation is converging on closed-loop and sensing-enabled platforms that reduce clinician burden and improve synchrony and comfort. Recent product and feature activity supports this direction, including FDA 510(k) clearance for AI-enabled comfort personalization (ResMed Personalized Therapy Comfort Settings/Smart Comfort, cleared in 2025) and capability upgrades that add advanced monitoring and adaptive modes (for example, Nihon Kohden updates to the NKV-550 series disclosed in 2026). Procurement interest is also building around consolidated systems that span invasive, non-invasive, and high-flow therapies, as reflected in Mindray North America announcing its ventilator-market entry in 2026 with SV900 and SV700 series positioned around integrated modality coverage.
Recent Industry Developments in Non-invasive Ventilators Market
- February 2026: ResMed introduced the AirTouch F30i Comfort full-face fabric mask in the United States, aiming to improve comfort and support adherence for PAP therapy users. The launch strengthens ResMed's interface portfolio, which is a key lever for sustained utilization of connected home respiratory devices and associated software ecosystems.
- December 2025: ResMed received FDA 510(k) clearance for Personalized Therapy Comfort Settings (PTCS), marketed as Smart Comfort, an AI-enabled feature designed to personalize CPAP therapy comfort. The clearance supports software-led differentiation within home respiratory support, helping manufacturers bundle clinical and comfort features while staying within established regulatory pathways.
- May 2024: ResMed announced a major upgrade to its remote monitoring platform for home ventilator therapies, enabling centralized data analytics and multi-site patient management across the United States. The update expands capability beyond patient interfaces to include cloud-based adherence dashboards and clinician workflow integrations, reinforcing ResMed's position in connected home respiratory care. This development aligns with payer and provider emphasis on outcomes tracking and coordinated care in chronic respiratory disease.
Non-invasive Ventilators Market Report Scope and Research Methodology
Market Definition and Coverage
This market covers revenue generated from non-invasive ventilators used to support breathing through masks or similar interfaces, without placing an airway tube. It includes both non-invasive positive pressure ventilation and non-invasive negative pressure ventilation devices sold into clinical and home care settings.
Scope exclusions: Invasive ventilators and intubation or tracheostomy based ventilation systems are excluded, along with unrelated airway accessories that are not required to deliver non-invasive ventilation.
Segments Covered in This Report
- By Product
- Non-invasive Positive-pressure Ventilator (PPV)
- Bi-level Positive Airway Pressure (BiPAP)
- Constant Positive Airway Pressure (CPAP)
- Autotitrating Positive Airway Pressure (APAP)
- Non-invasive Negative-pressure Ventilator (NPV)
- Non-invasive Positive-pressure Ventilator (PPV)
- By Application
- COPD & Asthma
- Respiratory Distress Syndrome
- Others
- By End User
- Hospitals & Clinics
- Ambulatory Surgical Centers
- Homecare Settings
- By Geography
- North America
- United States
- Canada
- Mexico
- Europe
- Germany
- United Kingdom
- France
- Italy
- Spain
- Rest of Europe
- Asia-Pacific
- China
- Japan
- India
- Australia
- South Korea
- Rest of Asia-Pacific
- Middle East & Africa
- GCC
- South Africa
- Rest of Middle East & Africa
- South America
- Brazil
- Argentina
- Rest of South America
- North America
Data Sources, Market Sizing, and Validation
Desk Research
Desk work starts by building the demand and supply context around non-invasive respiratory support, so the final model is not driven by one data point. We leaned on public sources such as the World Health Organization, the US CDC, the US FDA device safety and recall information, and OECD health statistics to understand disease burden, utilization direction, and care-setting shifts.
We also referenced peer reviewed clinical journals on NIV adoption in COPD and sleep related breathing disorders, customs and trade statistics where relevant for device and component movement, and reimbursement and coding guidance published by payers or public agencies. To sanity check company exposure and pricing ranges, we reviewed annual reports, investor presentations, and reputable health care press, and we used paid subscriptions for company financials and patent databases to track product cycles and technology refresh. The sources listed here are illustrative and not exhaustive, and many other references were also used for data collection, cross-checks, and clarification.
Primary Interviews and Surveys
Primary discussions were used to test what desk signals could not confirm cleanly, especially around purchasing behavior, replacement cycles, and average selling price movement across hospital and home care channels. We spoke with stakeholders across manufacturers, distributors, clinicians, and procurement teams, and regional coverage was balanced across APAC, EMEA, and the Americas so the demand pool and pricing logic were not overly shaped by one geography.
Distribution of primary research fieldwork respondents
| Company type | Respondent position | Region |
|---|---|---|
| Top tier: 25% | CXOs: 12% | APAC: 39% |
| Mid tier: 61% | Functional/Unit leaders: 35% | EMEA: 36% |
| Smaller Players: 14% | Managers: 53% | Americas: 25% |
Market-Sizing & Forecasting
The core model is built using a top-down and bottom-up combination, where disease prevalence and treated population signals are translated into an addressable NIV user pool, and then converted into device demand by care setting. Inputs that materially shape the totals include COPD and sleep apnea diagnosis rates, hospital and home care NIV adoption patterns, estimated device replacement cycles, mask and interface utilization behavior, and average selling prices by device class, including how portable platforms are priced versus standard units.
Once the headline size is constructed, selective bottom-up checks are run to keep the output realistic. These include supplier revenue cross checks, sampled price points from public tenders, and volume logic anchored to installed base and replacement assumptions where data is available. When small gaps appear in bottom-up visibility, they are handled through conservative share based allocations tied to documented distribution reach, and then reviewed again in interviews.
For forecasting, we use scenario analysis supported by trend lines in the inputs rather than a single straight-line CAGR. This approach allows reimbursement shifts, home care penetration, and hospital capital budgets to be reflected with clearer reasoning. Assumptions on ASP progression and replacement cycles are kept explicit, and they are updated when primary respondents indicate a meaningful change in pricing or procurement cadence.
Data Validation & Update Cycle
Validation is done in layers so the final number is not dependent on one assumption. We compare outputs against independent signals such as reported respiratory device revenue exposure, procurement and tender activity patterns, and regional care setting utilization indicators, and then investigate any variances that sit outside expected ranges.
Anomaly checks are followed by internal analyst reviews, and callbacks are triggered when we see mismatches between modeled unit demand and what channel participants describe. Reports are refreshed annually, and interim updates are made when material events occur, such as major regulatory actions or sudden pricing changes. Before delivery, a final pass is completed to ensure the currency conversion timing and key inputs reflect the latest available information.
Mordor Intelligence's Non Invasive Ventilators Market Size Compared With Other Published Estimates
Published market sizes for non-invasive ventilators can look different even when the topic name seems identical, because analysts may count different device families, use different pricing points, and update their models on different calendars. In our work, the spread is usually explained by scope boundaries, how average selling prices are trended, and whether the latest year is restated after new financial or regulatory signals arrive.
The biggest gap drivers in this market tend to be whether adjacent respiratory support items are bundled into the same revenue pool, how factory-gate versus end-customer pricing is treated, and how currency timing is handled when revenues come from multiple regions. When price moves, tender outcomes, and product refresh cycles are rechecked close to publication, the model will differ from earlier snapshots. This is why the FX timing and ASP updates are locked after a final validation pass tied to non-invasive ventilator only revenues in Mordor Intelligence.
Benchmark comparison
| Source | Market Size | Gaps in Research Methodology |
|---|---|---|
| Mordor Intelligence | USD 3.37 B (2026) | |
| Global Consultancy A | USD 3.27 B (2026) | Uses a factory-gate revenue definition and explicitly includes related items such as NIV masks, circuits, and high flow nasal cannula devices, which shifts what is counted as ventilator revenue and changes the product mix assumptions used for pricing. |
| Trade Publisher B | USD 3.18 B (2025) | Reports a prior-year value and can differ due to currency conversion timing and how ASP changes were carried forward into the next year, especially when procurement cycles and portable platform pricing shifted after the base year was set. |
Across the three values, the range is mainly explained by scope edges and timing differences, rather than a disagreement that demand exists. By keeping the inputs traceable to adoption, replacement, and pricing assumptions, and then checking them against independent signals and interview feedback, the estimate stays practical to reproduce and easier to reconcile when new data arrives.
Key Questions Answered in the Report
What is the current Non-invasive Ventilators Market size?
The non-invasive ventilator market size reached USD 3.37 billion in 2026 and is projected at USD 4.47 billion by 2031.
Who are the key players in Non-invasive Ventilators Market?
ResMed Inc., Teleflex Incorporated, Hamilton Bonaduz AG, Koninklijke Philips N.V. and heyer medical AG are the major companies operating in the Non-invasive Ventilators Market.
Which product type dominates sales?
Non-invasive positive-pressure ventilators led with 61.88% revenue share in 2025.
How fast is homecare adoption expanding?
Homecare settings are expected to grow at a 7.45% CAGR between 2026-2031, outpacing hospital growth.