| Study Period | 2017 - 2029 |
| Base Year For Estimation | 2024 |
| Forecast Data Period | 2025 - 2029 |
| Market Size (2025) | USD 37.84 Billion |
| Market Size (2029) | USD 60.62 Billion |
| CAGR (2025 - 2029) | 12.50 % |
| Market Concentration | High |
Major Players*Disclaimer: Major Players sorted in no particular order |

NMC Battery Pack Market Analysis
The NMC Battery Pack Market size is estimated at 37.84 billion USD in 2025, and is expected to reach 60.62 billion USD by 2029, growing at a CAGR of 12.50% during the forecast period (2025-2029).
The global NMC battery pack industry is experiencing unprecedented transformation driven by accelerating electric vehicle adoption and stringent environmental regulations worldwide. Major automotive manufacturers are rapidly transitioning their product portfolios toward electrification, with industry leaders like BYD and Tesla commanding significant market presence, holding 13.3% and 12.2% market share respectively in 2022. This shift is further evidenced by the remarkable 70% growth in global EV sales during 2022, primarily driven by strong demand in China and the United States. The industry's evolution is characterized by increasing competition among established automakers and new entrants, all vying to secure their position in the expanding electric vehicle ecosystem.
Technological advancements in NMC battery pack chemistry continue to push the boundaries of performance and efficiency. This is exemplified by Audi's 2022 launch of the Q8 e-tron, featuring an advanced battery system with a 114 kWh NMC battery pack capable of delivering an impressive 600 km range on a single charge. Battery manufacturers are focusing on developing solutions that optimize energy density, charging speeds, and overall battery life while simultaneously working to reduce production costs. These innovations are crucial in addressing consumer concerns regarding range anxiety and charging times, which have historically been barriers to EV adoption.
The industry is witnessing significant investments in production capacity expansion and supply chain optimization. Major manufacturers are establishing new production facilities and forming strategic partnerships to secure raw material supplies and strengthen their market positions. Ford's ambitious announcement in April 2023 to produce 600,000 electric vehicles by the end of 2023, scaling up to 2 million vehicles by 2026, demonstrates the industry's commitment to large-scale production. This expansion is accompanied by efforts to develop more resilient and localized supply chains, reducing dependency on specific geographic regions for critical materials and components.
Sustainability initiatives and circular economy principles are becoming increasingly central to the NMC battery pack industry's development. Manufacturers are investing in recycling technologies and sustainable production methods to minimize environmental impact and recover valuable materials. The industry witnessed a substantial 115.78% growth in global demand for EV battery pack solutions in 2022, highlighting the increasing emphasis on sustainable transportation solutions. Companies are also focusing on developing more environmentally friendly production processes and implementing end-of-life battery management system strategies to create a more sustainable industry ecosystem.
NMC Battery Pack Market Trends
BYD AND TESLA ARE LEADING THE CHARGE IN THE EV MARKET AND SHAPING THE FUTURE
- In 2022, BYD was the market leader in electric vehicle sales and held a share of 13.3%. BYD's leading position can be attributed to several factors. It has been an early and prominent player in the EV industry, with a strong focus on producing electric vehicles and related technologies. The company's early entry into the market allowed it to establish a solid foundation and gain recognition among consumers. BYD has also been actively expanding its operations globally, forging partnerships, and investing in research and development, all of which contribute to its leading position.
- Tesla has been at the forefront of electric vehicle innovation and has played a crucial role in popularizing EVs worldwide. Tesla was a significant player in the EV industry in 2022, with a market share of 12.2%. Tesla's strong brand image, cutting-edge technology, and extensive Supercharger network have contributed to its success.
- Among the other players in the EV market, there are several notable companies that hold significant market shares. BMW's established reputation in the automotive industry, coupled with its commitment to electric mobility through its "BMW i" sub-brand, has contributed to its market presence. Similarly, Volkswagen, which held a market share of 3.9% in 2022, has been actively investing in electric mobility under its "Volkswagen Group" umbrella. These companies, along with others like Mercedes-Benz, Kia, and Hyundai, are recolonizing the EV industry by leveraging their existing brand recognition, introducing compelling electric vehicle models, and investing in technology to enhance the range and performance of their electric offerings.

Understand The Key Trends Shaping This Market
Download PDF
TESLA AND BYD DOMINATED THE BEST-SELLING EV MODELS OF 2022
- The best-selling EV models in 2022 were dominated by two key OEMs: Tesla and BYD. Tesla held a strong market position with two of its models, the Model Y and Model 3, capturing the first and third spots, respectively. The Tesla Model Y was the most popular plug-in electric vehicle, with global unit sales of roughly 771,300 in 2022. That year, deliveries of Tesla's Model 3 and Model Y surpassed 1.2 million, a Y-o-Y increase of 36.77% for Tesla's best-selling models. While two of the five best-selling plug-in electric vehicle (PEV) models were Tesla-branded, the battery electric vehicle manufacturer faced competition from Asian brands in 2022. China-based BYD overtook Tesla as the best-selling PEV brand in 2022, relying on a large offering of plug-in hybrid electric models. Following closely behind the Tesla Model Y, the BYD Song Plus (BEV + PHEV) secured the second spot, with sales reaching 477,090 units. BYD's established presence in the Chinese market, along with its reputation for producing reliable and technologically advanced electric vehicles, likely contributed to the strong sales performance of the Song Plus models.
- The Volkswagen ID.4 stood out among the best-selling EV models as the only European PEV (Plug-in Electric Vehicle) in the top ten. With a sales volume of 174,090 units in 2022, the ID.4 demonstrated Volkswagen's commitment to electric mobility and its growing presence in the EV market.
- Overall, these top-performing EV models from Tesla and BYD, along with other notable contenders like the Wuling Hong Guang MINI EV and Volkswagen ID.4, demonstrate the increasing consumer demand for electric vehicles.

OTHER KEY INDUSTRY TRENDS COVERED IN THE REPORT
- INCREASING GLOBAL DEMAND AND GOVERNMENT SUPPORT PROPELLING ELECTRIC VEHICLE MARKET GROWTH
- EV BATTERY PACK PRICES DECLINED DUE TO ECONOMIES OF SCALE AND TECHNOLOGICAL ADVANCEMENTS, BUT FACED A TEMPORARY INCREASE IN 2022
- THE DECREASING COST OF BATTERIES IS A MAJOR FACTOR IN THE EXPANDING AND MORE ACCESSIBLE GLOBAL EV MARKET
- AUTOMAKERS LAUNCHED NEW ELECTRIC VEHICLE MODELS TO MEET THE INCREASING DEMAND, BOOSTING BATTERY PACK DEMAND WORLDWIDE
- LFP, NMC, NCA, AND NCM BATTERIES ARE LEADING THE WAY, WITH DIFFERENT GEOGRAPHIES SHOWING A PREFERENCE FOR SPECIFIC CHEMISTRIES
- INCREASING GLOBAL DEMAND FOR ELECTRIC VEHICLE BATTERIES AND MATERIALS DRIVEN BY INCREASING ELECTRIFICATION OF VEHICLES, WITH LFP BATTERIES LEADING THE TREND
- INCREASING GLOBAL DEMAND AND TECHNOLOGICAL ADVANCEMENTS DRIVE THE ELECTRIC VEHICLE MARKET AND BATTERY INDUSTRY
Segment Analysis: Body Type
Passenger Car Segment in NMC Battery Pack Market
The passenger car segment has emerged as both the dominant and fastest-growing segment in the global NMC battery pack market. In 2024, passenger cars are expected to account for approximately 80% of the total market share, driven by increasing consumer preference for electric passenger vehicles equipped with NMC batteries. This substantial market share can be attributed to several factors, including the superior performance characteristics of NMC batteries in passenger cars, such as fast charging capabilities and high energy density. The segment's growth is further supported by favorable government policies promoting electric vehicle adoption, expanding charging infrastructure, and increasing consumer awareness about environmental sustainability. Major automotive manufacturers are increasingly incorporating NMC battery technology in their electric passenger vehicle lineups, recognizing its advantages in terms of range efficiency and performance. Additionally, technological advancements in NMC battery chemistry have made these batteries more cost-effective and reliable for passenger car applications.
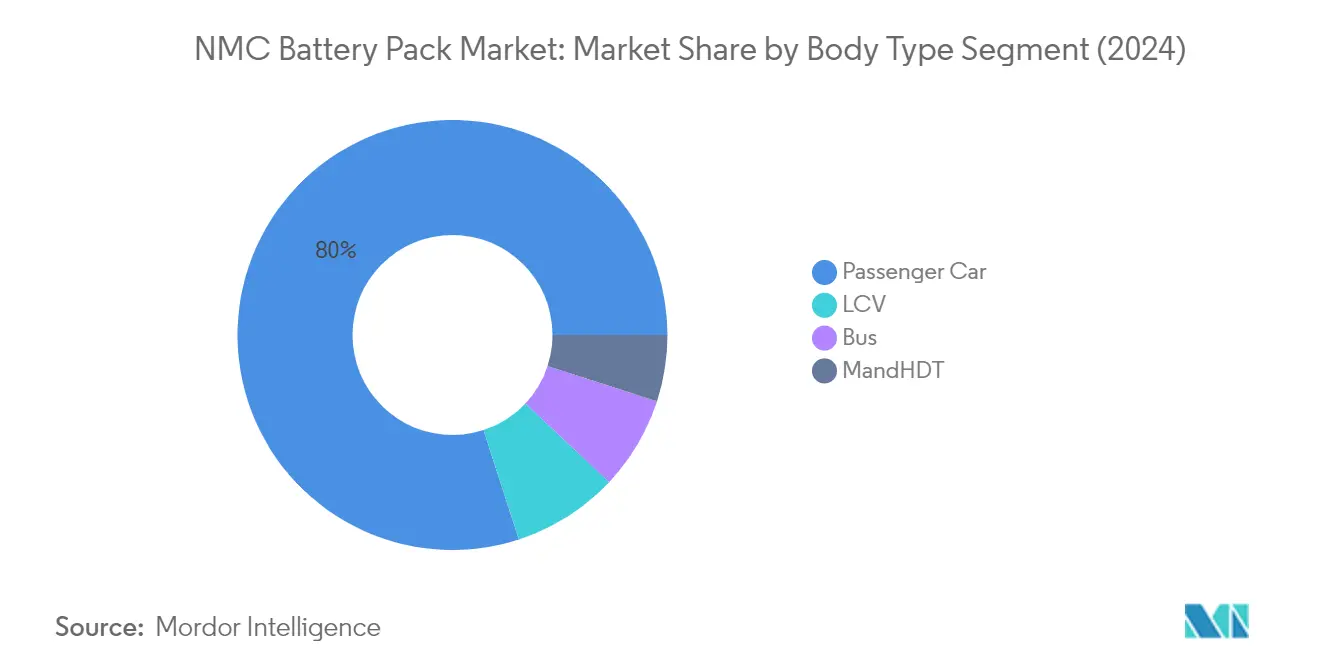
Remaining Segments in Body Type
The other segments in the NMC battery pack market include buses, light commercial vehicles (LCVs), and medium & heavy-duty trucks (M&HDT). These segments play crucial roles in different aspects of commercial and public transportation electrification. The bus segment is particularly significant in urban transit electrification initiatives, while LCVs are gaining importance in last-mile delivery and urban logistics applications. The M&HDT segment represents an emerging opportunity in the commercial transportation sector, where NMC batteries are being increasingly considered for their high-performance characteristics. Each of these segments faces unique challenges and opportunities, influenced by factors such as operational requirements, charging infrastructure availability, and specific performance needs of commercial applications. The adoption of NMC batteries in these segments is being driven by increasing focus on reducing commercial vehicle emissions and the growing need for sustainable transportation solutions across different vehicle categories.
Segment Analysis: Propulsion Type
BEV Segment in NMC Battery Pack Market
Battery Electric Vehicles (BEVs) dominate the NMC battery pack market, commanding approximately 89% of the total market share in 2024. This significant market position can be attributed to several factors, including the superior performance characteristics of NMC batteries in BEVs, such as high energy density, extended driving range, and fast-charging capabilities. The segment is also experiencing the fastest growth trajectory, projected to expand at around 21% through 2029, driven by increasing consumer preference for zero-emission vehicles, supportive government policies, and continuous technological advancements in battery technology. Major automotive manufacturers are increasingly focusing on BEV production, with companies like Audi launching new models equipped with high-capacity NMC batteries offering ranges up to 600 km on a single charge. The growing infrastructure development and declining battery costs are further accelerating BEV adoption across major markets.
PHEV Segment in NMC Battery Pack Market
The Plug-in Hybrid Electric Vehicle (PHEV) segment represents a smaller but significant portion of the NMC battery pack market, offering a transitional solution for consumers seeking both electric and conventional driving capabilities. PHEVs utilize NMC batteries for their electric-only driving range while maintaining the flexibility of an internal combustion engine for extended journeys. The segment benefits from increasing consumer awareness about environmental sustainability and the advantage of reduced range anxiety compared to pure electric vehicles. Various automotive manufacturers are continuing to develop and launch new PHEV models with improved electric ranges and performance capabilities, contributing to the segment's steady growth. The integration of advanced NMC battery technology in PHEVs is enabling manufacturers to achieve better energy density and faster charging capabilities, making these vehicles increasingly attractive to consumers seeking versatile transportation solutions.
Segment Analysis: Capacity
15 kWh to 40 kWh Segment in NMC Battery Pack Market
The 15 kWh to 40 kWh segment dominates the global NMC battery pack market, holding approximately 43% market share in 2024. This segment's leadership position can be attributed to the increasing adoption of electric vehicles in the mid-range category, particularly in price-sensitive markets across Asia-Pacific and Europe. The segment's popularity stems from its optimal balance between cost and performance, making it particularly attractive for urban electric vehicles and compact SUVs. The growing demand for affordable electric mobility solutions, coupled with government incentives and subsidies targeting mid-range electric vehicles, has further strengthened this segment's market position. Additionally, manufacturers are focusing on enhancing the energy density and charging capabilities of batteries in this capacity range, making them increasingly attractive for mass-market electric vehicles.
Above 80 kWh Segment in NMC Battery Pack Market
The above 80 kWh segment is emerging as the fastest-growing category in the NMC battery pack market, projected to expand at a remarkable rate through 2024-2029. This rapid growth is primarily driven by the increasing demand for long-range electric vehicles and high-performance electric cars in mature markets. The segment is benefiting from technological advancements in battery chemistry and thermal management systems, enabling better energy density and faster charging capabilities. Major automotive manufacturers are increasingly incorporating these high-capacity battery packs in their premium electric vehicle models to meet consumer demands for extended range and superior performance. The segment is also gaining traction in the commercial vehicle sector, particularly in electric buses and heavy-duty trucks, where high energy capacity is crucial for long-distance operations.
Remaining Segments in Capacity
The 40 kWh to 80 kWh and less than 15 kWh segments play crucial roles in serving specific market niches within the NMC battery pack ecosystem. The 40 kWh to 80 kWh segment caters to the growing demand for mid-to-high range passenger vehicles and light commercial vehicles, offering a balanced combination of range and cost-effectiveness. This segment is particularly popular in regions with well-developed charging infrastructure and among consumers seeking vehicles for both urban and interstate travel. Meanwhile, the less than 15 kWh segment serves the market for smaller electric vehicles, including urban delivery vehicles and compact city cars. These segments contribute to the market's diversity by addressing specific use cases and price points, ensuring that NMC battery technology remains accessible across various vehicle categories and applications.
Segment Analysis: Battery Form
Segment Analysis: Method
Laser Segment in NMC Battery Pack Market
The laser method dominates the global NMC battery pack market, holding approximately 52% market share in 2024. This significant market position can be attributed to several advantages that laser welding offers in battery pack manufacturing, including superior connection quality, enhanced thermal management, and improved overall battery performance. The laser method is particularly preferred in high-power battery pack applications due to its ability to provide robust and high-quality connections between battery cells. The technology's precision in controlling weld parameters ensures consistent and reliable connections, making it the preferred choice for premium electric vehicle manufacturers. Additionally, laser welding's capability to handle complex geometries and its compatibility with various battery cell formats has contributed to its widespread adoption in the industry.
Wire Segment in NMC Battery Pack Market
The wire bonding method in the NMC battery pack market is experiencing steady growth, driven by its cost-effectiveness and reliability in low to medium-power applications. This method is particularly valued for its flexibility in accommodating different wire types and its proven track record in establishing dependable connections. Wire bonding's popularity is further enhanced by its advanced friction technology and ability to create reliable connections even on imperfect surfaces. The method's adaptability to various manufacturing environments and its lower initial investment requirements compared to laser welding make it an attractive option for many manufacturers. The wire bonding segment continues to evolve with technological advancements, offering improved efficiency and reliability in battery pack assembly processes.
Segment Analysis: Component
Cathode Segment in NMC Battery Pack Market
The cathode segment dominates the global NMC battery pack market, accounting for approximately 52% of the total market value in 2024. This significant market share can be attributed to cathodes being the most vital and expensive battery components in NMC batteries, comprising more than half of all battery cell components. The cathode's dominance is driven by its crucial role in determining battery density and power rating, making it essential for achieving optimal battery performance. Major manufacturers across the globe have increased their utilization of NMC cathode material due to growing demand from various countries like Italy, China, Japan, and France. The cathode metals required for NMC batteries are in high demand as they are used more frequently than any other component, with the materials being sourced from established supply chains across multiple regions.
Separator Segment in NMC Battery Pack Market
The separator segment is projected to exhibit the strongest growth in the NMC battery pack market from 2024 to 2029, with an expected growth rate of approximately 12%. This accelerated growth is primarily driven by technological advancements in separator materials and manufacturing processes, leading to enhanced battery performance and safety features. The increasing focus on battery safety and thermal management has positioned separators as a critical component in NMC batteries. Major separator manufacturers, including Asahi Kasei Corp., Toray Industries Inc., and SK Innovation Co. Ltd, have significantly expanded their production capabilities to meet the rising demand. The growth is further supported by innovations in separator materials, such as ceramic-coated separators and advanced polymer technologies, which contribute to improved battery life and safety characteristics.
Remaining Segments in Component Segmentation
The anode and electrolyte segments also play crucial roles in the NMC battery pack market, each contributing uniquely to battery performance and functionality. The anode segment, typically utilizing graphite materials, is essential for battery stability and longevity, while also playing a critical role in fast-charging capabilities. The electrolyte segment, though representing a smaller portion of the battery cost, is fundamental in enabling ion transport between electrodes and maintaining overall battery efficiency. Both segments continue to evolve with ongoing research and development efforts focused on improving materials and manufacturing processes, contributing to the overall advancement of NMC battery technology. These components work in synergy with cathodes and separators to enhance battery performance, safety, and reliability in various applications.
Segment Analysis: Material Type
Natural Graphite Segment in NMC Battery Pack Market
Natural graphite has emerged as a dominant material in the NMC battery pack market, holding approximately 30% market share in 2024, driven by its superior properties and cost-effectiveness in battery production. The material's high conductivity, durability, and stability make it an ideal choice for anode materials in NMC batteries. The growing demand for natural graphite is further supported by its abundant availability and established supply chains across major battery manufacturing regions. Battery manufacturers are increasingly preferring natural graphite due to its ability to enhance battery performance, extend lifecycle, and improve charging capabilities. The material's thermal management properties and structural stability contribute significantly to battery safety and reliability. Additionally, ongoing technological advancements in graphite processing and purification have led to improved material quality and performance characteristics, further cementing its position as a crucial component in NMC battery production.
Nickel Segment in NMC Battery Pack Market
The nickel segment is experiencing remarkable growth in the NMC battery pack market, with a projected growth rate of approximately 21% from 2024 to 2029. This substantial growth is primarily attributed to nickel's ability to enhance energy density and improve overall battery performance. Manufacturers are increasingly adopting higher nickel content in their battery formulations to achieve greater energy density and extended driving ranges for electric vehicles. The segment's growth is further supported by ongoing research and development efforts focused on optimizing nickel-rich cathode materials. Industry players are investing heavily in developing advanced nickel-based compositions that offer improved stability and longer cycle life. The trend towards higher nickel content in NMC batteries is also driven by the material's ability to reduce cobalt dependency while maintaining or improving battery performance characteristics.
Remaining Segments in Material Type
The other significant materials in the NMC battery pack market include cobalt, lithium, manganese, and various supplementary materials, each playing crucial roles in battery performance and functionality. Cobalt contributes to structural stability and safety aspects of the battery, while lithium serves as the primary charge carrier enabling the battery's fundamental operation. Manganese helps in achieving thermal stability and cost optimization, making it an essential component in the battery chemistry. These materials work in synergy to create optimal battery characteristics, with manufacturers constantly fine-tuning their proportions to achieve the best balance of performance, cost, and safety. The ongoing research and development in these materials continue to drive innovations in battery technology, leading to improved performance metrics and enhanced sustainability profiles.
NMC Battery Pack Market Geography Segment Analysis
NMC Battery Pack Market in Asia-Pacific
The Asia-Pacific region represents a thriving market for battery packs, driven by robust domestic demand and strong government support for electric vehicle adoption. Countries like China, Japan, South Korea, India, and Thailand are making significant strides in developing their electric vehicle ecosystems. The region benefits from a well-established manufacturing base, particularly in China and South Korea, along with progressive government policies promoting electric mobility. Advanced technological capabilities, especially in Japan and South Korea, contribute to continuous innovations in battery technology. The presence of major automotive manufacturers and battery producers further strengthens the region's position in the global battery pack market.
NMC Battery Pack Market in Europe
Europe stands as a crucial market for NMC battery packs, characterized by strong environmental regulations and ambitious electric vehicle adoption targets. The region encompasses key markets including Germany, France, Hungary, Italy, Poland, Sweden, and the UK, each contributing uniquely to the market's growth. European countries have implemented comprehensive incentive programs and infrastructure development initiatives to accelerate electric vehicle adoption. The region's automotive industry's commitment to electrification, coupled with stringent emission regulations, continues to drive the demand for industrial battery packs and commercial battery packs solutions.
NMC Battery Pack Market in Germany
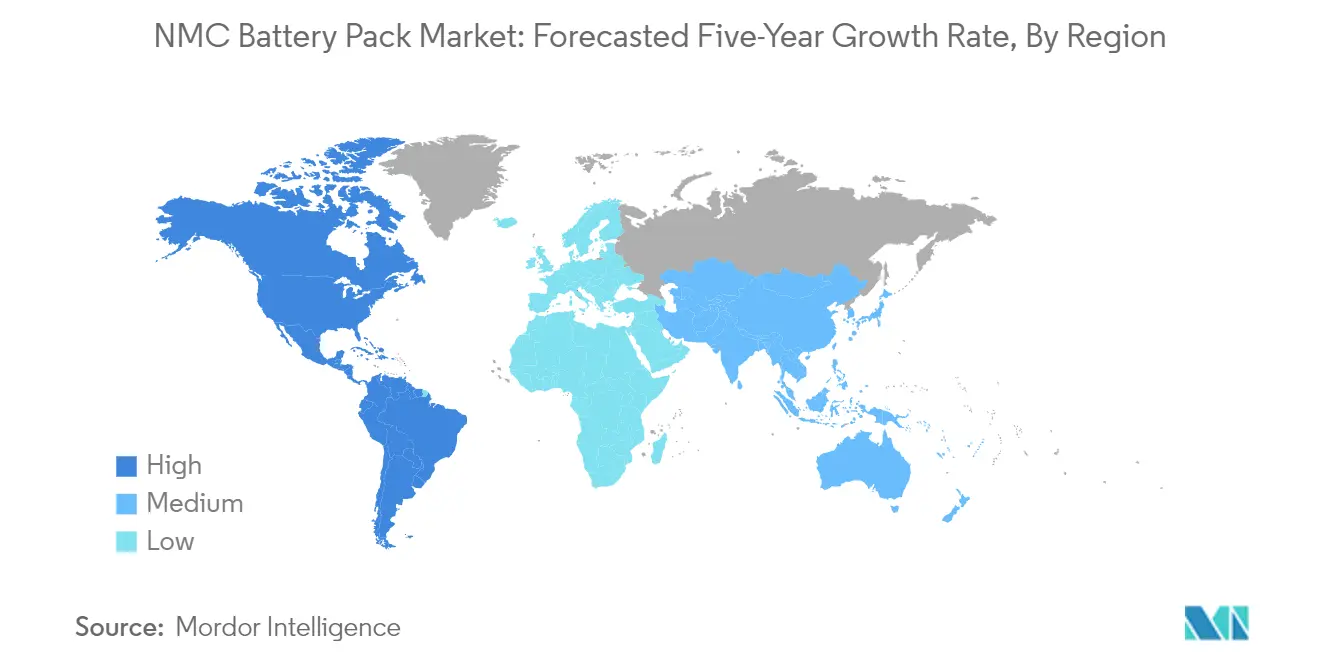
Germany leads the European NMC battery pack market with its robust automotive industry and strong focus on electric mobility. The country's market dominance is supported by substantial investments in research and development, along with the presence of major automotive manufacturers. With approximately 35% market share in Europe's NMC battery pack market in 2024, Germany continues to strengthen its position through advanced manufacturing capabilities and technological innovations. The country's comprehensive charging infrastructure and supportive government policies further reinforce its market leadership in the energy storage battery pack sector.
NMC Battery Pack Market in Canada
Canada emerges as the fastest-growing market in North America, demonstrating remarkable progress in NMC battery pack adoption. The country's growth is driven by strong government support, including substantial investments in charging infrastructure and manufacturing capabilities. With a projected growth rate of approximately 101% from 2024 to 2029, Canada is rapidly expanding its electric vehicle ecosystem. The country's rich natural resources, particularly in battery materials, combined with strategic partnerships between government and industry stakeholders, position it favorably for sustained growth in the energy storage battery pack market.
NMC Battery Pack Market in Middle East & Africa
The Middle East & Africa region represents an emerging market for NMC battery packs, characterized by growing awareness of electric mobility and increasing government initiatives to reduce carbon emissions. The region is witnessing gradual adoption of electric vehicles, particularly in urban areas, driven by environmental concerns and efforts to diversify from traditional fossil fuel dependency. While the market is still in its early stages, various countries in the region are implementing supportive policies and infrastructure development programs to accelerate the adoption of electric vehicles and, consequently, NMC battery packs.
NMC Battery Pack Market in North America
North America demonstrates a strong commitment to electric vehicle adoption and NMC battery pack technology, with the United States and Canada leading the regional market. The region benefits from robust research and development capabilities, significant investments in manufacturing infrastructure, and supportive government policies. The United States emerges as the largest market in the region, while Canada shows the fastest growth potential. The region's focus on reducing carbon emissions, coupled with increasing consumer awareness and preference for electric vehicles, continues to drive market expansion, particularly in the grid storage battery sector.
NMC Battery Pack Market in South America
South America's NMC battery pack market is experiencing gradual growth, driven by increasing awareness of electric mobility and government initiatives to promote sustainable transportation. The region is witnessing growing interest in electric vehicles, particularly in urban areas, supported by developing charging infrastructure and incentive programs. While the market is still evolving, various countries are implementing supportive policies to encourage electric vehicle adoption and develop local manufacturing capabilities for NMC battery packs.
Get Analysis on Important Geographic Markets
Download PDF
NMC Battery Pack Industry Overview
Top Companies in NMC Battery Pack Market
The global lithium ion battery pack market is led by major players including CATL, BYD, LG Energy Solution, Samsung SDI, and SK Innovation. These companies are heavily investing in research and development to enhance battery performance, energy density, and charging capabilities. Product innovation focuses on developing advanced battery chemistries and improving manufacturing processes to reduce costs while maintaining quality. Companies are expanding their production capacities through new manufacturing facilities across strategic locations globally, particularly in Europe and North America. Strategic partnerships with automotive manufacturers and technology companies are becoming increasingly common to secure supply chains and develop next-generation battery technologies. Operational agility is demonstrated through vertical integration strategies, localized production facilities, and adaptive manufacturing processes to meet varying regional demands.
Market Dominated by Asian Manufacturing Giants
The NMC battery pack market exhibits a relatively concentrated structure, with Asian manufacturers, particularly from China, South Korea, and Japan, holding dominant positions. These companies leverage their established technological expertise, manufacturing capabilities, and strong supply chain networks to maintain market leadership. The market is characterized by the presence of both pure-play battery manufacturers and diversified conglomerates that have expanded into the battery segment, bringing significant financial resources and research capabilities to the industry. Vertical integration is becoming increasingly common as companies seek to control critical aspects of the supply chain, from raw material procurement to final battery assembly.
The industry has witnessed significant consolidation through strategic mergers and acquisitions, particularly as automotive manufacturers seek to secure their battery supply chains. Traditional automotive companies are either partnering with established battery manufacturers or developing in-house capabilities through acquisitions of smaller technology companies. Joint ventures between battery manufacturers and automotive companies are becoming more prevalent, combining technological expertise with manufacturing scale. This trend is particularly evident in emerging markets where local partnerships are crucial for market entry and expansion.
Innovation and Sustainability Drive Future Success
For incumbent players to maintain and expand their market share, focus on technological innovation and cost optimization remains crucial. Companies are investing in advanced manufacturing processes, automation, and digitalization to improve efficiency and reduce production costs. Developing sustainable manufacturing practices and establishing circular economy initiatives for battery recycling are becoming increasingly important for market leadership. Building strong relationships with automotive manufacturers through long-term supply agreements and joint development projects helps secure market position. Additionally, geographical diversification and localization of production facilities help mitigate supply chain risks and meet regional content requirements.
New entrants and challenger companies can gain ground by focusing on niche market segments or specific applications where established players may have less presence. Developing innovative battery technologies or manufacturing processes that offer significant advantages in terms of performance, cost, or sustainability can provide competitive differentiation. Building strategic partnerships with emerging electric vehicle manufacturers or energy storage system developers can help secure market share. Success in this market also requires careful attention to evolving regulatory requirements, particularly regarding safety standards and environmental regulations. Companies must also consider the increasing emphasis on sustainable practices and circular economy principles in their business strategies. The integration of battery management system technologies is also becoming critical to ensure optimal performance and safety standards.
NMC Battery Pack Market Leaders
-
BYD Company Ltd.
-
China Aviation Battery Co. Ltd. (CALB)
-
Contemporary Amperex Technology Co. Ltd. (CATL)
-
Guoxuan High-tech Co. Ltd.
-
LG Energy Solution Ltd.
- *Disclaimer: Major Players sorted in no particular order

Need More Details on Market Players and Competiters?
Download PDF
Free With This Report
Our comprehensive data set offers over 120 free charts, providing detailed regional and country-level insights into the EV battery pack industry. This includes analyses of distribution and production centers, variations in average selling prices (ASPs) across different regions, and a deep dive into industry trends like demand shifts and technological innovations. We also offer a thorough market segmentation, examining different battery chemistries, capacities, and form factors, alongside an in-depth understanding of market trends such as the adoption of advanced technologies and the impact of environmental regulations. Additionally, we provide an overview of major industry players, a look at the regulatory landscape, and market size analysis in terms of revenue and volume, all culminating in projections and forecasts that consider emerging trends and potential industry shifts.


NMC Battery Pack Market Report - Table of Contents
1. EXECUTIVE SUMMARY & KEY FINDINGS
2. REPORT OFFERS
3. INTRODUCTION
- 3.1 Study Assumptions & Market Definition
- 3.2 Scope of the Study
- 3.3 Research Methodology
4. KEY INDUSTRY TRENDS
- 4.1 Electric Vehicle Sales
- 4.2 Electric Vehicle Sales By OEMs
- 4.3 Best-selling EV Models
- 4.4 OEMs With Preferable Battery Chemistry
- 4.5 Battery Pack Price
- 4.6 Battery Material Cost
- 4.7 Price Chart Of Different Battery Chemistry
- 4.8 Who Supply Whom
- 4.9 EV Battery Capacity And Efficiency
- 4.10 Number Of EV Models Launched
-
4.11 Regulatory Framework
- 4.11.1 Belgium
- 4.11.2 Brazil
- 4.11.3 China
- 4.11.4 Colombia
- 4.11.5 France
- 4.11.6 Germany
- 4.11.7 Hungary
- 4.11.8 India
- 4.11.9 Indonesia
- 4.11.10 Japan
- 4.11.11 Poland
- 4.11.12 Thailand
- 4.11.13 UK
- 4.12 Value Chain & Distribution Channel Analysis
5. MARKET SEGMENTATION (includes market size in Value in USD and Volume, Forecasts up to 2029 and analysis of growth prospects)
-
5.1 Body Type
- 5.1.1 Bus
- 5.1.2 LCV
- 5.1.3 M&HDT
- 5.1.4 Passenger Car
-
5.2 Propulsion Type
- 5.2.1 BEV
- 5.2.2 PHEV
-
5.3 Capacity
- 5.3.1 15 kWh to 40 kWh
- 5.3.2 40 kWh to 80 kWh
- 5.3.3 Above 80 kWh
- 5.3.4 Less than 15 kWh
-
5.4 Battery Form
- 5.4.1 Cylindrical
- 5.4.2 Pouch
- 5.4.3 Prismatic
-
5.5 Method
- 5.5.1 Laser
- 5.5.2 Wire
-
5.6 Component
- 5.6.1 Anode
- 5.6.2 Cathode
- 5.6.3 Electrolyte
- 5.6.4 Separator
-
5.7 Material Type
- 5.7.1 Cobalt
- 5.7.2 Lithium
- 5.7.3 Manganese
- 5.7.4 Natural Graphite
- 5.7.5 Nickel
- 5.7.6 Other Materials
-
5.8 Region
- 5.8.1 Asia-Pacific
- 5.8.1.1 By Country
- 5.8.1.1.1 China
- 5.8.1.1.2 India
- 5.8.1.1.3 Japan
- 5.8.1.1.4 South Korea
- 5.8.1.1.5 Thailand
- 5.8.1.1.6 Rest-of-Asia-Pacific
- 5.8.2 Europe
- 5.8.2.1 By Country
- 5.8.2.1.1 France
- 5.8.2.1.2 Germany
- 5.8.2.1.3 Hungary
- 5.8.2.1.4 Italy
- 5.8.2.1.5 Poland
- 5.8.2.1.6 Sweden
- 5.8.2.1.7 UK
- 5.8.2.1.8 Rest-of-Europe
- 5.8.3 Middle East & Africa
- 5.8.4 North America
- 5.8.4.1 By Country
- 5.8.4.1.1 Canada
- 5.8.4.1.2 US
- 5.8.5 South America
6. COMPETITIVE LANDSCAPE
- 6.1 Key Strategic Moves
- 6.2 Market Share Analysis
- 6.3 Company Landscape
-
6.4 Company Profiles
- 6.4.1 BYD Company Ltd.
- 6.4.2 China Aviation Battery Co. Ltd. (CALB)
- 6.4.3 Contemporary Amperex Technology Co. Ltd. (CATL)
- 6.4.4 Guoxuan High-tech Co. Ltd.
- 6.4.5 LG Energy Solution Ltd.
- 6.4.6 Panasonic Holdings Corporation
- 6.4.7 Primearth EV Energy Co. Ltd.
- 6.4.8 Samsung SDI Co. Ltd.
- 6.4.9 SK Innovation Co. Ltd.
- 6.4.10 SVOLT Energy Technology Co. Ltd. (SVOLT)
- *List Not Exhaustive
7. KEY STRATEGIC QUESTIONS FOR EV BATTERY PACK CEOS
8. APPENDIX
-
8.1 Global Overview
- 8.1.1 Overview
- 8.1.2 Porter’s Five Forces Framework
- 8.1.3 Global Value Chain Analysis
- 8.1.4 Market Dynamics (DROs)
- 8.2 Sources & References
- 8.3 List of Tables & Figures
- 8.4 Primary Insights
- 8.5 Data Pack
- 8.6 Glossary of Terms
You Can Purchase Parts Of This Report. Check Out Prices For Specific Sections
Get Price Break-up Now
List of Tables & Figures
- Figure 1:
- ELECTRIC VEHICLE SALES, BY BODY TYPE, UNITS, GLOBAL, 2017 - 2029
- Figure 2:
- ELECTRIC VEHICLE SALES, BY MAJOR OEMS, UNITS, GLOBAL, 2023
- Figure 3:
- ELECTRIC VEHICLE SALES, BY MAJOR OEMS, UNITS, GLOBAL, 2023
- Figure 4:
- BEST-SELLING EV MODELS, UNITS, GLOBAL, 2023
- Figure 5:
- OEMS MARKET SHARE BY ELECTRIC VEHICLE BATTERY CHEMISTRY, VOLUME %, GLOBAL, 2023
- Figure 6:
- ELECTRIC VEHICLE BATTERY CELL AND PACK PRICE, USD, GLOBAL, 2017 - 2029
- Figure 7:
- ELECTRIC VEHICLE KEY BATTERY MATERIAL PRICE, BY MATERIAL, USD, GLOBAL, 2017 - 2029
- Figure 8:
- ELECTRIC VEHICLE BATTERY PRICE, BY BATTERY CHEMISTRY, USD, GLOBAL, 2017 - 2029
- Figure 9:
- EV BATTERY PACK CAPACITY AND EFFICIENCY, KM/KWH, GLOBAL, 2023
- Figure 10:
- UPCOMING EV MODELS, BY BODY TYPE, UNITS, GLOBAL, 2023
- Figure 11:
- BREAKDOWN OF NMC BATTERY PACK MARKET, KWH, GLOBAL, 2017 - 2029
- Figure 12:
- BREAKDOWN OF NMC BATTERY PACK MARKET, USD, GLOBAL, 2017 - 2029
- Figure 13:
- BREAKDOWN OF NMC BATTERY PACK MARKET, BY BODY TYPE, KWH, GLOBAL, 2017 - 2029
- Figure 14:
- BREAKDOWN OF NMC BATTERY PACK MARKET, BY BODY TYPE, USD, GLOBAL, 2017 - 2029
- Figure 15:
- BREAKDOWN OF NMC BATTERY PACK MARKET, BODY TYPE, VOLUME SHARE (%), GLOBAL, 2022 & 2029
- Figure 16:
- BREAKDOWN OF NMC BATTERY PACK MARKET, BODY TYPE, VALUE SHARE (%), GLOBAL, 2022 & 2029
- Figure 17:
- BREAKDOWN OF NMC BATTERY PACK MARKET, BY BUS, KWH, GLOBAL, 2017 - 2029
- Figure 18:
- BREAKDOWN OF NMC BATTERY PACK MARKET, BY BUS, USD, GLOBAL, 2017 - 2029
- Figure 19:
- BREAKDOWN OF NMC BATTERY PACK MARKET, PROPULSION TYPE, VALUE SHARE (%), GLOBAL, 2017-2029
- Figure 20:
- BREAKDOWN OF NMC BATTERY PACK MARKET, BY LCV, KWH, GLOBAL, 2017 - 2029
- Figure 21:
- BREAKDOWN OF NMC BATTERY PACK MARKET, BY LCV, USD, GLOBAL, 2017 - 2029
- Figure 22:
- BREAKDOWN OF NMC BATTERY PACK MARKET, PROPULSION TYPE, VALUE SHARE (%), GLOBAL, 2017-2029
- Figure 23:
- BREAKDOWN OF NMC BATTERY PACK MARKET, BY M&HDT, KWH, GLOBAL, 2017 - 2029
- Figure 24:
- BREAKDOWN OF NMC BATTERY PACK MARKET, BY M&HDT, USD, GLOBAL, 2017 - 2029
- Figure 25:
- BREAKDOWN OF NMC BATTERY PACK MARKET, PROPULSION TYPE, VALUE SHARE (%), GLOBAL, 2017-2029
- Figure 26:
- BREAKDOWN OF NMC BATTERY PACK MARKET, BY PASSENGER CAR, KWH, GLOBAL, 2017 - 2029
- Figure 27:
- BREAKDOWN OF NMC BATTERY PACK MARKET, BY PASSENGER CAR, USD, GLOBAL, 2017 - 2029
- Figure 28:
- BREAKDOWN OF NMC BATTERY PACK MARKET, PROPULSION TYPE, VALUE SHARE (%), GLOBAL, 2017-2029
- Figure 29:
- BREAKDOWN OF NMC BATTERY PACK MARKET, BY PROPULSION TYPE, KWH, GLOBAL, 2017 - 2029
- Figure 30:
- BREAKDOWN OF NMC BATTERY PACK MARKET, BY PROPULSION TYPE, USD, GLOBAL, 2017 - 2029
- Figure 31:
- BREAKDOWN OF NMC BATTERY PACK MARKET, PROPULSION TYPE, VOLUME SHARE (%), GLOBAL, 2022 & 2029
- Figure 32:
- BREAKDOWN OF NMC BATTERY PACK MARKET, PROPULSION TYPE, VALUE SHARE (%), GLOBAL, 2022 & 2029
- Figure 33:
- BREAKDOWN OF NMC BATTERY PACK MARKET, BY BEV, KWH, GLOBAL, 2017 - 2029
- Figure 34:
- BREAKDOWN OF NMC BATTERY PACK MARKET, BY BEV, USD, GLOBAL, 2017 - 2029
- Figure 35:
- BREAKDOWN OF NMC BATTERY PACK MARKET, BODY TYPE, VALUE SHARE (%), GLOBAL, 2017-2029
- Figure 36:
- BREAKDOWN OF NMC BATTERY PACK MARKET, BY PHEV, KWH, GLOBAL, 2017 - 2029
- Figure 37:
- BREAKDOWN OF NMC BATTERY PACK MARKET, BY PHEV, USD, GLOBAL, 2017 - 2029
- Figure 38:
- BREAKDOWN OF NMC BATTERY PACK MARKET, BODY TYPE, VALUE SHARE (%), GLOBAL, 2017-2029
- Figure 39:
- BREAKDOWN OF NMC BATTERY PACK MARKET, BY CAPACITY, KWH, GLOBAL, 2017 - 2029
- Figure 40:
- BREAKDOWN OF NMC BATTERY PACK MARKET, BY CAPACITY, USD, GLOBAL, 2017 - 2029
- Figure 41:
- BREAKDOWN OF NMC BATTERY PACK MARKET, CAPACITY, VOLUME SHARE (%), GLOBAL, 2022 & 2029
- Figure 42:
- BREAKDOWN OF NMC BATTERY PACK MARKET, CAPACITY, VALUE SHARE (%), GLOBAL, 2022 & 2029
- Figure 43:
- BREAKDOWN OF NMC BATTERY PACK MARKET, BY 15 KWH TO 40 KWH, KWH, GLOBAL, 2017 - 2029
- Figure 44:
- BREAKDOWN OF NMC BATTERY PACK MARKET, BY 15 KWH TO 40 KWH, USD, GLOBAL, 2017 - 2029
- Figure 45:
- BREAKDOWN OF NMC BATTERY PACK MARKET, BODY TYPE, VALUE SHARE (%), GLOBAL, 2017-2029
- Figure 46:
- BREAKDOWN OF NMC BATTERY PACK MARKET, BY 40 KWH TO 80 KWH, KWH, GLOBAL, 2017 - 2029
- Figure 47:
- BREAKDOWN OF NMC BATTERY PACK MARKET, BY 40 KWH TO 80 KWH, USD, GLOBAL, 2017 - 2029
- Figure 48:
- BREAKDOWN OF NMC BATTERY PACK MARKET, BODY TYPE, VALUE SHARE (%), GLOBAL, 2017-2029
- Figure 49:
- BREAKDOWN OF NMC BATTERY PACK MARKET, BY ABOVE 80 KWH, KWH, GLOBAL, 2017 - 2029
- Figure 50:
- BREAKDOWN OF NMC BATTERY PACK MARKET, BY ABOVE 80 KWH, USD, GLOBAL, 2017 - 2029
- Figure 51:
- BREAKDOWN OF NMC BATTERY PACK MARKET, BODY TYPE, VALUE SHARE (%), GLOBAL, 2017-2029
- Figure 52:
- BREAKDOWN OF NMC BATTERY PACK MARKET, BY LESS THAN 15 KWH, KWH, GLOBAL, 2017 - 2029
- Figure 53:
- BREAKDOWN OF NMC BATTERY PACK MARKET, BY LESS THAN 15 KWH, USD, GLOBAL, 2017 - 2029
- Figure 54:
- BREAKDOWN OF NMC BATTERY PACK MARKET, BODY TYPE, VALUE SHARE (%), GLOBAL, 2017-2029
- Figure 55:
- BREAKDOWN OF NMC BATTERY PACK MARKET, BY BATTERY FORM, KWH, GLOBAL, 2017 - 2029
- Figure 56:
- BREAKDOWN OF NMC BATTERY PACK MARKET, BY BATTERY FORM, USD, GLOBAL, 2017 - 2029
- Figure 57:
- BREAKDOWN OF NMC BATTERY PACK MARKET, BATTERY FORM, VOLUME SHARE (%), GLOBAL, 2022 & 2029
- Figure 58:
- BREAKDOWN OF NMC BATTERY PACK MARKET, BATTERY FORM, VALUE SHARE (%), GLOBAL, 2022 & 2029
- Figure 59:
- BREAKDOWN OF NMC BATTERY PACK MARKET, BY CYLINDRICAL, KWH, GLOBAL, 2017 - 2029
- Figure 60:
- BREAKDOWN OF NMC BATTERY PACK MARKET, BY CYLINDRICAL, USD, GLOBAL, 2017 - 2029
- Figure 61:
- BREAKDOWN OF NMC BATTERY PACK MARKET, BODY TYPE, VALUE SHARE (%), GLOBAL, 2017-2029
- Figure 62:
- BREAKDOWN OF NMC BATTERY PACK MARKET, BY POUCH, KWH, GLOBAL, 2017 - 2029
- Figure 63:
- BREAKDOWN OF NMC BATTERY PACK MARKET, BY POUCH, USD, GLOBAL, 2017 - 2029
- Figure 64:
- BREAKDOWN OF NMC BATTERY PACK MARKET, BODY TYPE, VALUE SHARE (%), GLOBAL, 2017-2029
- Figure 65:
- BREAKDOWN OF NMC BATTERY PACK MARKET, BY PRISMATIC, KWH, GLOBAL, 2017 - 2029
- Figure 66:
- BREAKDOWN OF NMC BATTERY PACK MARKET, BY PRISMATIC, USD, GLOBAL, 2017 - 2029
- Figure 67:
- BREAKDOWN OF NMC BATTERY PACK MARKET, BODY TYPE, VALUE SHARE (%), GLOBAL, 2017-2029
- Figure 68:
- BREAKDOWN OF NMC BATTERY PACK MARKET, BY METHOD, KWH, GLOBAL, 2017 - 2029
- Figure 69:
- BREAKDOWN OF NMC BATTERY PACK MARKET, BY METHOD, USD, GLOBAL, 2017 - 2029
- Figure 70:
- BREAKDOWN OF NMC BATTERY PACK MARKET, METHOD, VOLUME SHARE (%), GLOBAL, 2022 & 2029
- Figure 71:
- BREAKDOWN OF NMC BATTERY PACK MARKET, METHOD, VALUE SHARE (%), GLOBAL, 2022 & 2029
- Figure 72:
- BREAKDOWN OF NMC BATTERY PACK MARKET, BY LASER, KWH, GLOBAL, 2017 - 2029
- Figure 73:
- BREAKDOWN OF NMC BATTERY PACK MARKET, BY LASER, USD, GLOBAL, 2017 - 2029
- Figure 74:
- BREAKDOWN OF NMC BATTERY PACK MARKET, BODY TYPE, VALUE SHARE (%), GLOBAL, 2017-2029
- Figure 75:
- BREAKDOWN OF NMC BATTERY PACK MARKET, BY WIRE, KWH, GLOBAL, 2017 - 2029
- Figure 76:
- BREAKDOWN OF NMC BATTERY PACK MARKET, BY WIRE, USD, GLOBAL, 2017 - 2029
- Figure 77:
- BREAKDOWN OF NMC BATTERY PACK MARKET, BODY TYPE, VALUE SHARE (%), GLOBAL, 2017-2029
- Figure 78:
- BREAKDOWN OF NMC BATTERY PACK MARKET, BY COMPONENT, UNITS, GLOBAL, 2017 - 2029
- Figure 79:
- BREAKDOWN OF NMC BATTERY PACK MARKET, BY COMPONENT, USD, GLOBAL, 2017 - 2029
- Figure 80:
- BREAKDOWN OF NMC BATTERY PACK MARKET, COMPONENT, VOLUME SHARE (%), GLOBAL, 2022 & 2029
- Figure 81:
- BREAKDOWN OF NMC BATTERY PACK MARKET, COMPONENT, VALUE SHARE (%), GLOBAL, 2022 & 2029
- Figure 82:
- BREAKDOWN OF NMC BATTERY PACK MARKET, BY ANODE, UNITS, GLOBAL, 2017 - 2029
- Figure 83:
- BREAKDOWN OF NMC BATTERY PACK MARKET, BY ANODE, USD, GLOBAL, 2017 - 2029
- Figure 84:
- BREAKDOWN OF NMC BATTERY PACK MARKET, BODY TYPE, VALUE SHARE (%), GLOBAL, 2017-2029
- Figure 85:
- BREAKDOWN OF NMC BATTERY PACK MARKET, BY CATHODE, UNITS, GLOBAL, 2017 - 2029
- Figure 86:
- BREAKDOWN OF NMC BATTERY PACK MARKET, BY CATHODE, USD, GLOBAL, 2017 - 2029
- Figure 87:
- BREAKDOWN OF NMC BATTERY PACK MARKET, BODY TYPE, VALUE SHARE (%), GLOBAL, 2017-2029
- Figure 88:
- BREAKDOWN OF NMC BATTERY PACK MARKET, BY ELECTROLYTE, UNITS, GLOBAL, 2017 - 2029
- Figure 89:
- BREAKDOWN OF NMC BATTERY PACK MARKET, BY ELECTROLYTE, USD, GLOBAL, 2017 - 2029
- Figure 90:
- BREAKDOWN OF NMC BATTERY PACK MARKET, BODY TYPE, VALUE SHARE (%), GLOBAL, 2017-2029
- Figure 91:
- BREAKDOWN OF NMC BATTERY PACK MARKET, BY SEPARATOR, UNITS, GLOBAL, 2017 - 2029
- Figure 92:
- BREAKDOWN OF NMC BATTERY PACK MARKET, BY SEPARATOR, USD, GLOBAL, 2017 - 2029
- Figure 93:
- BREAKDOWN OF NMC BATTERY PACK MARKET, BODY TYPE, VALUE SHARE (%), GLOBAL, 2017-2029
- Figure 94:
- BREAKDOWN OF NMC BATTERY PACK MARKET, BY MATERIAL TYPE, KG, GLOBAL, 2017 - 2029
- Figure 95:
- BREAKDOWN OF NMC BATTERY PACK MARKET, BY MATERIAL TYPE, USD, GLOBAL, 2017 - 2029
- Figure 96:
- BREAKDOWN OF NMC BATTERY PACK MARKET, MATERIAL TYPE, VOLUME SHARE (%), GLOBAL, 2022 & 2029
- Figure 97:
- BREAKDOWN OF NMC BATTERY PACK MARKET, MATERIAL TYPE, VALUE SHARE (%), GLOBAL, 2022 & 2029
- Figure 98:
- BREAKDOWN OF NMC BATTERY PACK MARKET, BY COBALT, KG, GLOBAL, 2017 - 2029
- Figure 99:
- BREAKDOWN OF NMC BATTERY PACK MARKET, BY COBALT, USD, GLOBAL, 2017 - 2029
- Figure 100:
- BREAKDOWN OF NMC BATTERY PACK MARKET, BODY TYPE, VALUE SHARE (%), GLOBAL, 2017-2029
- Figure 101:
- BREAKDOWN OF NMC BATTERY PACK MARKET, BY LITHIUM, KG, GLOBAL, 2017 - 2029
- Figure 102:
- BREAKDOWN OF NMC BATTERY PACK MARKET, BY LITHIUM, USD, GLOBAL, 2017 - 2029
- Figure 103:
- BREAKDOWN OF NMC BATTERY PACK MARKET, BODY TYPE, VALUE SHARE (%), GLOBAL, 2017-2029
- Figure 104:
- BREAKDOWN OF NMC BATTERY PACK MARKET, BY MANGANESE, KG, GLOBAL, 2017 - 2029
- Figure 105:
- BREAKDOWN OF NMC BATTERY PACK MARKET, BY MANGANESE, USD, GLOBAL, 2017 - 2029
- Figure 106:
- BREAKDOWN OF NMC BATTERY PACK MARKET, BODY TYPE, VALUE SHARE (%), GLOBAL, 2017-2029
- Figure 107:
- BREAKDOWN OF NMC BATTERY PACK MARKET, BY NATURAL GRAPHITE, KG, GLOBAL, 2017 - 2029
- Figure 108:
- BREAKDOWN OF NMC BATTERY PACK MARKET, BY NATURAL GRAPHITE, USD, GLOBAL, 2017 - 2029
- Figure 109:
- BREAKDOWN OF NMC BATTERY PACK MARKET, BODY TYPE, VALUE SHARE (%), GLOBAL, 2017-2029
- Figure 110:
- BREAKDOWN OF NMC BATTERY PACK MARKET, BY NICKEL, KG, GLOBAL, 2017 - 2029
- Figure 111:
- BREAKDOWN OF NMC BATTERY PACK MARKET, BY NICKEL, USD, GLOBAL, 2017 - 2029
- Figure 112:
- BREAKDOWN OF NMC BATTERY PACK MARKET, BODY TYPE, VALUE SHARE (%), GLOBAL, 2017-2029
- Figure 113:
- BREAKDOWN OF NMC BATTERY PACK MARKET, BY OTHER MATERIALS, KG, GLOBAL, 2017 - 2029
- Figure 114:
- BREAKDOWN OF NMC BATTERY PACK MARKET, BY OTHER MATERIALS, USD, GLOBAL, 2017 - 2029
- Figure 115:
- BREAKDOWN OF NMC BATTERY PACK MARKET, BODY TYPE, VALUE SHARE (%), GLOBAL, 2017-2029
- Figure 116:
- BREAKDOWN OF NMC BATTERY PACK MARKET, BY REGION, KWH, GLOBAL, 2017 - 2029
- Figure 117:
- BREAKDOWN OF NMC BATTERY PACK MARKET, BY REGION, USD, GLOBAL, 2017 - 2029
- Figure 118:
- BREAKDOWN OF NMC BATTERY PACK MARKET, REGION, VOLUME SHARE (%), GLOBAL, 2022 & 2029
- Figure 119:
- BREAKDOWN OF NMC BATTERY PACK MARKET, REGION, VALUE SHARE (%), GLOBAL, 2022 & 2029
- Figure 120:
- BREAKDOWN OF NMC BATTERY PACK MARKET, BY COUNTRY, KWH, GLOBAL, 2017 - 2029
- Figure 121:
- BREAKDOWN OF NMC BATTERY PACK MARKET, BY COUNTRY, USD, GLOBAL, 2017 - 2029
- Figure 122:
- BREAKDOWN OF NMC BATTERY PACK MARKET, COUNTRY, VOLUME SHARE (%), GLOBAL, 2022 & 2029
- Figure 123:
- BREAKDOWN OF NMC BATTERY PACK MARKET, COUNTRY, VALUE SHARE (%), GLOBAL, 2022 & 2029
- Figure 124:
- BREAKDOWN OF NMC BATTERY PACK MARKET, BY CHINA, KWH, GLOBAL, 2017 - 2029
- Figure 125:
- BREAKDOWN OF NMC BATTERY PACK MARKET, BY CHINA, USD, GLOBAL, 2017 - 2029
- Figure 126:
- BREAKDOWN OF NMC BATTERY PACK MARKET, BODY TYPE, VALUE SHARE (%), GLOBAL, 2017-2029
- Figure 127:
- BREAKDOWN OF NMC BATTERY PACK MARKET, BY INDIA, KWH, GLOBAL, 2017 - 2029
- Figure 128:
- BREAKDOWN OF NMC BATTERY PACK MARKET, BY INDIA, USD, GLOBAL, 2017 - 2029
- Figure 129:
- BREAKDOWN OF NMC BATTERY PACK MARKET, BODY TYPE, VALUE SHARE (%), GLOBAL, 2017-2029
- Figure 130:
- BREAKDOWN OF NMC BATTERY PACK MARKET, BY JAPAN, KWH, GLOBAL, 2017 - 2029
- Figure 131:
- BREAKDOWN OF NMC BATTERY PACK MARKET, BY JAPAN, USD, GLOBAL, 2017 - 2029
- Figure 132:
- BREAKDOWN OF NMC BATTERY PACK MARKET, BODY TYPE, VALUE SHARE (%), GLOBAL, 2017-2029
- Figure 133:
- BREAKDOWN OF NMC BATTERY PACK MARKET, BY SOUTH KOREA, KWH, GLOBAL, 2017 - 2029
- Figure 134:
- BREAKDOWN OF NMC BATTERY PACK MARKET, BY SOUTH KOREA, USD, GLOBAL, 2017 - 2029
- Figure 135:
- BREAKDOWN OF NMC BATTERY PACK MARKET, BODY TYPE, VALUE SHARE (%), GLOBAL, 2017-2029
- Figure 136:
- BREAKDOWN OF NMC BATTERY PACK MARKET, BY THAILAND, KWH, GLOBAL, 2017 - 2029
- Figure 137:
- BREAKDOWN OF NMC BATTERY PACK MARKET, BY THAILAND, USD, GLOBAL, 2017 - 2029
- Figure 138:
- BREAKDOWN OF NMC BATTERY PACK MARKET, BODY TYPE, VALUE SHARE (%), GLOBAL, 2017-2029
- Figure 139:
- BREAKDOWN OF NMC BATTERY PACK MARKET, BY REST-OF-ASIA-PACIFIC, KWH, GLOBAL, 2017 - 2029
- Figure 140:
- BREAKDOWN OF NMC BATTERY PACK MARKET, BY REST-OF-ASIA-PACIFIC, USD, GLOBAL, 2017 - 2029
- Figure 141:
- BREAKDOWN OF NMC BATTERY PACK MARKET, BODY TYPE, VALUE SHARE (%), GLOBAL, 2017-2029
- Figure 142:
- BREAKDOWN OF NMC BATTERY PACK MARKET, BY COUNTRY, KWH, GLOBAL, 2017 - 2029
- Figure 143:
- BREAKDOWN OF NMC BATTERY PACK MARKET, BY COUNTRY, USD, GLOBAL, 2017 - 2029
- Figure 144:
- BREAKDOWN OF NMC BATTERY PACK MARKET, COUNTRY, VOLUME SHARE (%), GLOBAL, 2022 & 2029
- Figure 145:
- BREAKDOWN OF NMC BATTERY PACK MARKET, COUNTRY, VALUE SHARE (%), GLOBAL, 2022 & 2029
- Figure 146:
- BREAKDOWN OF NMC BATTERY PACK MARKET, BY FRANCE, KWH, GLOBAL, 2017 - 2029
- Figure 147:
- BREAKDOWN OF NMC BATTERY PACK MARKET, BY FRANCE, USD, GLOBAL, 2017 - 2029
- Figure 148:
- BREAKDOWN OF NMC BATTERY PACK MARKET, BODY TYPE, VALUE SHARE (%), GLOBAL, 2017-2029
- Figure 149:
- BREAKDOWN OF NMC BATTERY PACK MARKET, BY GERMANY, KWH, GLOBAL, 2017 - 2029
- Figure 150:
- BREAKDOWN OF NMC BATTERY PACK MARKET, BY GERMANY, USD, GLOBAL, 2017 - 2029
- Figure 151:
- BREAKDOWN OF NMC BATTERY PACK MARKET, BODY TYPE, VALUE SHARE (%), GLOBAL, 2017-2029
- Figure 152:
- BREAKDOWN OF NMC BATTERY PACK MARKET, BY HUNGARY, KWH, GLOBAL, 2017 - 2029
- Figure 153:
- BREAKDOWN OF NMC BATTERY PACK MARKET, BY HUNGARY, USD, GLOBAL, 2017 - 2029
- Figure 154:
- BREAKDOWN OF NMC BATTERY PACK MARKET, BODY TYPE, VALUE SHARE (%), GLOBAL, 2017-2029
- Figure 155:
- BREAKDOWN OF NMC BATTERY PACK MARKET, BY ITALY, KWH, GLOBAL, 2017 - 2029
- Figure 156:
- BREAKDOWN OF NMC BATTERY PACK MARKET, BY ITALY, USD, GLOBAL, 2017 - 2029
- Figure 157:
- BREAKDOWN OF NMC BATTERY PACK MARKET, BODY TYPE, VALUE SHARE (%), GLOBAL, 2017-2029
- Figure 158:
- BREAKDOWN OF NMC BATTERY PACK MARKET, BY POLAND, KWH, GLOBAL, 2017 - 2029
- Figure 159:
- BREAKDOWN OF NMC BATTERY PACK MARKET, BY POLAND, USD, GLOBAL, 2017 - 2029
- Figure 160:
- BREAKDOWN OF NMC BATTERY PACK MARKET, BODY TYPE, VALUE SHARE (%), GLOBAL, 2017-2029
- Figure 161:
- BREAKDOWN OF NMC BATTERY PACK MARKET, BY SWEDEN, KWH, GLOBAL, 2017 - 2029
- Figure 162:
- BREAKDOWN OF NMC BATTERY PACK MARKET, BY SWEDEN, USD, GLOBAL, 2017 - 2029
- Figure 163:
- BREAKDOWN OF NMC BATTERY PACK MARKET, BODY TYPE, VALUE SHARE (%), GLOBAL, 2017-2029
- Figure 164:
- BREAKDOWN OF NMC BATTERY PACK MARKET, BY UK, KWH, GLOBAL, 2018 - 2029
- Figure 165:
- BREAKDOWN OF NMC BATTERY PACK MARKET, BY UK, USD, GLOBAL, 2018 - 2029
- Figure 166:
- BREAKDOWN OF NMC BATTERY PACK MARKET, BODY TYPE, VALUE SHARE (%), GLOBAL, 2017-2029
- Figure 167:
- BREAKDOWN OF NMC BATTERY PACK MARKET, BY REST-OF-EUROPE, KWH, GLOBAL, 2017 - 2029
- Figure 168:
- BREAKDOWN OF NMC BATTERY PACK MARKET, BY REST-OF-EUROPE, USD, GLOBAL, 2017 - 2029
- Figure 169:
- BREAKDOWN OF NMC BATTERY PACK MARKET, BODY TYPE, VALUE SHARE (%), GLOBAL, 2017-2029
- Figure 170:
- BREAKDOWN OF NMC BATTERY PACK MARKET, BY MIDDLE EAST & AFRICA, KWH, GLOBAL, 2017 - 2029
- Figure 171:
- BREAKDOWN OF NMC BATTERY PACK MARKET, BY MIDDLE EAST & AFRICA, USD, GLOBAL, 2017 - 2029
- Figure 172:
- BREAKDOWN OF NMC BATTERY PACK MARKET, BODY TYPE, VALUE SHARE (%), GLOBAL, 2017-2029
- Figure 173:
- BREAKDOWN OF NMC BATTERY PACK MARKET, BY COUNTRY, KWH, GLOBAL, 2017 - 2029
- Figure 174:
- BREAKDOWN OF NMC BATTERY PACK MARKET, BY COUNTRY, USD, GLOBAL, 2017 - 2029
- Figure 175:
- BREAKDOWN OF NMC BATTERY PACK MARKET, COUNTRY, VOLUME SHARE (%), GLOBAL, 2022 & 2029
- Figure 176:
- BREAKDOWN OF NMC BATTERY PACK MARKET, COUNTRY, VALUE SHARE (%), GLOBAL, 2022 & 2029
- Figure 177:
- BREAKDOWN OF NMC BATTERY PACK MARKET, BY CANADA, KWH, GLOBAL, 2017 - 2029
- Figure 178:
- BREAKDOWN OF NMC BATTERY PACK MARKET, BY CANADA, USD, GLOBAL, 2017 - 2029
- Figure 179:
- BREAKDOWN OF NMC BATTERY PACK MARKET, BODY TYPE, VALUE SHARE (%), GLOBAL, 2017-2029
- Figure 180:
- BREAKDOWN OF NMC BATTERY PACK MARKET, BY US, KWH, GLOBAL, 2017 - 2029
- Figure 181:
- BREAKDOWN OF NMC BATTERY PACK MARKET, BY US, USD, GLOBAL, 2017 - 2029
- Figure 182:
- BREAKDOWN OF NMC BATTERY PACK MARKET, BODY TYPE, VALUE SHARE (%), GLOBAL, 2017-2029
- Figure 183:
- BREAKDOWN OF NMC BATTERY PACK MARKET, BY SOUTH AMERICA, KWH, GLOBAL, 2017 - 2029
- Figure 184:
- BREAKDOWN OF NMC BATTERY PACK MARKET, BY SOUTH AMERICA, USD, GLOBAL, 2017 - 2029
- Figure 185:
- BREAKDOWN OF NMC BATTERY PACK MARKET, BODY TYPE, VALUE SHARE (%), GLOBAL, 2017-2029
- Figure 186:
- NMC BATTERY PACK MARKET, MOST ACTIVE COMPANIES, BY NUMBER OF STRATEGIC MOVES, 2020 - 2022
- Figure 187:
- NMC BATTERY PACK MARKET, MOST ADOPTED STRATEGIES, 2020 - 2022
- Figure 188:
- NMC BATTERY PACK MARKET SHARE(%), BY MAJOR PLAYER REVENUE, 2022
NMC Battery Pack Industry Segmentation
Bus, LCV, M&HDT, Passenger Car are covered as segments by Body Type. BEV, PHEV are covered as segments by Propulsion Type. 15 kWh to 40 kWh, 40 kWh to 80 kWh, Above 80 kWh, Less than 15 kWh are covered as segments by Capacity. Cylindrical, Pouch, Prismatic are covered as segments by Battery Form. Laser, Wire are covered as segments by Method. Anode, Cathode, Electrolyte, Separator are covered as segments by Component. Cobalt, Lithium, Manganese, Natural Graphite, Nickel are covered as segments by Material Type. Asia-Pacific, Europe, Middle East & Africa, North America, South America are covered as segments by Region.| Body Type | Bus | |||
| LCV | ||||
| M&HDT | ||||
| Passenger Car | ||||
| Propulsion Type | BEV | |||
| PHEV | ||||
| Capacity | 15 kWh to 40 kWh | |||
| 40 kWh to 80 kWh | ||||
| Above 80 kWh | ||||
| Less than 15 kWh | ||||
| Battery Form | Cylindrical | |||
| Pouch | ||||
| Prismatic | ||||
| Method | Laser | |||
| Wire | ||||
| Component | Anode | |||
| Cathode | ||||
| Electrolyte | ||||
| Separator | ||||
| Material Type | Cobalt | |||
| Lithium | ||||
| Manganese | ||||
| Natural Graphite | ||||
| Nickel | ||||
| Other Materials | ||||
| Region | Asia-Pacific | By Country | China | |
| India | ||||
| Japan | ||||
| South Korea | ||||
| Thailand | ||||
| Rest-of-Asia-Pacific | ||||
| Europe | By Country | France | ||
| Germany | ||||
| Hungary | ||||
| Italy | ||||
| Poland | ||||
| Sweden | ||||
| UK | ||||
| Rest-of-Europe | ||||
| Middle East & Africa | ||||
| North America | By Country | Canada | ||
| US | ||||
| South America | ||||
Need A Different Region or Segment?
Customize Now
Market Definition
- Battery Chemistry - NCM battery type is considred under the scope of battery chemistry.
- Battery Form - The types of battery forms offered under this segment include Cylindrical, Pouch and Prismatic.
- Body Type - Body types considered under this segment include, passenger cars, LCV (light commercial vehicle), M&HDT (medium & heavy duty trucks)and buses.
- Capacity - Various types of battery capacities inldude under theis segment are 15 kWH to 40 kWH, 40 kWh to 80 kWh, Above 80 kWh and Less than 15 kWh.
- Component - Various components covered under this segment include anode, cathode, electrolyte, separator.
- Material Type - Various material covered under this segment include cobalt, lithium, manganese, natural graphite, nickel, other material.
- Method - The types of method covered under this segment include laser and wire.
- Propulsion Type - Propulsion types considered under this segment include BEV (Battery electric vehicles), PHEV (plug-in hybrid electric vehicle).
- ToC Type - ToC 4
- Vehicle Type - Vehicle type considered under this segment include passenger vehicles, and commercial vehicles with various EV powertrains.
| Keyword | Definition |
|---|---|
| Electric vehicle (EV) | A vehicle which uses one or more electric motors for propulsion. Includes cars, buses, and trucks. This term includes all-electric vehicles or battery electric vehicles and plug-in hybrid electric vehicles. |
| PEV | A plug-in electric vehicle is an electric vehicle that can be externally charged and generally includes all electric vehicles as well as plug-electric vehicles as well as plug-in hybrids. |
| Battery-as-a-Service | A business model in which the battery of an EV can be rented from a service provider or swapped with another battery when it runs out of charge |
| Battery Cell | The basic unit of an electric vehicle's battery pack, typically a lithium-ion cell, that stores electrical energy. |
| Module | A subsection of an EV battery pack, consisting of several cells grouped together, often used to facilitate manufacturing and maintenance. |
| Battery Management System (BMS) | An electronic system that manages a rechargeable battery by protecting the battery from operating outside its safe operating area, monitoring its state, calculating secondary data, reporting data, controlling its environment, and balancing it. |
| Energy Density | A measure of how much energy a battery cell can store in a given volume, usually expressed in watt-hours per liter (Wh/L). |
| Power Density | The rate at which energy can be delivered by the battery, often measured in watts per kilogram (W/kg). |
| Cycle Life | The number of complete charge-discharge cycles a battery can perform before its capacity falls under a specified percentage of its original capacity. |
| State of Charge (SOC) | A measurement, expressed as a percentage, that represents the current level of charge in a battery compared to its capacity. |
| State of Health (SOH) | An indicator of the overall condition of a battery, reflecting its current performance compared to when it was new. |
| Thermal Management System | A system designed to maintain optimal operating temperatures for an EV's battery pack, often using cooling or heating methods. |
| Fast Charging | A method of charging an EV battery at a much faster rate than standard charging, typically requiring specialized charging equipment. |
| Regenerative Braking | A system in electric and hybrid vehicles that recovers energy normally lost during braking and stores it in the battery. |
Need More Details on Market Definition?
Ask a Question
Research Methodology
Mordor Intelligence follows a four-step methodology in all its reports.
- Step-1: Identify Key Variables: To build a robust forecasting methodology, the variables and factors identified in Step-1 are tested against available historical market numbers. Through an iterative process, the variables required for market forecast are set and the model is built based on these variables.
- Step-2: Build a Market Model: Market-size estimations for the historical and forecast years have been provided in revenue and volume terms. Market revenue is calculated by multiplying the volume demand with volume-weighted average battery pack price (per kWh). Battery pack price estimation and forecast takes into account various factors affecting ASP, such as inflation rates, market demand shifts, production costs, technological developments, and consumer preferences, providing estimations for both historical data and future trends.
- Step-3: Validate and Finalize: In this important step, all market numbers, variables, and analyst calls are validated through an extensive network of primary research experts from the market studied. The respondents are selected across levels and functions to generate a holistic picture of the market studied.
- Step-4: Research Outputs: Syndicated Reports, Custom Consulting Assignments, Databases & Subscription Platforms

Get More Details On Research Methodology
Download PDF


