Nitrogenous Fertilizers Market Size and Share
Market Overview
| Study Period | 2020 - 2030 |
|---|---|
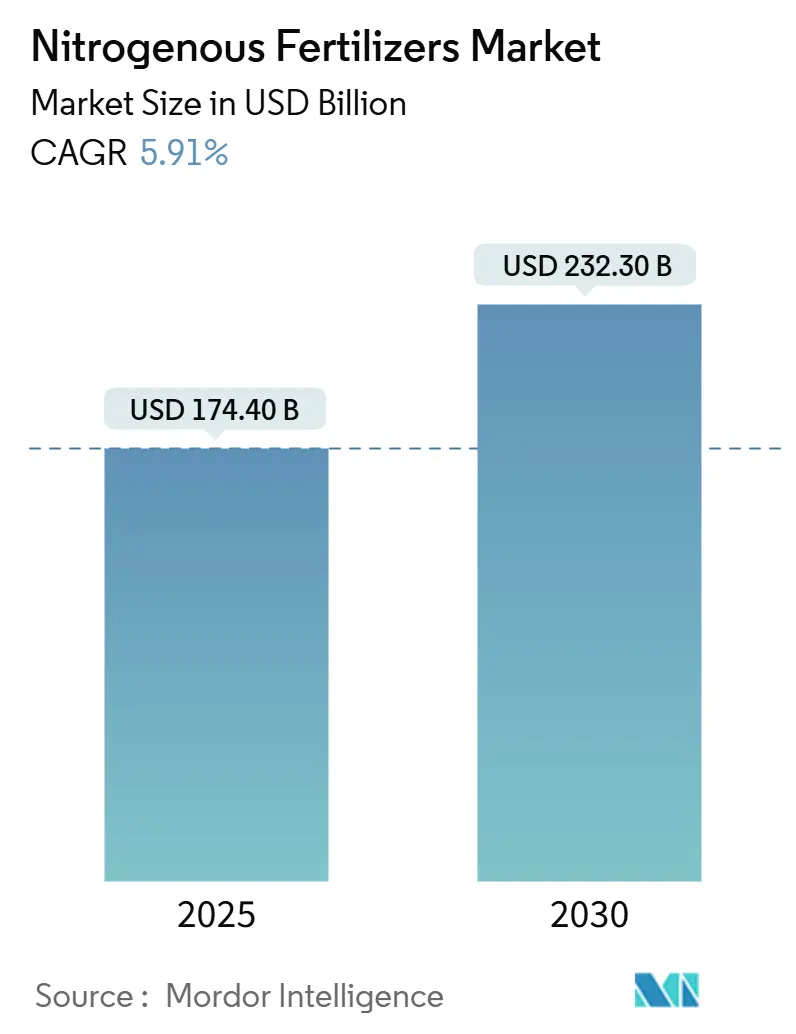
| Market Size (2025) | USD 174.40 Billion |
| Market Size (2030) | USD 232.30 Billion |
| Growth Rate (2025 - 2030) | 5.91% CAGR |
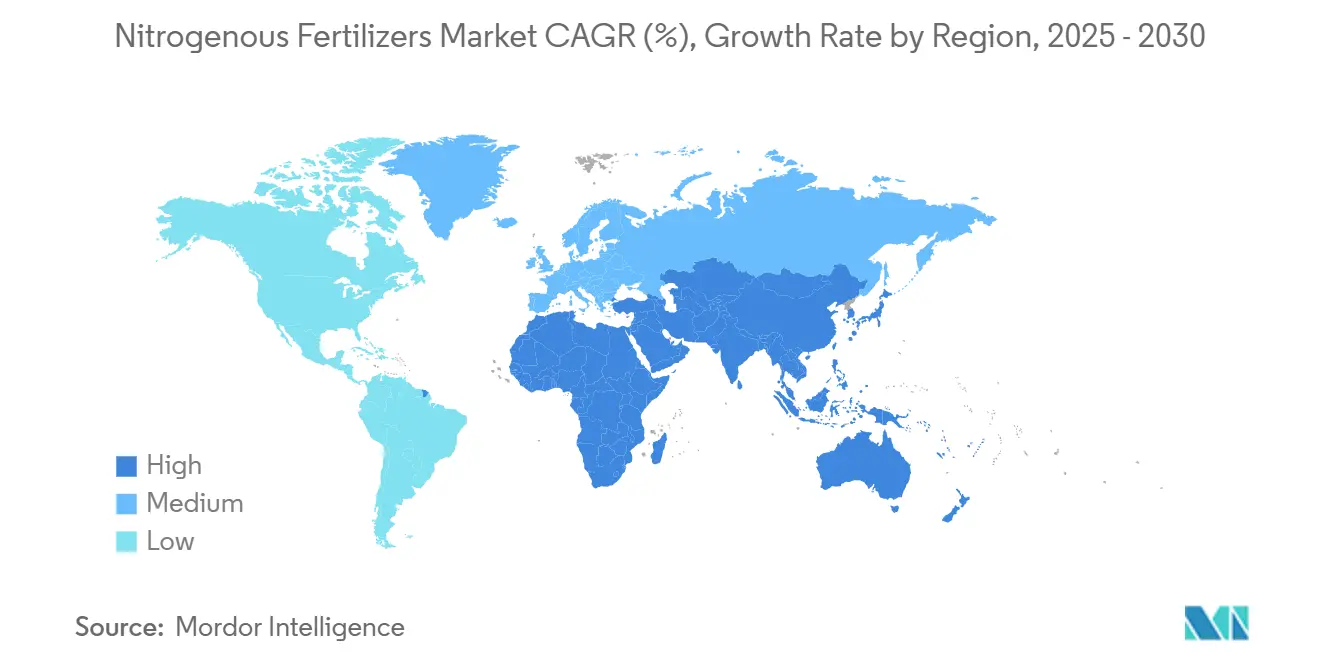
| Fastest Growing Market | Middle East |
| Largest Market | Asia-Pacific |
| Market Concentration | Low |
Major Players
*Disclaimer: Major Players sorted in no particular order Image © Mordor Intelligence. Reuse requires attribution under CC BY 4.0. |
|
Nitrogenous Fertilizers Market Analysis by Mordor Intelligence
The nitrogenous fertilizers market size is projected to reach USD 174.4 billion by 2025, with a CAGR of 5.91%, and is anticipated to reach USD 232.3 billion by 2030. This growth is attributed to rising global food demand, advancements in farming practices, and innovations in nutrient management. Government support through subsidies and policy measures remains a critical factor. For instance, the European Commission has suspended tariffs on urea and ammonia until the end of 2024 to ensure the availability, affordability, and sustainability of fertilizers amid supply chain disruptions. Regionally, Asia-Pacific dominates the market due to its extensive agricultural activity, robust government support, and increasing adoption of precision farming technologies. The competitive landscape comprises both global and regional players, while global companies are focusing on capacity expansion, feedstock diversification, and the adoption of low-carbon technologies. Meanwhile, regional producers and specialty suppliers are gaining market share through localized distribution, customized product offerings, and collaborations with agricultural technology platforms. The nitrogenous fertilizers market is evolving into a technology-driven and regionally adaptive industry, offering significant opportunities for innovation and strategic growth across the value chain.[1]Source: United Nations Department of Economic and Social Affairs, “World Population Prospects 2022,” UN.org
Key Report Takeaways
- By product, urea led with 43.7% of the nitrogenous fertilizers market share in 2024,and is projected to grow at a 6.98% CAGR through 2030.
- By form, conventional fertilizers dominated with 92.4% of the nitrogenous fertilizers market size and are forecasted to expand at the fastest rate of 5.91% CAGR through 2030.
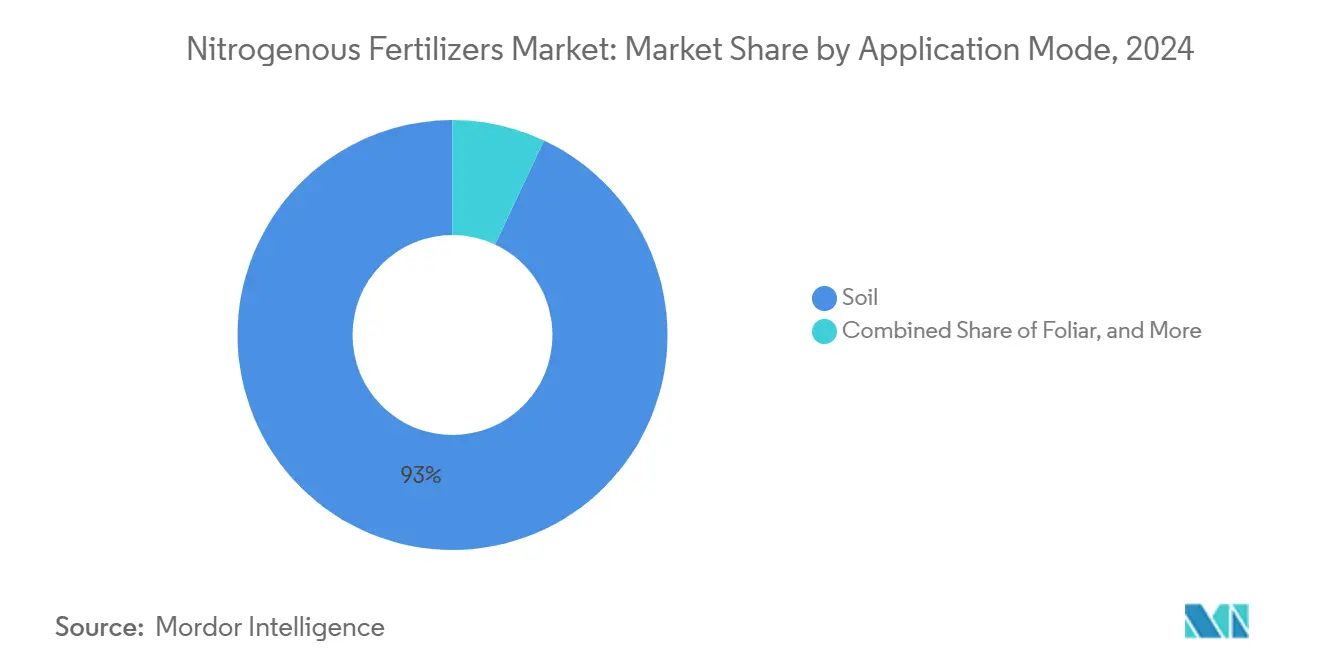
- By application Mode, soil application led with 93.0% of the nitrogenous fertilizers market size in 2024, and is projected to grow at a 5.92% CAGR through 2030.
- By crop Type, field crops accounted for 82.6% of the nitrogenous fertilizers market size in 2024, while horticultural crops are predicted to grow fastest at a 7.73% CAGR through 2030.
- By geography, Asia-Pacific led with 35.8% of the nitrogenous fertilizers market size in 2024, while the Middle East is advancing at a 7.13% CAGR through 2030.
Global Nitrogenous Fertilizers Market Trends and Insights
Drivers Impact Analysis
| Driver | (~) % Impact on CAGR Forecast | Geographic Relevance | Impact Timeline |
|---|---|---|---|
| Rising Demand for Staple Crops | +1.2% | Global, with concentration in Asia-Pacific and Africa | Medium term (2-4 years) |
| Sustained Government Support for Agricultural Inputs | +0.8% | Global, particularly India, Brazil, and Sub-Saharan Africa | Long term (≥ 4 years) |
| Diversification of Ammonia Supply Sources | +0.7% | Global, with focus on Middle East and North America | Long term (≥ 4 years) |
| Optimization of Urea Production Capacity | +0.6% | Asia-Pacific, Middle East, and North America | Medium term (2-4 years) |
| Acceleration of Green Ammonia Pilot Projects | +0.5% | Europe, Middle East, and developed markets | Long term (≥ 4 years) |
| Adoption of Digital Advisory Platforms for Nitrogen Use | +0.4% | North America, Europe, and emerging markets | Short term (≤ 2 years) |
| Source: Mordor Intelligence | |||
Rising Demand for Staple Crops
Global population growth is intensifying the demand for food, placing mounting pressure on agricultural systems to deliver higher yields from limited land. As the world's population is projected to reach 9.7 billion by 2050, food production must increase by approximately 70% to meet the growing nutritional needs of this population.[2]Source: Food and Agriculture Organization, “How to Feed the World in 2050,” fao.org This surge in demand is reshaping farming practices, encouraging greater use of nitrogenous fertilizers to boost crop output and stabilize yields amid climate variability. Rising incomes, particularly in developing regions, are shifting dietary preferences toward protein-rich grains, prompting the intensified cultivation of crops like wheat and rice, which require higher nitrogen fertilizer application rates. Climate variability further underscores the need for consistent yields, encouraging the strategic use of fertilizers to stabilize output. In many regions, multiple-cropping systems, which involve rotating maize, soybeans, and rice within a single year, are increasing fertilizer use per hectare. This trend reflects a focus on maximizing productivity on existing farmland rather than expanding acreage.
Sustained Government Support for Agricultural Inputs
Governments worldwide recognize the importance of affordable plant nutrients for rural stability and food security. Many have expanded support programs, including direct input grants, freight rebates, and low-interest loans, to ensure reliable access to fertilizers for farmers. India has increased its fertilizer subsidy budget to INR 1.75 trillion (approximately USD 21 billion) for the fiscal year 2024-25, ensuring continued access for farmers despite fiscal constraints.[3]Source: Ministry of Chemicals and Fertilizers, “Fertilizer Subsidy Budget 2024-25,” fert.nic.in Brazil’s Plano Safra 2024-25 earmarked BRL 400 billion (USD 75 billion) in credit to support fertilizer procurement. These initiatives signal strong demand to the private sector, encouraging investment in production capacity, distribution infrastructure, and innovation. Some governments are promoting domestic ammonia production to reduce their dependency on imports and strengthen their supply chains. This policy shift aims to build long-term resilience in them to fertilizer availability beyond price controls.
Diversification of Ammonia Supply Sources
Recent geopolitical disruptions have underscored the risks associated with relying on a limited number of ammonia exporters. In response, importing nations are diversifying supply chains by developing alternative trade corridors and investing in local production facilities. Producers in energy-rich regions have expanded their capacity to serve global markets, while others have approved new downstream units that leverage domestic resources. Modular ammonia technologies are also gaining traction, enabling decentralized production closer to consumption zones. This diversification reduces vulnerability to regional disruptions and stabilizes prices by minimizing reliance on single-source suppliers. In major fertilizer-consuming countries, such as the United States, diversification strategies are becoming central to long-term planning. These efforts support the nitrogenous fertilizers market by ensuring consistent availability and mitigating supply shocks.
Optimization of Urea Production Capacity
Fertilizer producers are increasingly focusing on maximizing output from existing assets rather than building new facilities. Through process improvements, energy efficiency upgrades, and digital technologies, companies are enhancing production capacity and reliability. Advanced control systems and predictive maintenance tools are enabling plants to operate more consistently, reduce downtime, and lower operating costs. These advancements reinforce urea’s position as the leading product in the nitrogenous fertilizers market, offering high nitrogen content and broad crop applicability. In key markets, such as the United States, producers are adopting digital twins and automation to fine-tune operations and achieve incremental gains. This approach enables capacity expansion without the risks and costs associated with building new facilities. As a result, the nitrogenous fertilizers market continues to grow, supported by more efficient production and supply reliability.
Restraints Impact Analysis
| Restraint | (~) % Impact on CAGR Forecast | Geographic Relevance | Impact Timeline |
|---|---|---|---|
| Volatility in Natural Gas Prices | -0.9% | Global, particularly Europe and Asia-Pacific | Short term (≤ 2 years) |
| Tightening Environmental Regulations | -0.6% | Europe, North America, and developed markets | Medium term (2-4 years) |
| Logistical Bottlenecks in Fertilizer Trade | -0.4% | Global, with focus on import-dependent regions | Short term (≤ 2 years) |
| Emergence of Biological Nitrogen-Fixation Alternatives | -0.3% | North America, Europe, and Brazil | Long term (≥ 4 years) |
| Source: Mordor Intelligence | |||
Tightening Environmental Regulations
Environmental policies aimed at reducing nutrient runoff and greenhouse gas emissions are reshaping global fertilizer usage. Governments are implementing stricter regulations on application timing, dosage, and product formulations to protect ecosystems and water sources. In regions like the United States, nitrate caps and sustainability benchmarks are becoming increasingly common, prompting farmers to adopt precision methods and more efficient fertilizers. These changes are driving innovation in product development and application technologies, aligning fertilizer use with environmental goals. As regulations tighten, the nitrogenous fertilizers market will increasingly reflect the adoption of advanced products that deliver agronomic performance with reduced environmental impact. This transition represents a significant shift for the industry, striking a balance between productivity and environmental stewardship.
Emergence of Biological Nitrogen-Fixation Alternatives
Biological nitrogen-fixation technologies are emerging as sustainable alternatives to synthetic fertilizers. Microbial inoculants that supply nitrogen directly to crops are gaining traction among farmers seeking to reduce input costs and environmental impact. In agricultural regions like the United States, these solutions are showing promising results, particularly in corn and soybean cultivation. While adoption remains limited compared to conventional fertilizers, improvements in efficacy and growing interest in regenerative agriculture are accelerating their uptake. These innovations could gradually reshape the nitrogenous fertilizers market, especially in high-value crop segments where sustainability is a priority. As biological products become more competitive, the nitrogenous fertilizers market may shift toward blended approaches that combine synthetic and biological inputs. This evolution reflects broader trends in agriculture, where innovation and environmental responsibility are driving the next generation of nutrient management.
Segment Analysis
By Product: Urea Dominance Drives Market Stability
Urea accounted for 43.7% of the nitrogenous fertilizers market share in 2024, with the segment projected to post a 6.98% CAGR to 2030 as growers value its 46% nitrogen concentration and flexible application. Urea’s cost advantage and compatibility with both soil incorporation and fertigation underpin its position across large-scale grain systems. Producers are upgrading plants with energy-saving catalysts and emission control units, reinforcing supply security at competitive costs. Continuous investment, such as CF Industries’ Donaldsonville expansion, enhances regional self-sufficiency and export capability, sustaining urea’s leadership in the nitrogen fertilizer market.
Specialty grades are gaining traction in irrigated horticulture and high-value cash crops, where precise nutrient delivery translates into revenue gains. Ammonium nitrate remains relevant in geographies with established regulations and storage infrastructure, while anhydrous ammonia serves direct injection systems in North American row crops. As environmental scrutiny rises, demand for low-volatility or coated products is set to escalate, adding diversity without displacing urea’s central role.

Note: Segment shares of all individual segments available upon report purchase
By Form: Conventional Products Maintain Market Leadership
Conventional fertilizers retained a 92.4% share of the nitrogenous fertilizers market size in 2024, expanding at a 5.91% CAGR during the forecast period, broadly in line with overall demand, as global acreage growth and price sensitivity favor bulk granular products. Large centralized plants benefit from economies of scale, which keep unit costs low and ensure competitiveness in developing markets. Widespread dealer networks and farmer familiarity also reinforce the dominance of conventional forms in broad-acre cropping sectors.
Specialty fertilizers represent a smaller segment, led by controlled-release and slow-release technologies that enhance nutrient-use efficiency and minimize environmental losses. Liquid solutions used in fertigation and hydroponic systems broaden application flexibility in water-constrained regions. Water-soluble grades cater to greenhouse operations seeking precise nutrient regimes. Though premium-priced, specialty forms achieve strong adoption where returns justify higher upfront costs, particularly in protected cropping and intensive fruit and vegetable production, promising incremental gains for the nitrogen fertilizer market.
By Application Mode: Soil Application Dominates Usage Patterns
Soil application accounted for 93.0% of the nitrogenous fertilizers market share in 2024 and is forecasted to grow at a 5.92% CAGR through 2030. Farmers rely on broadcast, banded, or knife-injection methods that integrate seamlessly with existing machinery, minimizing additional capital outlays. Research on optimal placement and timing continually refines practice guidelines, supporting consistent yield responses across varied soil types. Soil incorporation also reduces volatilization losses, improving cost effectiveness.
Fertigation is also one of the important methods, expanding from a smaller base as irrigation investments surge in arid regions and the prices of precision technology fall. The ability to spoon-feed nutrients during critical phenological stages enhances uptake efficiency, especially for high-value crops. Variable-rate pivots and drip systems integrate real-time sensor data for dynamic dosing, reducing runoff and aligning with environmental regulations. Foliar sprays play a specialized role in remedying in-season deficiencies or mitigating stress, but they complement, rather than replace, core soil and fertigation practices.
Note: Segment shares of all individual segments available upon report purchase
By Crop Type: Field Crops Drive Volume Demand
Field crops consumed 82.6% of all nitrogen applied in 2024 due to the extensive acreage devoted to cereals and oilseeds that underpin global caloric supply. Government support programs, reliable commodity offtake, and well-established extension services facilitate steady fertilizer demand across vast grain belts in the Asia Pacific, North America, and Europe. Economies of scale, standardized equipment, and predictable agronomy keep field crops central to the nitrogen fertilizer market, ensuring a baseline level of volume stability.
Horticultural crops, although smaller in tonnage, exhibit the highest growth rate at 7.73% CAGR, as consumers shift toward diets rich in fruits and vegetables and urban populations demand a year-round supply. Intensive greenhouse and protected cultivation increase nutrient requirements per hectare, necessitating the use of specialty fertilizers and precision delivery systems. Higher crop value per acre allows growers to adopt coated or liquid formulations that minimize losses and enhance quality. Turf and ornamentals maintain steady demand in developed regions with professional landscaping sectors, although they face increasing environmental scrutiny that encourages the use of low-runoff products.
Geography Analysis
The Asia-Pacific region captured 35.8% of the revenue in 2024 of the nitrogenous fertilizers market size, reflecting its vast agricultural land, high cropping intensity, and supportive subsidy frameworks. China’s emphasis on food security and India’s modernization of smallholder farming guarantee robust baseline demand. Rising adoption of multiple-cropping systems and higher-yielding hybrids requires sustained nitrogen input, and domestic production capacity limits import exposure for many regional players. Emerging Southeast Asian economies are experiencing incremental growth as they intensify palm, rice, and vegetable cultivation to meet the needs of expanding urban centers.
The Middle East delivers the fastest growth at 7.13% CAGR through 2030, leveraging abundant gas feedstock and proximity to shipping lanes that connect Asia and Africa. Large-scale investments in blue and green ammonia plants by ADNOC, SABIC, and Fertiglobe aim to supply both domestic agricultural projects and export markets. Government policies favor agricultural diversification to reduce import dependence, boosting internal consumption of nitrogen fertilizers. Integration of carbon capture solutions in new plants positions the region as a low-emission supplier, strengthening its competitive edge.
North America and Europe maintain mature yet evolving markets. North American producers benefit from shale gas economics that support export competitiveness, while adoption of precision agriculture sustains incremental volume growth. Europe’s stringent environmental policy constrains tonnage but spurs demand for enhanced-efficiency products and digital advisory services that align with Farm to Fork objectives. South America grows on the back of Brazilian frontier expansion and Argentine yield recovery, whereas Africa represents long-run potential as infrastructure, credit access, and extension services improve fertilizer penetration.
Competitive Landscape
The nitrogenous fertilizers market share remains fragmented, characterized by a mix of global players and strong regional producers. Local advantages, such as feedstock availability and transportation infrastructure, limit the full-scale consolidation of the industry, allowing domestic companies to compete effectively alongside multinational firms. Cross-border partnerships and joint ventures are becoming more prevalent, enabling firms to manage risks and expand into new markets.
Strategic priorities in the nitrogenous fertilizers industry are increasingly focused on sustainability, capacity expansion, and digital transformation. Companies are making significant investments in low-carbon ammonia production, reflecting a long-term commitment to environmentally friendly inputs. In addition, digital agronomy platforms and precision tools are being deployed to differentiate offerings and provide tailored nutrient recommendations. These technologies also generate valuable data that can guide future product development. Collectively, these factors are reshaping competition, positioning companies to capture greater market share through innovation and customer-focused strategies.
Innovation in logistics and storage has become a critical focus for fertilizer producers, who aim to manage costs and improve supply chain resilience. Companies are investing in specialized transport solutions and upgrading energy systems to enhance operational efficiency. As environmental regulations become increasingly stringent, compliance with global standards is essential for maintaining market access. This has driven continuous investment in monitoring technologies and mitigation practices aligned with sustainability objectives. In this evolving landscape, operational excellence and regulatory alignment are crucial for maintaining a strong market share in the nitrogenous fertilizers sector.
Nitrogenous Fertilizers Industry Leaders
-
CF Industries Holdings, Inc.
-
EuroChem Group
-
Nutrien Ltd.
-
SABIC Agri-Nutrients Co.
-
Yara International ASA
- *Disclaimer: Major Players sorted in no particular order
Recent Industry Developments
- September 2024: Grupa Azoty S.A. has introduced RSM OPTIMA, an enhanced urea-ammonium nitrate solution fortified with micronutrients like copper, boron, and molybdenum, aiming to improve nutrient precision and product integrity. This innovation strengthens the company’s position in the nitrogenous fertilizers market by addressing quality concerns and offering a differentiated, traceable solution.
- April 2024: OCI Global and COMPO EXPERT have partnered to integrate lower-carbon ammonia into nitrogenous fertilizer production, marking a shift toward more sustainable nitrogen inputs. This collaboration supports the transition of the nitrogenous fertilizers market to low-emission solutions, aligning with global sustainability goals and evolving regulatory expectations.
- April 2023: SABIC Agri-Nutrients Company acquired the ETC Group (ETG) with a 49% stake in the ETG Inputs Holdco Limited for a transaction value of USD 320 million. The agreement is part of SABIC Agri-Nutrients Company's strategy to integrate the value chain and distribution of nitrogenous fertilizers markets.
Global Nitrogenous Fertilizers Market Report Scope
Ammonium Nitrate, Anhydrous Ammonia, Urea, Others are covered as segments by Product. Conventional, Speciality are covered as segments by Form. Fertigation, Foliar, Soil are covered as segments by Application Mode. Field Crops, Horticultural Crops, Turf & Ornamental are covered as segments by Crop Type. Asia-Pacific, Europe, Middle East & Africa, North America, South America are covered as segments by Region.| Ammonium Nitrate |
| Anhydrous Ammonia |
| Urea |
| Others |
| Conventional | |
| Speciality | CRF |
| Liquid Fertilizer | |
| SRF | |
| Water Soluble |
| Fertigation |
| Foliar |
| Soil |
| Field Crops |
| Horticultural Crops |
| Turf & Ornamental |
| Asia-Pacific | Australia |
| Bangladesh | |
| China | |
| India | |
| Indonesia | |
| Japan | |
| Pakistan | |
| Philippines | |
| Thailand | |
| Vietnam | |
| Rest of Asia-Pacific | |
| Europe | France |
| Germany | |
| Italy | |
| Netherlands | |
| Russia | |
| Spain | |
| Ukraine | |
| United Kingdom | |
| Rest of Europe | |
| Middle East | Turkey |
| Saudi Arabia | |
| Rest of Middle East | |
| Africa | South Africa |
| Nigeria | |
| Rest of Africa | |
| North America | Canada |
| Mexico | |
| United States | |
| Rest of North America | |
| South America | Argentina |
| Brazil | |
| Rest of South America |
| Product | Ammonium Nitrate | |
| Anhydrous Ammonia | ||
| Urea | ||
| Others | ||
| Form | Conventional | |
| Speciality | CRF | |
| Liquid Fertilizer | ||
| SRF | ||
| Water Soluble | ||
| Application Mode | Fertigation | |
| Foliar | ||
| Soil | ||
| Crop Type | Field Crops | |
| Horticultural Crops | ||
| Turf & Ornamental | ||
| Region | Asia-Pacific | Australia |
| Bangladesh | ||
| China | ||
| India | ||
| Indonesia | ||
| Japan | ||
| Pakistan | ||
| Philippines | ||
| Thailand | ||
| Vietnam | ||
| Rest of Asia-Pacific | ||
| Europe | France | |
| Germany | ||
| Italy | ||
| Netherlands | ||
| Russia | ||
| Spain | ||
| Ukraine | ||
| United Kingdom | ||
| Rest of Europe | ||
| Middle East | Turkey | |
| Saudi Arabia | ||
| Rest of Middle East | ||
| Africa | South Africa | |
| Nigeria | ||
| Rest of Africa | ||
| North America | Canada | |
| Mexico | ||
| United States | ||
| Rest of North America | ||
| South America | Argentina | |
| Brazil | ||
| Rest of South America | ||
Market Definition
- MARKET ESTIMATION LEVEL - Market Estimations for various types of fertilizers has been done at the product-level and not at the nutrient-level.
- NUTRIENT TYPES COVERED - All Nitrogenous Fertilizers
- AVERAGE NUTRIENT APPLICATION RATE - This refers to the average volume of nutrient consumed per hectare of farmland in each country.
- CROP TYPES COVERED - Field Crops: Cereals, Pulses, Oilseeds, and Fiber Crops Horticulture: Fruits, Vegetables, Plantation Crops and Spices, Turf Grass and Ornamentals
| Keyword | Definition |
|---|---|
| Fertilizer | Chemical substance applied to crops to ensure nutritional requirements, available in various forms such as granules, powders, liquid, water soluble, etc. |
| Specialty Fertilizer | Used for enhanced efficiency and nutrient availability applied through soil, foliar, and fertigation. Includes CRF, SRF, liquid fertilizer, and water soluble fertilizers. |
| Controlled-Release Fertilizers (CRF) | Coated with materials such as polymer, polymer-sulfur, and other materials such as resins to ensure nutrient availability to the crop for its entire life cycle. |
| Slow-Release Fertilizers (SRF) | Coated with materials such as sulfur, neem, etc., to ensure nutrient availability to the crop for a longer period. |
| Foliar Fertilizers | Consist of both liquid and water soluble fertilizers applied through foliar application. |
| Water-Soluble Fertilizers | Available in various forms including liquid, powder, etc., used in foliar and fertigation mode of fertilizer application. |
| Fertigation | Fertilizers applied through different irrigation systems such as drip irrigation, micro irrigation, sprinkler irrigation, etc. |
| Anhydrous Ammonia | Used as fertilizer, directly injected into the soil, available in gaseous liquid form. |
| Single Super Phosphate (SSP) | Phosphorus fertilizer containing only phosphorus which has lesser than or equal to 35%. |
| Triple Super Phosphate (TSP) | Phosphorus fertilizer containing only phosphorus greater than 35%. |
| Enhanced Efficiency Fertilizers | Fertilizers coated or treated with additional layers of various ingredients to make it more efficient compared to other fertilizers. |
| Conventional Fertilizer | Fertilizers applied to crops through traditional methods including broadcasting, row placement, ploughing soil placement, etc. |
| Chelated Micronutrients | Micronutrient fertilizers coated with chelating agents such as EDTA, EDDHA, DTPA, HEDTA, etc. |
| Liquid Fertilizers | Available in liquid form, majorly used for application of fertilizers to crops through foliar and fertigation. |
Research Methodology
Mordor Intelligence follows a four-step methodology in all our reports.
- Step-1: IDENTIFY KEY VARIABLES: In order to build a robust forecasting methodology, the variables and factors identified in Step-1 are tested against available historical market numbers. Through an iterative process, the variables required for market forecast are set and the model is built on the basis of these variables.
- Step-2: Build a Market Model: Market-size estimations for the forecast years are in nominal terms. Inflation is not a part of the pricing, and the average selling price (ASP) is kept constant throughout the forecast period for each country.
- Step-3: Validate and Finalize: In this important step, all market numbers, variables and analyst calls are validated through an extensive network of primary research experts from the market studied. The respondents are selected across levels and functions to generate a holistic picture of the market studied.
- Step-4: Research Outputs: Syndicated Reports, Custom Consulting Assignments, Databases & Subscription Platforms


