
Nitrile Butadiene Rubber (NBR) Market Size and Share
Market Overview
| Study Period | 2021 - 2031 |
|---|---|
| Market Volume (2026) | 1.23 Million tons |
| Market Volume (2031) | 1.49 Million tons |
| Growth Rate (2026 - 2031) | 3.91 % |
| Fastest Growing Market | Asia Pacific |
| Largest Market | Asia Pacific |
| Market Concentration | Medium |
Major Players *Disclaimer: Major Players sorted in no particular order Image © Mordor Intelligence. Reuse requires attribution under CC BY 4.0. | |
Nitrile Butadiene Rubber (NBR) Market Analysis by Mordor Intelligence
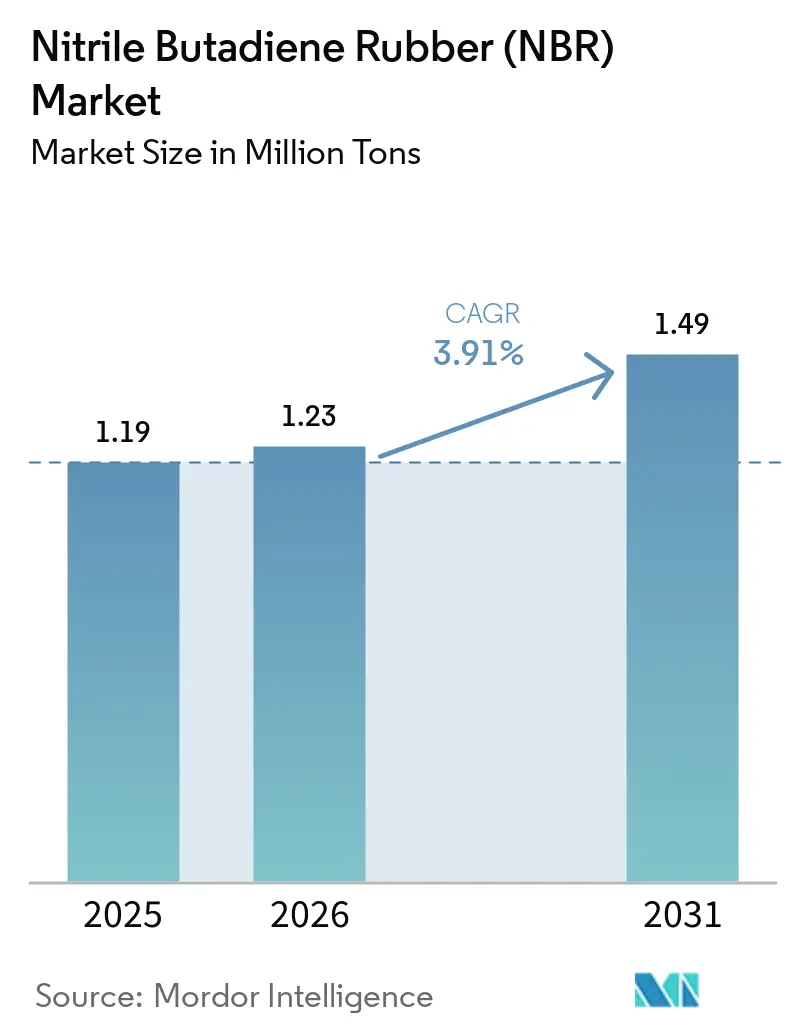
The Nitrile Butadiene Rubber Market size was valued at 1.19 million tons in 2025 and is estimated to grow from 1.23 million tons in 2026 to reach 1.49 million tons by 2031, at a CAGR of 3.91% during the forecast period (2026-2031). Cost swings in butadiene feedstock, steady reshoring of glove capacity, and dual ICE-EV seal demand shape the growth profile. Latex grades advance faster than bale grades as medical and cleanroom users lock in long-term offtake. Automotive and MRO users continue to anchor volume because NBR balances oil resistance and price. Rising solution-polymerized supply adds a purity-driven premium tier that cushions overall margins.
Key Report Takeaways
- By product form, bales accounted for 55.23% of the market share in 2025, and the latex product form is expected to grow at a CAGR of 4.59% during the forecast period (2026-2031).
- By manufacturing process, emulsion polymerization led with 62.56% volume share in 2025, while solution polymerization is set to accelerate at a 4.81% CAGR.
- By application, gaskets and O-rings commanded 32.29% of the Nitrile Butadiene Rubber (NBR) market share in 2025; the segment is on track for a 4.44% CAGR to 2031.
- By end-user industry, the automotive and transportation segment accounted for 54.76% in 2025, whereas the medical segment is poised for a 4.89% CAGR during the forecast period (2026-2031).
- By region, Asia Pacific captured 57.81% of the Nitrile Butadiene Rubber (NBR) market size in 2025 and is forecast to grow at a 4.38% CAGR to 2031.
Note: Market size and forecast figures in this report are generated using Mordor Intelligence’s proprietary estimation framework, updated with the latest available data and insights as of January 2026.
Market Trends and Insights
Drivers Impact Analysis of Nitrile Butadiene Rubber (NBR) Market*
| Driver | (~) % Impact on CAGR Forecast | Geographic Relevance | Impact Timeline |
|---|---|---|---|
| Rise in disposable nitrile glove capacity | +0.8% | North America, Southeast Asia (Malaysia, Vietnam), Japan | Medium term (2-4 years) |
| Growing OEM demand for oil-resistant seals and hoses in ICE and EV powertrains | +0.7% | Global, with concentration in Asia-Pacific, North America, Europe | Long term (≥ 4 years) |
| Expansion of industrial machinery MRO in Asia's light-manufacturing hubs | +0.6% | Asia-Pacific (China, India, Indonesia, Thailand, Vietnam) | Medium term (2-4 years) |
| Surge in NBR seals for hydrogen fuel-cell vehicles | +0.3% | Japan, South Korea, Europe (Germany, France), California | Long term (≥ 4 years) |
| Growth of oil-resistant gloves for semiconductor cleanrooms | +0.2% | Asia-Pacific (Taiwan, South Korea, China), United States (Arizona, Texas) | Short term (≤ 2 years) |
| Source: Mordor Intelligence | |||
Rise In Disposable Nitrile Glove Capacity
United States investments of USD 1.5 billion since 2024 secured new glove lines in Virginia, Baltimore, and Ohio[1]. Japan’s Showa Glove added JPY 15 billion for domestic expansion, and Malaysia’s Hong Seng earmarked RM 3 billion for fresh latex output. Multiyear offtake deals with health systems underpin regional suppliers. The strategic pivot from low-cost imports to resilience elevates local NBR latex sales. Producers that guarantee consistent copolymer purity win the early contracts.
Growing OEM Demand For Oil-Resistant Seals And Hoses In ICE And EV Powertrains
NBR covers around 60% of automotive O-ring needs because it withstands petroleum fluids at moderate heat[2]. Electric vehicles still use gearboxes and cooling circuits that specify NBR. HNBR only displaces NBR where temperatures exceed 120°C, so dual-platform production preserves base demand. OEMs now maintain mixed seal portfolios rather than full material swaps. This strategy supports steady nitrile butadiene rubber market growth above the broader elastomer average.
Expansion Of Industrial Machinery MRO In Asia’s Light-Manufacturing Hubs
China’s synthetic-rubber output climbed 4.7% year on year in 2024 to 7.02 million t. Aging factories in India, Indonesia, and Vietnam shorten maintenance cycles, driving hoses, belts, and gasket consumption. MRO now represents about 55% of Asia’s industrial-rubber volume (IRSG.ORG). Local compounders choose Bale NBR because mills and internal mixers are already installed. The MRO surge is structural, not cyclical, sustaining the nitrile butadiene rubber market beyond new-equipment slumps.
Surge In NBR Seals For Hydrogen Fuel-Cell Vehicles
Studies show silica-filled NBR lowers hydrogen swelling to near 37% compression-set increase, broadening its use in secondary FCEV seals. Japanese and Korean automakers forecast cumulative FCEV sales above 50,000 units by 2028. While HNBR secures high-pressure stack seals, NBR remains in coolant pumps and low-pressure lines. Incremental volumes add diversity to the nitrile butadiene rubber market without heavy price premiums.
Restraints Impact Analysis of Nitrile Butadiene Rubber (NBR) Market*
| Restraint | (~) % Impact on CAGR Forecast | Geographic Relevance | Impact Timeline |
|---|---|---|---|
| Tight butadiene supply volatility and price spikes | -0.5% | Global, acute in Asia-Pacific and Europe | Short term (≤ 2 years) |
| Stringent VOC limits on solvent-borne NBR adhesives | -0.3% | Europe, North America, Japan | Medium term (2-4 years) |
| Rising substitution by HNBR in high-temperature sealing | -0.4% | Global, concentrated in automotive and oil & gas sectors | Long term (≥ 4 years) |
| Source: Mordor Intelligence | |||
Tight Butadiene Supply Volatility And Price Spikes
Spot butadiene ranged from USD 956 per t in the US Gulf to USD 1,380 per t in China during May 2025, a 44% gap. Producers lacking a captive monomer risk margin compression when outages occur. Asia will add 4.91 million t per year of new cracker capacity by 2030, yet near-term tightness persists. Petrochemical majors leverage integration to undercut merchant NBR sellers, which fuels consolidation and reshapes the nitrile butadiene rubber market.
Stringent VOC Limits On Solvent-Borne NBR Adhesives
The European Industrial Emissions Directive tightens VOC thresholds below 50 g/L for many adhesive lines. California’s South Coast AQMD mirrors these limits. Formulators shift toward carboxylated latex and reactive hot melts. This transition requires capex for new emulsion reactors and pushes commodity bale NBR toward lower-margin outlets. Waterborne innovation thus becomes a competitive necessity.
*Our forecasts treat driver/restraint impacts as directional, not additive. The impact forecasts reflect baseline growth, mix effects, and variable interactions.
Nitrile Butadiene Rubber (NBR) Market Segment Analysis
By Product Form:
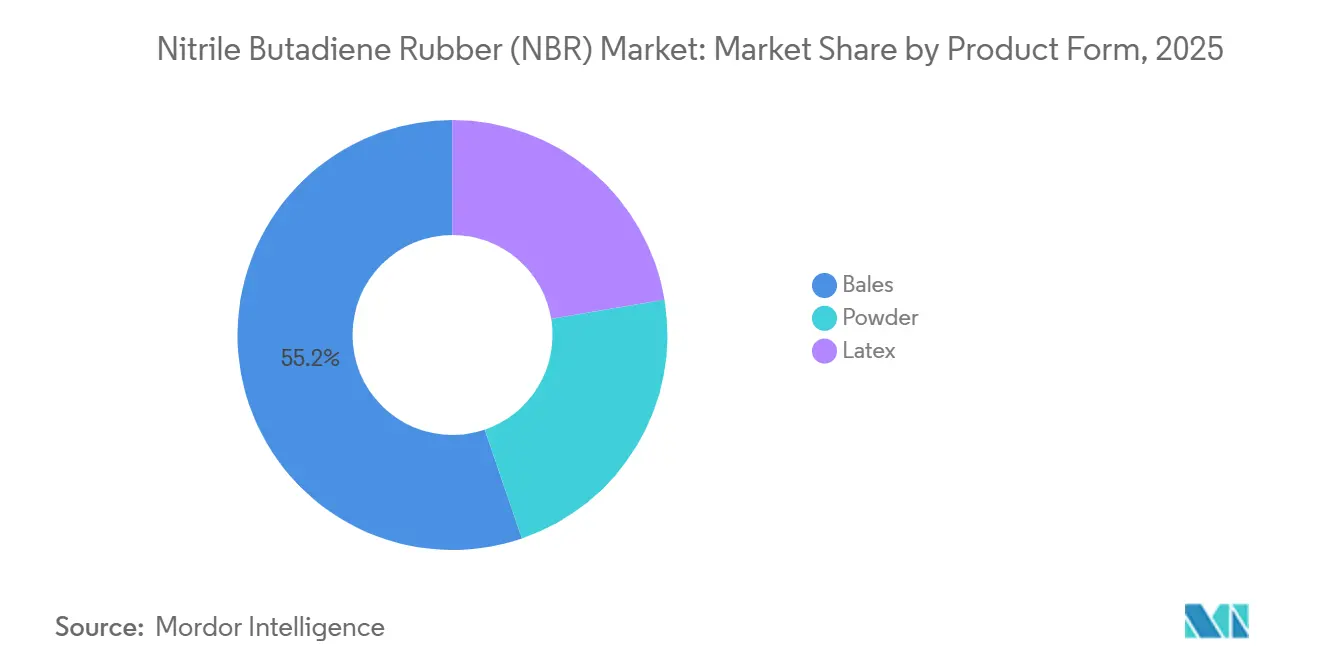
Bales Remain Core While Latex Leads GrowthBales accounted for 55.23% of volume in 2025, underscoring their status as the flexible workhorse for compounders. Latex grades, however, post a 4.59% CAGR on the back of glove expansion and waterborne adhesive uptake. Powder NBR stays niche but profitable, with the top five vendors holding 65% of the sub-segment.
Carboxylated latex addresses VOC rules in automotive interiors and footwear. Bale demand rides Asia’s mixing-mill infrastructure despite feedstock volatility. Powder commands premiums in PVC modification and wire coatings where solvent-free handling is vital. The interplay of these formats supports balanced growth for the nitrile butadiene rubber market.

By Manufacturing Process:
Emulsion Dominates, Solution Adds Premium TierEmulsion polymerization supplied 62.56% of the 2025 output owing to cost and scale advantages. Solution routes grow 4.81% per year as medical and electronics buyers specify low residual monomer. FDA guidance for pharmaceutical stoppers favors solution-grade purity.
JSR and ARLANXEO invest in solution capacity at Yokkaichi and Leverkusen to serve this premium. Emulsion remains the cost leader for automotive hoses and gaskets. The two processes thus segment the nitrile butadiene rubber market into commodity and specialty lanes without direct cannibalization.
By Application:
Seals Anchor Volume, Gloves Sustain MomentumGaskets and O-rings delivered 32.29% of 2025 consumption and grew at a 4.44% CAGR as ICE and EV platforms both need oil-resistant seals. Industrial MRO adds a steady pull from hydraulic presses and CNC machines. Gloves represent the headline growth story as global nitrile revenue climbs toward USD 19.3 billion by 2032.
Hoses and belts see softer uptake because EPDM and hydrogenated nitrile butadiene rubber win ozone and heat resistance niches. Adhesives migrate to waterborne systems that favor latex over solvent NBR. Flooring and consumer goods provide a base load but limited upside, keeping the nitrile butadiene rubber market tied to core sealing and glove demand.
By End-user Industry:
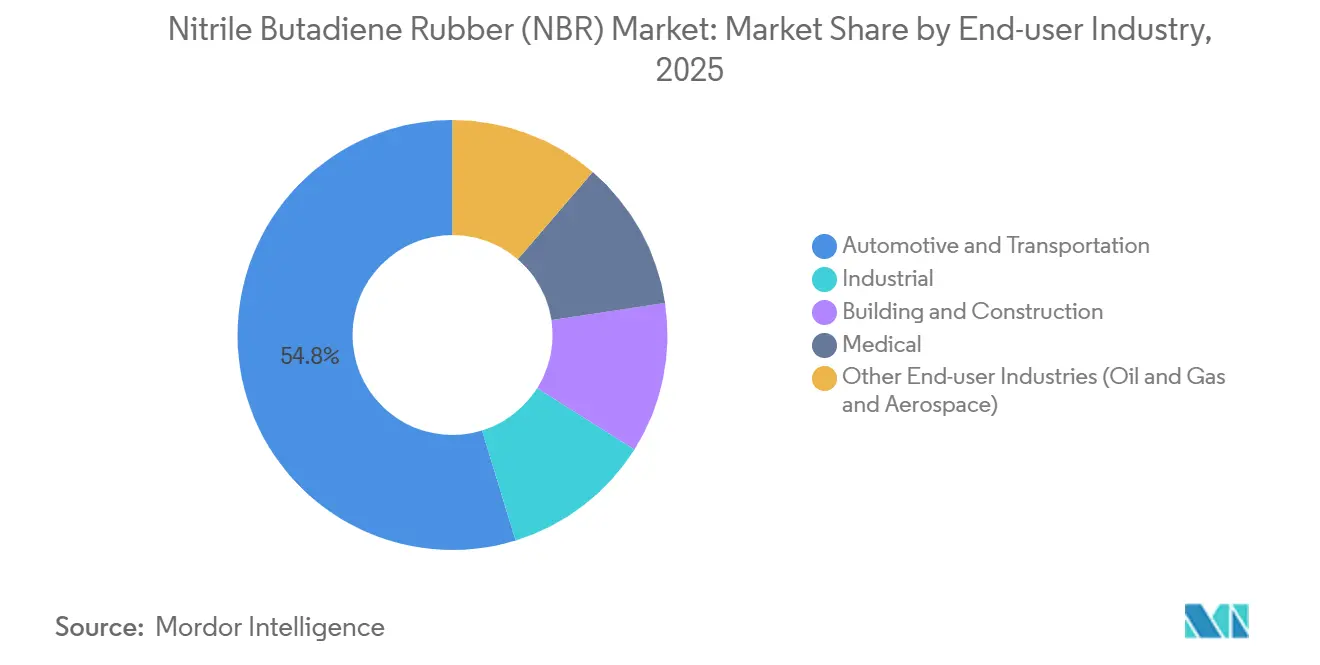
Automotive Tops, Medical FastestAutomotive and transportation absorbed 54.76% of the 2025 volume thanks to entrenched engine and drivetrain uses. BEVs still deploy NBR in gearboxes and steering racks, preserving relevance. Medical products, led by examination gloves, log the highest 4.89% CAGR.
Industrial machinery benefits from Asia’s deep manufacturing base and older plant fleets. Building and construction rely on latex sealants that meet stricter indoor-air rules. Niche oil-and-gas and aerospace users pay premiums for certified grades, boosting margins in the nitrile butadiene rubber market.
Geography Analysis
APAC Nitrile Butadiene Rubber (NBR) Market
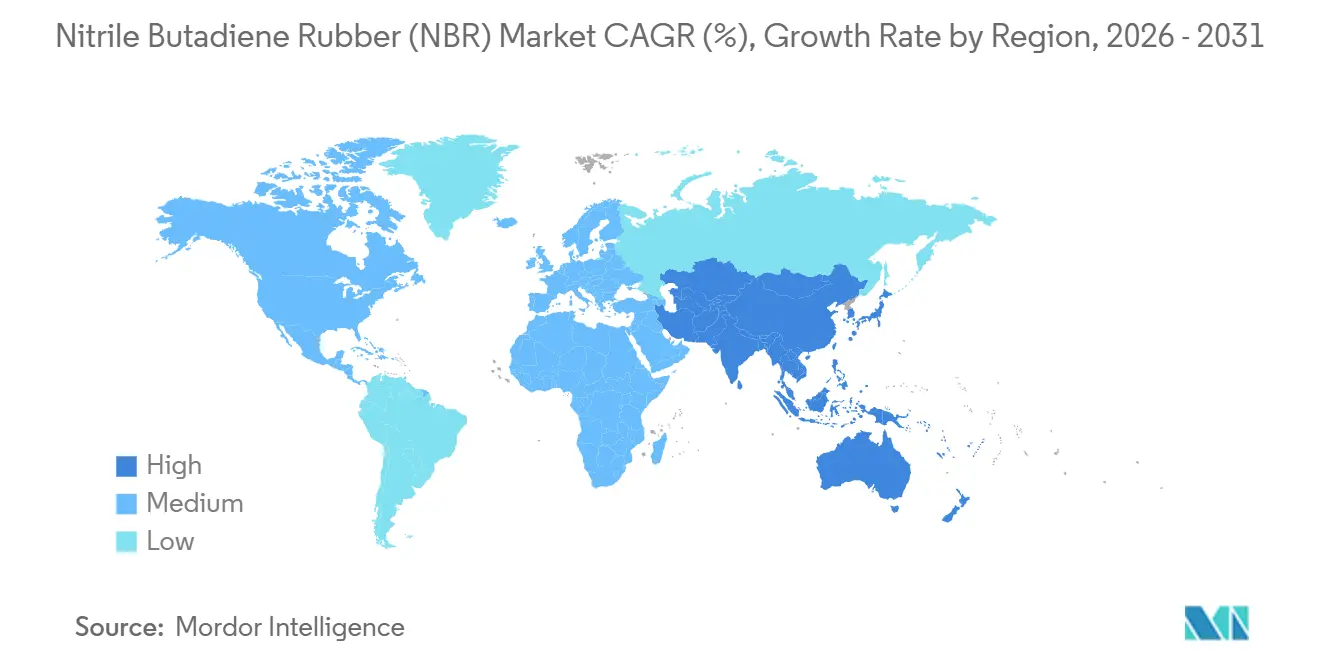
Asia-Pacific held 57.81% of the 2025 volume and is forecast to grow at a 4.38% CAGR to 2031 as China increases its synthetic-rubber output. Sinopec, PetroChina, and CNPC lead the way in operating the largest local NBR facilities. In Southeast Asia, the glove clusters in Malaysia, Thailand, and Vietnam are set to absorb an increasing tonnage of latex, bolstered by Hong Seng's RM 3 billion plant, which is slated to come online in 2026.
North America Nitrile Butadiene Rubber (NBR) Market
North America is ramping up its capacity for medical gloves, fueled by significant investment in U.S. projects scheduled between 2024 and 2025. In Montreal, Canada’s Medicom has poured in substantial funding, while Mexico's auto supply chain is turning to Gulf Coast crackers for their bale NBR imports. However, feedstock fluctuations pose a challenge.
EMEA and South America Nitrile Butadiene Rubber (NBR) Market
Europe is on track to consume significant volumes by 2031, growing at a steady CAGR, primarily driven by demand in automotive sealing and VOC-compliant adhesives. While ARLANXEO is supplying specialty grades from its Leverkusen facility, SIBUR's plants in Russia are catering to Eastern Europe, navigating through trade frictions. Both South America and the Middle East find themselves importing the majority of their requirements, but Brazil's aftermarket and South Africa's mining hose demand are providing a modest yet consistent boost to the nitrile butadiene rubber market.
Value Chain Analysis
The NBR value chain starts with upstream monomers (butadiene and acrylonitrile) from steam crackers and acrylonitrile units. This is followed by NBR polymerization (emulsion and solution), conversion into bales, latex, or powder, and then compounding into end uses including automotive seals (O-rings, gaskets, hoses), industrial MRO parts, adhesives, and medical gloves. Feedstocks are typically about 75-80% of NBR production costs, so butadiene volatility continues to flow through pricing and operating decisions for both converters and downstream buyers.
Midstream supply is shaped by integration, qualified-grade requirements, and logistics. For regulated medical and pharmaceutical applications, supplier qualification cycles often run 12-24 months, which limits rapid substitution during disruptions and increases the value of inventory planning and dual sourcing for glove and stopper supply chains. With capacity concentrated in Asia, especially China, import-dependent markets, including parts of India and Southeast Asia, remain exposed to shipping and geopolitical shocks, as evidenced again in early 2026 when Middle East route disruptions tightened availability and pushed downstream buyers to seek short-term alternatives and relief measures.
Competitive Landscape
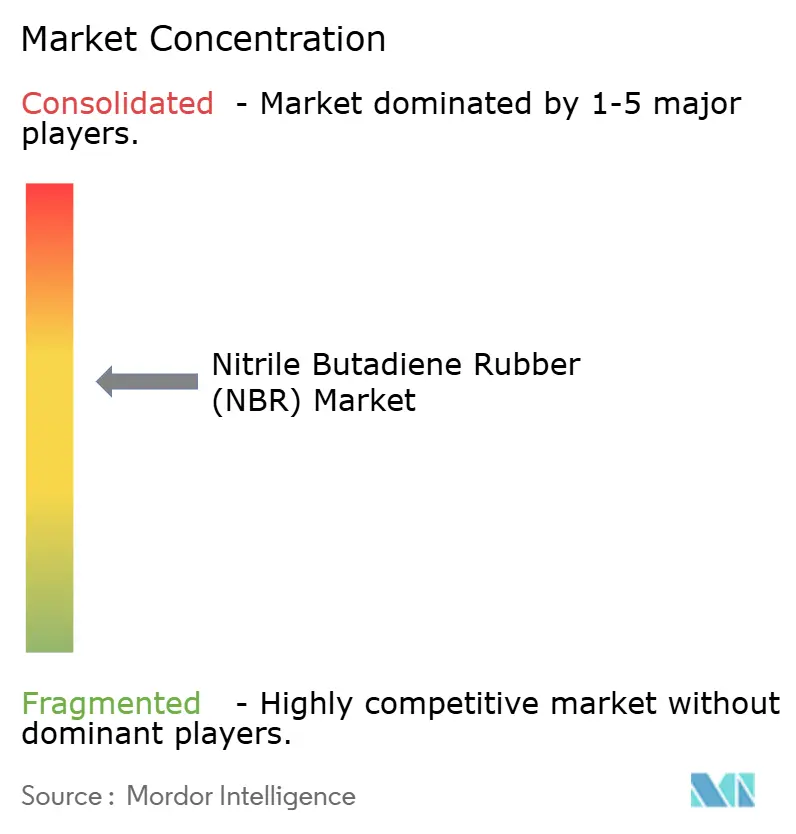
The Nitrile Butadiene Rubber (NBR) market is moderately consolidated. Backward integration shields costs for majors, whereas Zeon and JSR differentiate through solution and HNBR lines. Synthomer’s ISCC-certified bio-based latex pilot slated for 2026 introduces a sustainability premium. Commodity bale NBR suffers the fiercest price pressure as spot butadiene volatility cascades downstream. Specialty niches such as powder, carboxylated latex, and solution grades earn 20–40% premiums due to formulation lock-in.
Nitrile Butadiene Rubber (NBR) Industry Leaders
-
LG Chem
-
ARLANXEO
-
KUMHO PETROCHEMICAL
-
LANXESS
-
China Petrochemical Corporation
- *Disclaimer: Major Players sorted in no particular order
Nitrile Butadiene Rubber (NBR) Market Companies Covered in this Report
- Apcotex
- ARLANXEO
- Atlantic Rubber Company Inc
- China Petrochemical Corporation
- Dynasol Group
- ENEOS Corporation
- JSR Corporation
- KUMHO PETROCHEMICAL
- LANXESS
- LG Chem
- NANTEX Industry Co., Ltd.
- Nitrile Rubber India Limited
- PetroChina Company Limited
- SIBUR Holding PJSC
- Synthomer plc
- Synthos
- Trinseo
- TSRC
- ZEON CORPORATION
Market Opportunities and Future Outlook
White-space is emerging around regionalizing NBR supply and upgrading into higher-purity and specialty grades (solution NBR, carboxylated latex, and controlled-residual-monomer latex). Qualification requirements and long-term offtake tend to reward consistent performance, which supports a shift toward more resilient local availability. Recent capacity actions reinforce this direction: Dynasol announced an NBR capacity expansion at Altamira, Mexico, adding 11 million pounds starting June 2026, and Lion Elastomers announced an expansion at Port Neches, Texas, to manufacture NBR with commercial production targeted for September 2026. In Asia, ARLANXEO and TSRC brought a relocated and expanded NBR joint-venture plant in Nantong online at 40,000 tons per year (May 2025), improving proximity to downstream glove and industrial users.
A second opportunity track sits in overlap with adjacent high-performance elastomers in automotive and new-energy applications, where OEMs and Tier suppliers run mixed material portfolios across ICE, EV, and hydrogen platforms. Investments such as ARLANXEO's Changzhou HNBR plant (commercial operations commenced February 2026, initial 2,500 tons per year) point to portfolio strategies that can pair NBR with premium sealing materials for higher-temperature or specialized environments. For NBR producers, this creates room to win accounts through application engineering, low-VOC adhesive-compatible latexes, and multi-site supply agreements that reduce disruption risk for medical glove and automotive sealing value chains.
Recent Industry Developments in Nitrile Butadiene Rubber (NBR) Market
- April 2026: Kumho Petrochemical confirmed that new 35,000-ton-per-year SSBR capacity was operating as of Q1 2026 as it pushed further into higher value-added synthetic rubbers. The update supports its ability to serve performance-driven automotive demand and points to a continued shift among major elastomer producers toward specialty grades competing for capital alongside NBR lines.
- February 2026: ARLANXEO started commercial operations (February 4) at its hydrogenated nitrile butadiene rubber (HNBR) plant in Changzhou, China, with an initial capacity of 2,500 tons per year. By expanding high-performance nitrile capabilities in China, ARLANXEO broadened local supply options for demanding sealing applications and strengthened its positioning across NBR-adjacent materials.
- May 2025: ARLANXEO and TSRC inaugurated their relocated and expanded NBR joint-venture plant in Nantong, China, lifting capacity to 40,000 tons per year. The upgraded site expanded the product slate and improved supply proximity for regional automotive, industrial, and glove value chains, where continuity and consistent quality influence long-term sourcing decisions.
Nitrile Butadiene Rubber (NBR) Market Report Scope and Research Methodology
Market Definition and Coverage
For this study, the market is defined as demand and supply for nitrile butadiene rubber (NBR) material sold as solid rubber and NBR latex, where volumes are tracked in tons and linked to industrial consumption across key uses.
Scope exclusions: Reground or recycled NBR streams and downstream finished goods revenues are excluded so the size reflects the polymer material market only.
Segments Covered in This Report
- By Product Form
- Bales
- Powder
- Latex
- By Manufacturing Process
- Emulsion Polymerisation
- Solution Polymerisation
- By Application
- Hoses
- Belts and Cables
- Gloves
- Adhesives and Sealants
- Gaskets and O-Rings
- Other Applications (Consumer Goods)
- By End-user Industry
- Automotive and Transportation
- Industrial
- Building and Construction
- Medical
- Other End-user Industries (Oil and Gas and Aerospace)
- By Geography
- Asia-Pacific
- China
- India
- Japan
- South Korea
- Indonesia
- Thailand
- Malaysia
- Vietnam
- Rest of Asia-Pacific
- North America
- United States
- Canada
- Mexico
- Europe
- Germany
- United Kingdom
- France
- Italy
- Spain
- NORDIC
- Turkey
- Russia
- Rest of Europe
- South America
- Brazil
- Argentina
- Colombia
- Rest of South America
- Middle East and Africa
- Saudi Arabia
- United Arab Emirates
- Qatar
- South Africa
- Nigeria
- Egypt
- Rest of Middle East and Africa
- Asia-Pacific
Data Sources, Market Sizing, and Validation
Desk Research
Desk work starts by building a fact base around NBR feedstocks, output, and end-use pull. We rely on public sources such as national statistical offices for industrial production, UN Comtrade for trade flows of relevant rubber and chemical categories, and customs tariff schedules for mapping what is reported under each code. Regulatory and safety references, such as OSHA and the European Chemicals Agency, are used to check where NBR is required or preferred in workplace and chemical handling environments.
To avoid over-counting, we also review manufacturer annual reports, investor presentations, and press releases to understand capacity changes, plant outages, and grade mix shifts between solid NBR and latex. Patent databases are used to identify process and formulation changes that can influence performance and price positioning. A paid subscription focused on company financials and news is used selectively to confirm timelines, ownership, and production footprint details. These sources are illustrative, and other public documents were also reviewed for data collection, validation, and clarification.
Primary Interviews and Surveys
Primary work is used to pressure-test the model assumptions that are hard to read from public documents, especially grade-level demand shifts and pricing behavior through cycles. We speak with producers, compounders, distributors, and large end users in automotive, oil and gas, industrial products, and glove supply chains across APAC, EMEA, and the Americas, then align their inputs to the same unit basis before final checks.
Distribution of primary research fieldwork respondents
| Company type | Respondent position | Region |
|---|---|---|
| Top tier: 33% | CXOs: 18% | APAC: 48% |
| Mid tier: 45% | Functional/Unit leaders: 33% | EMEA: 33% |
| Smaller Players: 22% | Managers: 49% | Americas: 19% |
Market-Sizing & Forecasting
Sizing is built with a top-down approach where production, trade, and apparent consumption signals are used to reconstruct the addressable NBR demand pool by region, and then split into solid NBR versus NBR latex based on validated usage patterns. The totals are corroborated with selective bottom-up approximations, such as sampled supplier roll-ups, channel checks, and typical price per ton by grade, which are then used to adjust for visible gaps.
Key inputs used in the model include NBR and butadiene supply availability, capacity utilization direction, import and export balances, end-use activity indicators in automotive and industrial manufacturing, and glove demand cycles that affect latex pull. Where public data is not clean enough to separate solid and latex flows, we apply conversion factors and mix assumptions taken from expert interviews, followed by consistency checks against trade movements.
Forecasting is done using scenario analysis supported by short-run smoothing of the key drivers, because pricing and utilization can move quickly with feedstock swings and plant events. Growth rates are then reviewed with industry participants so the final trajectory reflects realistic adoption and substitution behavior instead of a single straight-line trend.
Data Validation & Update Cycle
Validation is done through multiple checks so the final size is not driven by one data stream. We compare modeled demand against independent signals like regional manufacturing output, trade balance direction, and known capacity additions, and then investigate any large variances before sign-off.
If an assumption creates an unusual jump in volume or implied price per ton, the inputs are revisited and, when needed, experts are re-contacted to confirm what changed in the market. Each study is refreshed annually, and interim updates are triggered when material events occur, such as major outages, capacity starts, or sharp feedstock-driven price resets. Before delivery, the analyst completes a fresh review pass so the numbers reflect the latest available information.
Mordor Intelligence's Nitrile Butadiene Rubber Market Size Compared Against Other Published Estimates
Different published NBR market estimates can look far apart because they do not always measure the same thing, even when the title sounds identical. The most common differences come from whether the figure is built on volume versus revenue, how latex is handled versus solid NBR, and whether downstream glove or component sales get mixed into the total.
In practice, the gap is usually driven by scope choices, price build assumptions, and how often the inputs are refreshed, which then impacts the implied USD value for the same tonnage. Some studies apply a single global average price and let it rise quickly over time, while others use conservative pricing or older currency conversion timing, which changes the headline number even if demand is similar. In our case, the spread is also explained by keeping the count at the polymer level and excluding finished goods revenues, a scope choice applied by Mordor Intelligence.
In the benchmark table below, the year alignment and whether the underlying approach starts from volume or value explains most of the visible differences across sources.
Benchmark comparison
| Source | Market Size | Gaps in Research Methodology |
|---|---|---|
| Mordor Intelligence | USD 2.33 B (2024) | |
| Global Consultancy A | USD 3.12 B (2025) | Uses a revenue-first view with a different base year, and the implied average price per ton can be higher due to broader grade and pricing assumptions, which lifts the total versus a volume-anchored build. |
| Industry Research House B | USD 2.67 B (2024) | Provides a value estimate without clearly separating solid NBR and NBR latex treatment or documenting price progression and currency timing, which can shift the total even when end-use demand is similar. |
The comparison shows that the widest spread is tied to how price per ton is constructed and whether adjacent revenue pools are blended into the material market. By anchoring the sizing to traceable volume signals first and then applying validated pricing logic, the result stays easier to audit and update when supply, trade, or utilization conditions change.
Key Questions Answered in the Report
What is the size of the nitrile butadiene rubber market?
The Nitrile Butadiene Rubber Market size was valued at 1.19 million tons in 2025 and is estimated to grow from 1.23 million tons in 2026 to reach 1.49 million tons by 2031, at a CAGR of 3.91% during the forecast period (2026-2031).
Which product form grows fastest in the next five years?
Latex grades expand at a 4.59% CAGR through 2031, outpacing bale and powder formats due to glove and adhesive demand.
Why does automotive remain the largest consuming sector?
ICE and EV powertrains both need oil-resistant seals and hoses, keeping automotive at 54.76% of 2025 volume.
Which region drives future volume gains?
Asia-Pacific leads with 57.81% of 2025 demand and a 4.38% CAGR thanks to China’s synthetic-rubber expansion and Southeast Asian glove output.