
Market Overview
| Study Period | 2020 - 2031 |
|---|---|
| Forecast Data Period | 2026 - 2031 |
| Base Year Market Size (2025) | USD 4.66 Billion |
| Market Size (2026) | USD 4.76 Billion |
| Market Size (2031) | USD 5.29 Billion |
| Growth Rate (2026 - 2031) | 2.12 % |
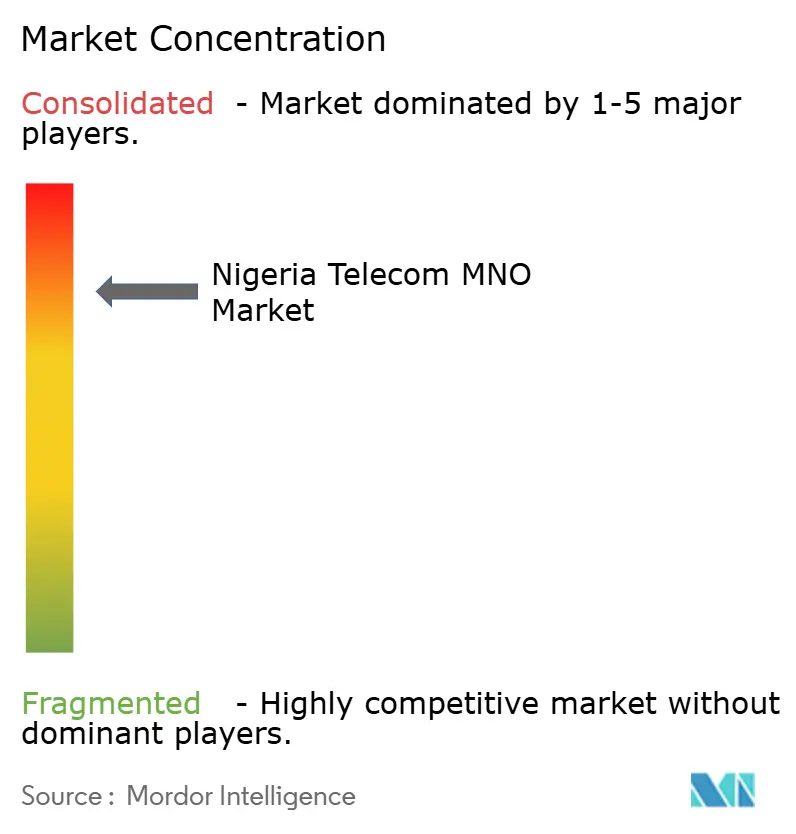
| Market Concentration | High |
Major Players *Disclaimer: Major Players sorted in no particular order Image © Mordor Intelligence. Reuse requires attribution under CC BY 4.0. | |
Nigeria Telecom MNO Market Analysis by Mordor Intelligence
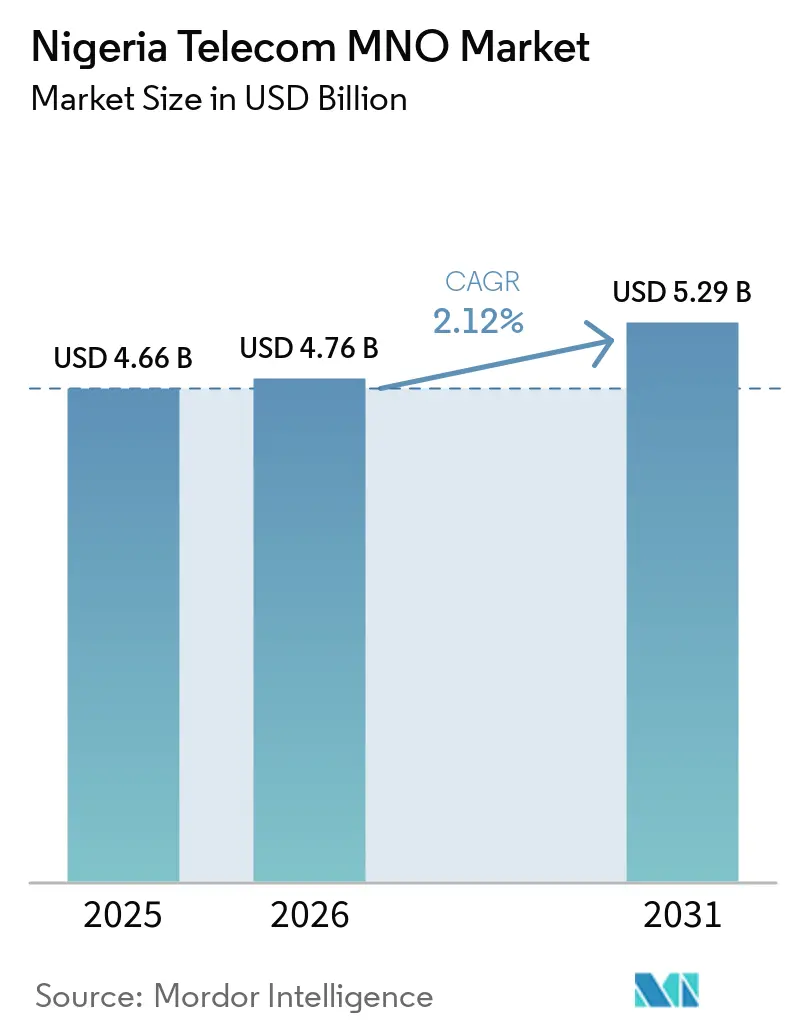
The Nigeria Telecom MNO Market size in 2026 is estimated at USD 4.76 billion, growing from 2025 value of USD 4.66 billion with 2031 projections showing USD 5.29 billion, growing at 2.12% CAGR over 2026-2031. This steady trajectory reflects tariff reforms that moved operators from defensive price caps toward sustainable pricing, expanding gross margins even as foreign-exchange volatility squeezes operating costs. Robust fiber deployments under Project Bridge, wider 5G roll-outs, and aggressive tower lease renegotiations are anchoring connectivity quality improvements that attract higher-value subscribers. Rapid migration from cash to mobile money, together with surging video streaming and gaming traffic, is shifting revenue mixes toward data-centric bundles. Strategic network-sharing pacts among incumbent operators signal a maturing competitive environment in which scale efficiencies outweigh legacy rivalry, positioning carriers to meet rising enterprise demand for ultra-reliable low-latency links.
Key Report Takeaways
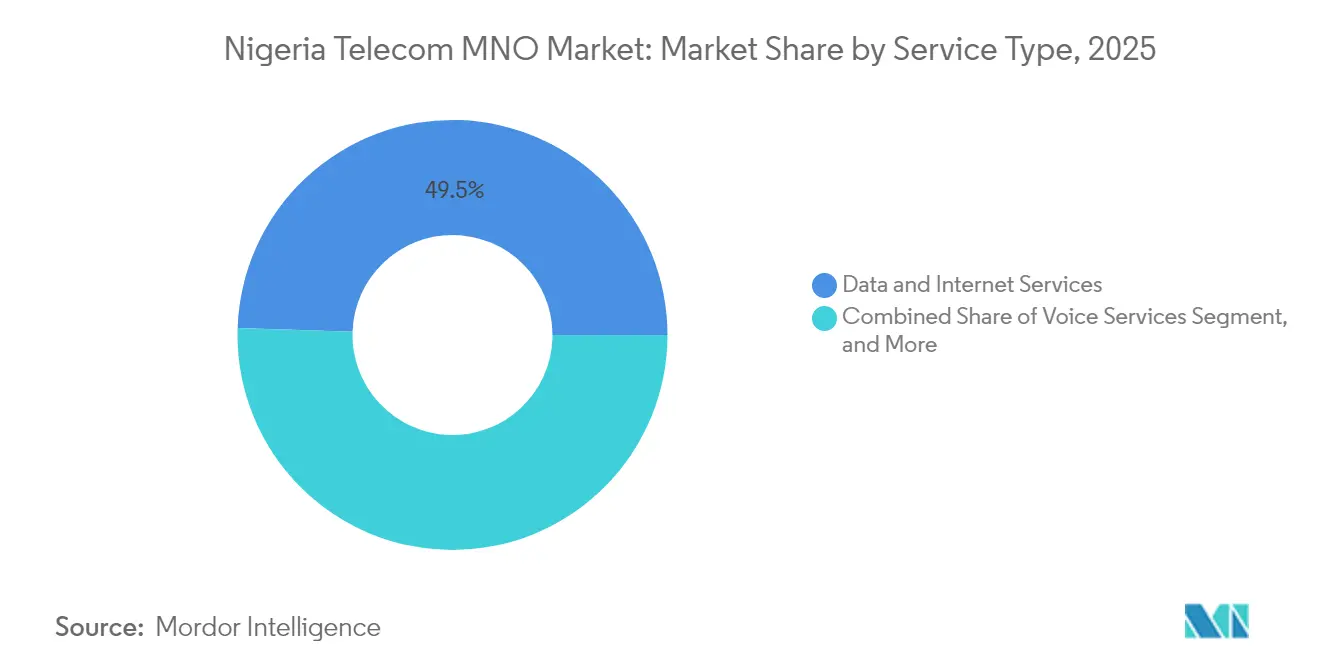
- By service type, data and internet services commanded 49.48% of Nigeria MNO telecom market share in 2025.
- IoT and M2M services are forecast to expand at a 2.29% CAGR through 2031, the fastest within service offerings.
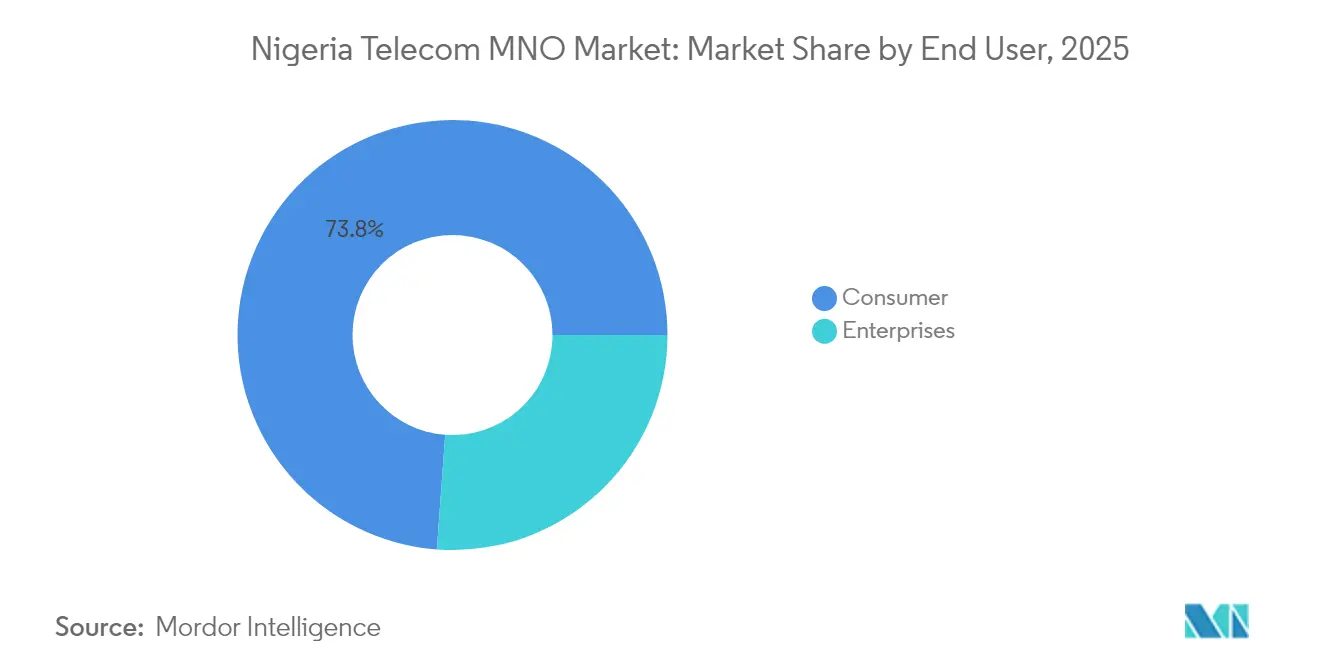
- By end user, consumer subscriptions accounted for 73.84% of Nigeria telecom MNO market share in 2025.
Note: Market size and forecast figures in this report are generated using Mordor Intelligence’s proprietary estimation framework, updated with the latest available data and insights as of 2026.
Nigeria Telecom MNO Market Trends and Insights
Drivers Impact Analysis*
| Driver | (~) % Impact on CAGR Forecast | Geographic Relevance | Impact Timeline |
|---|---|---|---|
| Surging smartphone adoption and mobile-data demand | +0.3% | Lagos, Abuja, Port Harcourt and other high-density urban clusters | Medium term (2-4 years) |
| National Broadband Plan targeting 70% penetration by 2025 | +0.5% | Nationwide, with priority focus on underserved rural areas | Short term (≤ 2 years) |
| Rapid uptake of mobile money and fintech services | +0.3% | Urban commercial centers across Nigeria | Medium term (2-4 years) |
| 5G spectrum awards and early roll-outs by MTN and Airtel | +0.4% | Major metros expanding outward | Long term (≥ 4 years) |
| Fiber-utility partnerships lowering backhaul costs | +0.2% | National infrastructure corridors | Long term (≥ 4 years) |
| Tower sale-leaseback deals freeing capex for rural coverage | +0.2% | Rural and underserved zones | Medium term (2-4 years) |
| Source: Mordor Intelligence | |||
Surging smartphone adoption and mobile-data demand
Smartphone penetration climbed to 58.2% of mobile subscribers in 2024, catalyzing a 33.6% year-on-year jump in average data usage to 10.9 GB per month. MTN Nigeria cut annual tower-related operating expenses by USD 70 million through revised energy indexing, channeling savings into 2,500 new 4G sectors.[1] Sustained 42.9% data-traffic growth has accelerated backhaul upgrades and spawned device-financing schemes that improve handset affordability. Data services already cushion declining voice receipts, accounting for 45.3% of service revenue in Q1 2025. Strong monetization of digital content, gaming, and ad-supported video suggests data-centric pricing will remain the primary revenue lever across the Nigeria telecom MNO market. [2]
National Broadband Plan targeting 70% penetration by 2025
The Federal Ministry of Communications earmarked USD 2 billion for Project Bridge, a 90,000-km fiber backbone that reached 40% completion by mid-2025. The initiative slashes wholesale backhaul tariffs by up to 35%, unlocking last-mile investments by regional ISP consortia. IHS Towers added 10,000 km of new fiber during 2024, delivering diverse routes that lower latency for cloud workloads. Public-private co-build models, coupled with right-of-way fee waivers, have shaved deployment costs by 18% for operators committing to rural coverage milestones. Broadband adoption is now rising 7.4 percentage points annually, placing the 70% access target within reach and strengthening future cash-flow visibility for carriers.
Rapid uptake of mobile money and fintech services
Active wallets on MTN Nigeria’s MoMo platform jumped to 5.5 million in 2025, powering a 21.6% local fintech revenue increase despite stricter KYC rules. Transaction values topped USD 19 billion as average ticket sizes expanded in the wake of demonetization policies that removed high-denomination notes. The Central Bank’s interoperability mandates reduced inter-operator transfer fees by 20%, which stimulated cross-platform payments growth. Operators leverage USSD fail-over layers to ensure 99.95% service availability during data outages, reinforcing consumer trust. With digital payments projected to displace 32% of cash volume by 2030, fintech gains are expected to provide a durable earnings hedge against foreign-exchange volatility in the Nigeria telecom MNO market.
5G spectrum awards and early roll-outs by MTN and Airtel
Commercial 5G users surpassed 4 million within two years of launch, driven by early deployments across business districts in Lagos and Abuja. MTN’s median 5G download speed of 235 Mbps outperformed 4G by 6.4 times, enabling enterprise SLA-backed services such as cloud-based surveillance and immersive collaboration. Airtel signed 150 private-network pilot agreements with manufacturers seeking deterministic latency for process automation. Spectrum utilization rules now oblige operators to cover 60% of local government areas within four years, prompting innovative neutral-host sharing with 9mobile. While consumer 5G ARPU uplifts remain modest, low-latency enterprise demand supports long-term margin expansion for the Nigeria telecom MNO market.
Restraints Impact Analysis*
| Restraint | (~) % Impact on CAGR Forecast | Geographic Relevance | Impact Timeline |
|---|---|---|---|
| Multiple taxation and complex regulatory fees | −0.6% | Nationwide | Short term (≤ 2 years) |
| Naira devaluation inflating network opex | −0.7% | Nationwide, USD-indexed cost centers | Short term (≤ 2 years) |
| Diesel-supply insecurity threatening tower uptime | −0.3% | Off-grid and peri-urban tower sites | Medium term (2-4 years) |
| Stricter SIM-NIN linkage causing subscriber churn | −0.3% | Informal sectors nationwide | Short term (≤ 2 years) |
| Source: Mordor Intelligence | |||
Multiple taxation and complex regulatory fees
Telecom licensees shoulder 46 different federal, state, and municipal levies ranging from 7.5% VAT to right-of-way charges that add USD 0.60 per meter to fiber builds. Although the Federal Government scrapped a proposed 5% telecom tax in September 2025, overlapping demands continue to shrink EBIT margins by an estimated 200 basis points.[3] MTN Nigeria contested a USD 135.7 million VAT assessment, underscoring audit ambiguities that deter capital inflows. Draft harmonization guidelines under the Federal Competition and Consumer Protection Commission aim to consolidate fees into a single electronic window, yet timelines remain unclear. Prolonged uncertainty diverts managerial bandwidth from network expansion plans and clouds valuation benchmarks for potential new entrants into the Nigeria telecom MNO industry.
Naira devaluation inflating network opex
The naira averaged N1,508 per USD in 2024, up from N481 a year earlier, ballooning tower lease expenses that are 70% dollar-denominated. MTN renegotiated its IHS Towers contract to convert energy charges into a blended diesel-indexed formula, saving USD 40 million annually and introducing escalation caps. Equipment suppliers now quote in EUR to evade dollar volatility, pushing operators to increase local currency hedges through revenue-linked forward contracts. Exchange-rate swings also enlarge debt-service burdens, with sector-wide interest cover ratios dropping below 2.5 times. Persistent forex illiquidity compresses free cash flow, delaying nationwide 5G roll-outs and fiber densification critical for the long-term capacity needs of the Nigeria telecom MNO market.
*Our forecasts treat driver/restraint impacts as directional, not additive. The impact forecasts reflect baseline growth, mix effects, and variable interactions.
Segment Analysis
By Service Type – Data Dominance Drives Digital Transformation
Data and internet products accounted for 49.48% of Nigeria telecom MNO market share in 2025 as carriers pivoted toward digital experiences that monetize rising smartphone usage. The Nigeria telecom MNO market size for data services is projected to reach USD 2.75 billion by 2031 at a 2.98% CAGR, twice the growth velocity of legacy voice streams. Persistent appetite for video-on-demand and social commerce is accelerating 4G capacity upgrades in mid-band spectrum and hastening the deployment of cloud-native core networks. IoT and M2M solutions are set to be the fastest-growing revenue bucket, scaling at a 2.29% CAGR as enterprises automate supply chains, monitor cold-storage compliance, and deploy smart-metering at municipal utilities.
Voice still contributes more than USD 1 billion in annual gross turnover yet declined 6.8% year-on-year due to OTT substitution. Messaging revenue continues to recede but offers cross-sell opportunities through RCS-based marketing APIs. OTT video, cloud gaming, and Pay-TV saw renewed traction after regulatory approval for zero-rating educational content, which boosts inclusivity without cannibalizing premium bundles. Operators are sharpening content-curation partnerships to differentiate amid commoditized access. Wholesale backhaul leasing and international bandwidth resale collectively lifted other-services margins, providing incremental buffers against foreign-exchange shocks and supporting capital intensity ratios critical for sustaining the Nigeria telecom MNO market.

By End User – Consumer Scale Meets Enterprise Growth
Consumers represented 73.84% of subscriber lines in 2025 and remain the bedrock of the Nigeria telecom MNO market. Low-value prepaid accounts dominate but recent tariff reforms added elastic room for ARPU uplift, evident in MTN’s 28% jump in blended ARPU to N4,800 by Q2 2025. The population’s youthful demographics ensure a predictable pipeline of first-time smartphone adopters, while mobile money tie-ins improve retention. Converged bundles that include micro-credit, device insurance, and ad-free music have extended average customer lifecycles by three quarters, reducing churn induced by SIM-registration sweeps. The Nigeria telecom MNO market size for consumer services stood at USD 3.44 billion in 2025 and is rising at a 2.02% CAGR through 2031.
The enterprise segment expands faster at 2.58% CAGR, underpinned by cloud outsourcing, cybersecurity mandates, and data-localization directives from NITDA. Corporates engage carriers for managed SD-WAN, edge computing, and private-LTE campus networks as on-premises workloads migrate to local data centers. MTN’s enterprise revenue climbed 54.7% in Q1 2025, reflecting cross-sell of IoT connectivity within energy, FMCG, and logistics verticals. Carriers now package deterministic low-latency slices for financial traders in Lagos’ Marina district, offering differentiated SLAs priced at a 25% premium to broadband ARPUs. Tier III certified facilities such as MTN’s Dabengwa Data Centre are pivotal in capturing hyperscale demand while ensuring regulatory compliance for data residency.
Geography Analysis
Nigeria’s telecom opportunity is unevenly distributed across 774 local government areas that vary widely in income, literacy, and power reliability. Lagos and Abuja account for 31% of sector revenue and host the densest 5G footprint, supported by fiber- to-tower ratios averaging 96%, compared with just 31% in the rural North-East. These conurbations attract enterprise contracts ranging from fintech switching nodes to media content-delivery hubs whose performance targets require round-trip latencies below 15 milliseconds.
Project Bridge’s 90,000-km backbone stitches together under-served oil-producing Delta communities with national data centers, bringing wholesale bandwidth prices down by 22% and improving marginal returns for rural LTE expansions. Federal incentives that subsidize solar-hybrid power systems for off-grid sites have raised tower uptime in hinterland zones to 98.5%, narrowing the urban-rural digital divide. In parallel, the National Identity Management Commission’s enrollment drive has registered 123 million citizens for NIN, facilitating SIM verification that enhances network trust and supports aggressive digital finance growth.
Northern agricultural belts exhibit triple-digit growth in USSD-driven micro-lending as smallholder farmers access seasonal credit via mobile wallets. The Niger Delta leverages high-capacity microwave rings to link offshore rigs to on-shore operation centers, generating high-margin enterprise backhaul business. In the niger telecom mno market, Maradi, Zinder, and Tahoua follow, each exhibiting densification that supports carrier aggregation and high-capacity microwave rings. Meanwhile, cross-border trade corridors into Benin and Niger increasingly terminate international voice traffic through Nigerian carrier hotels, reinforcing the country’s hub position within the West African connectivity map. Collectively these regional dynamics underpin sustainable expansion prospects for the Nigeria telecom MNO market.
Regulatory Landscape
The Nigerian Communications Commission (NCC) is the primary regulator for licensing and technical oversight of mobile network operators, while consumer protection and competition matters increasingly sit at the intersection with the Federal Competition and Consumer Protection Commission (FCCPC). In July 2026, a Federal High Court in Lagos (Suit No. FHC/L/CS/760/2026) clarified this boundary by affirming FCCPC scope over competition and consumer protection in airtime lending, while reinforcing NCC's exclusive authority to license telecommunications operators. This framing affects how MNO-adjacent digital credit products are governed.
Policy and regulatory updates in 2026 also focus on infrastructure resilience and industry structure. The NCC is advancing the classification of telecom assets as Critical National Information Infrastructure (CNII) to strengthen legal protection against vandalism and fiber cuts, while continuing requirements such as prior regulatory approval for changes in shareholding or ownership structure of communications companies. Industry engagement runs largely through the Association of Licensed Telecommunications Operators of Nigeria (ALTON), which has been active in advocating role clarity between agencies to avoid enforcement actions that could disrupt access and service continuity.
Competitive Landscape
The Nigeria telecom MNO market functions as an oligopoly led by MTN, Airtel, Globacom, and 9mobile, which together serve 203 million active SIMs, equal to 96% of mobile connections. MTN alone carries 84.1 million subscriptions and achieved a 17% service-revenue uplift in H1 2025 after a tariff rebasing that sharpened voice profitability. Airtel enhances customer experience by deploying AI-powered spam filters that cut unsolicited SMS traffic by 84% inside six monthsGlobacom differentiates through nationwide fiber rings that backhaul 56% of its LTE radios, enabling competitive flat-rate data plans in tier-two towns.
Infrastructure sharing is reshaping investment economics. A March 2025 reciprocal RAN-sharing pact between MTN and Airtel covers 4,200 sites, yielding estimated capex savings of USD 150 million over three years while accelerating 5G coverage obligations. MTN and 9mobile commenced active network sharing trials in July 2025 that extend 9mobile users onto a 5G-ready network, solidifying MTN’s wholesale revenue stream and improving spectrum utilization. IHS Towers renewed 13,500 site leases until 2032, locking in tenancy revenue and securing anchor clients’ long-term presence.
Regulatory liberalization introduced 46 MVNO licences in 2025, encouraging specialist brands such as Telness Tech to target diaspora and SME niches. Although MVNOs contribute less than 1% of SIMs today, their app-first onboarding and loyalty gamification could pressure incumbents to accelerate digital transformation. Carrier investment in Tier III data centers—exemplified by MTN’s Dabengwa facility—seeks to capture hyperscale workloads moving onshore due to data-residency rules. Overall, strategic cooperation on infrastructure is balancing intensifying service-level competition, ensuring the Nigeria telecom MNO market keeps delivering innovation without sacrificing profitability.
Nigeria Telecom MNO Industry Leaders
-
MTN Nigeria Plc
-
Airtel Networks Ltd (Airtel Nigeria)
-
Globacom Ltd
-
Emerging Markets Telecommunication Services Ltd (9mobile)
-
Smile Communications Nigeria Ltd
- *Disclaimer: Major Players sorted in no particular order
Market Opportunities and Future Outlook
Regulatory programs and rulemaking in 2026 create room for new offers and operating models within the Nigeria telecom MNO market, particularly around wholesale access, digital inclusion, and enterprise-grade services. The NCC's Spectrum Roadmap (2026 to 2030) offers a frequency-planning framework for capacity expansion, while the Commission's review of the National Telecommunications Policy (2000) brings AI, satellite broadband, and IoT into the policy agenda. In parallel, MVNO enablement is a concrete opportunity: 46 MVNO licences have already been issued across operational tiers, and the NCC's ongoing review of MVNO business rules helps anchor a path for app-led brands (diaspora, SMEs, and content-led bundles) to build niche propositions on incumbent networks rather than duplicating radio infrastructure.
Demand-side initiatives also support pull-through for data-centric bundles and campus coverage. The NCC-backed move toward zero-rated access to educational platforms, alongside digital inclusion efforts such as the Universal Service Provision Fund (USPF) and Digital Parks in tertiary institutions, is tied to traffic growth in learning and youth segments. It also gives operators a channel to package affordable data access, identity-linked onboarding, and fintech tie-ins. Separately, infrastructure protection linked to CNII status strengthens the business case for deeper fiber and backhaul investments under programs such as Project Bridge, complementing MNO network-sharing strategies among incumbents and improving the economics of extending higher-quality coverage beyond Lagos and Abuja.
Recent Industry Developments
- July 2026: NCC held a public inquiry session on July 9, 2026 at the NCC Head Office Annex regarding the draft MVNO business rules. The event signals regulator engagement in this evolving segment and could shape how MVNOs are integrated with licensing and market access.
- June 2026: NCC and Corporate Affairs Commission (CAC) implemented a joint directive requiring licensed communications companies to obtain a Letter of No Objection from the NCC before completing any share transfer or ownership restructuring involving 10% or more of share capital. The rule tightens oversight of ownership changes, potentially affecting merger activity and market consolidation.
- June 2026: NCC commenced a comprehensive review of Mobile Termination Rates, the first since 2018, appointing KPMG to conduct a four month consultancy process to assess cost models for USSD, A2P SMS, and MVNO pricing. The review aims to clarify price signaling and service cost alignment across interconnects, influencing competitive dynamics.
Research Methodology Framework and Report Scope
Market Definition and Coverage
For this study, the market is defined as the value of telecom services delivered in Nigeria, captured through operator revenues tied to voice, data, messaging, and related connectivity services used by consumers and enterprises.
Scope exclusions: We exclude handset and device sales, pure IT software revenue, and non-telecom media production, even if these can influence data usage.
Segmentation Overview
- Overall Telecom Revenue and ARPU
- Service Type
- Voice Services
- Data and Internet Services
- Messaging Services
- IoT and M2M Services
- OTT and PayTV Services
- Other Services (VAS, Roaming and International Services, Enterprise and Wholesale Services, etc.)
- End-user
- Enterprises
- Consumer
Data Sources, Market Sizing, and Validation
Desk Research
Desk research helped us set the hard boundaries of the market and build clean input series before any forecasting was done. We relied on public telecom statistics and regulatory disclosures to understand subscriber levels, service mix, and quality indicators that influence spending.
Sources used included official publications such as the Nigerian Communications Commission (including industry statistics and performance reports), the National Bureau of Statistics, the Central Bank of Nigeria for FX and inflation context, the International Telecommunication Union for comparable telecom indicators, and World Bank macro series that help normalize demand. We also reviewed operator filings, investor presentations, reputable press coverage, and used paid subscriptions for company financials, news and financials, patent lookups where relevant, and shipment-level import and export context for network equipment when it supported cost and rollout assumptions. The sources listed are illustrative, and many other public and proprietary references were used for data collection, cross-checking, and clarification.
Primary Interviews and Surveys
Within Nigeria, interviews with telecom operators, infrastructure specialists, enterprise buyers, channel participants, and regulators clarify active lines, usage per connection, ARPU, tariffs, churn, data traffic, and service revenue. Expert discussions and surveys also help address delays in public reporting. Where responses conflict, the relevant assumptions are rechecked before the final results are triangulated.
Distribution of primary research fieldwork respondents
| Company type | Respondent position |
|---|---|
| Top tier: 27% | CXOs: 18% |
| Mid tier: 48% | Functional/Unit leaders: 32% |
| Smaller Players: 25% | Managers: 50% |
Market-Sizing & Forecasting
Sizing starts with a market-led top-down build where subscriber base, active SIM behavior, and service usage trends are translated into revenue pools for voice and data, and then adjusted using Nigeria-specific pricing realities. To keep it grounded, selective bottom-up approximations are used as checks, such as operator revenue roll-ups from public disclosures, sampled ARPU x subscriber consistency tests, and channel feedback on bundle pricing moves.
Key inputs that shape the model include reported telecom subscribers and broadband indicators, data traffic growth direction, tariff and bundle price resets, migration from legacy voice toward data-heavy plans, and network expansion signals like 4G and 5G rollouts and fiber backhaul progress. For forecasts, scenario analysis is applied so macro shifts like FX volatility and inflation can be reflected in different ARPU paths, and then the final view is aligned to what practitioners see as realistic for Nigeria. When a data point is missing or inconsistent, it is bridged using adjacent period trends and cross-checked against regulatory revenue totals so gaps do not silently inflate the result.
Data Validation & Update Cycle
Validation is done through several checks so the final number stays tied to observable market signals. Outputs are compared against independent indicators such as regulator-reported revenue direction, subscriber changes, and known pricing actions, and then variances are investigated before sign-off.
We also run anomaly checks on year-over-year swings at the service level, followed by an internal review step where assumptions and math are rechecked by a second analyst. Reports are refreshed annually, with interim updates when material events occur, such as major tariff shifts or macro changes that impact USD conversion. Before delivery, a final pass is completed so clients receive an updated view that reflects the latest available information.
Mordor Intelligence's Nigeria Telecom Market Sizing Compared With Other Published Estimates
Different published market sizes for Nigeria telecom often disagree because they do not line up on what revenue is counted and how local currency values are translated into USD for a given year. The spread can look large even when the underlying operator performance is similar, especially in periods of FX movement and pricing resets.
The biggest drivers are usually timing and scope, such as whether a figure follows calendar-year regulator reporting or a forecast-year model, whether it mixes operator service revenue with infrastructure leasing, and whether ARPU is moved forward using flat pricing or a stepped tariff adjustment path. By locking FX timing to the stated year, reviewing ARPU progression after known tariff actions, and revalidating key inputs on a set refresh cadence, Mordor Intelligence reduces noise that can come from outdated conversion rates or untested price assumptions.
Benchmark comparison
| Source | Market Size | Gaps in Research Methodology |
|---|---|---|
| Mordor Intelligence | USD 4.76 B (2026) | |
| Industry Association A | USD 5.11 B (2024) | Built from regulator-reported naira revenue and converted to USD using a point-in-time rate, which can diverge from an average-year conversion and does not map cleanly to the forecast-year service mix used in operator models. |
| Industry Database B | USD 2.70 B (2024) | Often applies a narrower service boundary and may treat parts of enterprise connectivity, infrastructure-related receipts, or certain value-added lines differently, which lowers the captured revenue pool even if subscriber metrics are similar. |
The comparison shows that timing, currency handling, and what is counted as telecom service revenue explain most of the difference across numbers. Our approach stays repeatable because each step is anchored to stated years, observable subscriber and pricing signals, and cross-checks that limit overstatement when one input series moves sharply.
Key Questions Answered in the Report
What is the current value of the Nigeria telecom market?
The Nigeria telecom market size is USD 4.76 billion in 2026.
How fast will the sector grow over the next five years?
It is projected to expand at a 2.12% CAGR, reaching USD 5.29 billion by 2031.
Which service category generates the most revenue?
Data and internet services led with 49.48% market share in 2025.
What segment has the quickest growth outlook?
IoT and M2M connectivity is forecast to grow at a 2.29% CAGR through 2031.
How large is the enterprise opportunity?
Enterprise connectivity is expected to register a 2.58% CAGR as Nigerian companies digitize operations.
What role will 5G play in coming years?
Over 4 million 5G subscribers already exist, and shared-infrastructure models are accelerating nationwide coverage, particularly for enterprise applications.