
Market Overview
| Study Period | 2020 - 2031 |
|---|---|
| Forecast Data Period | 2026 - 2031 |
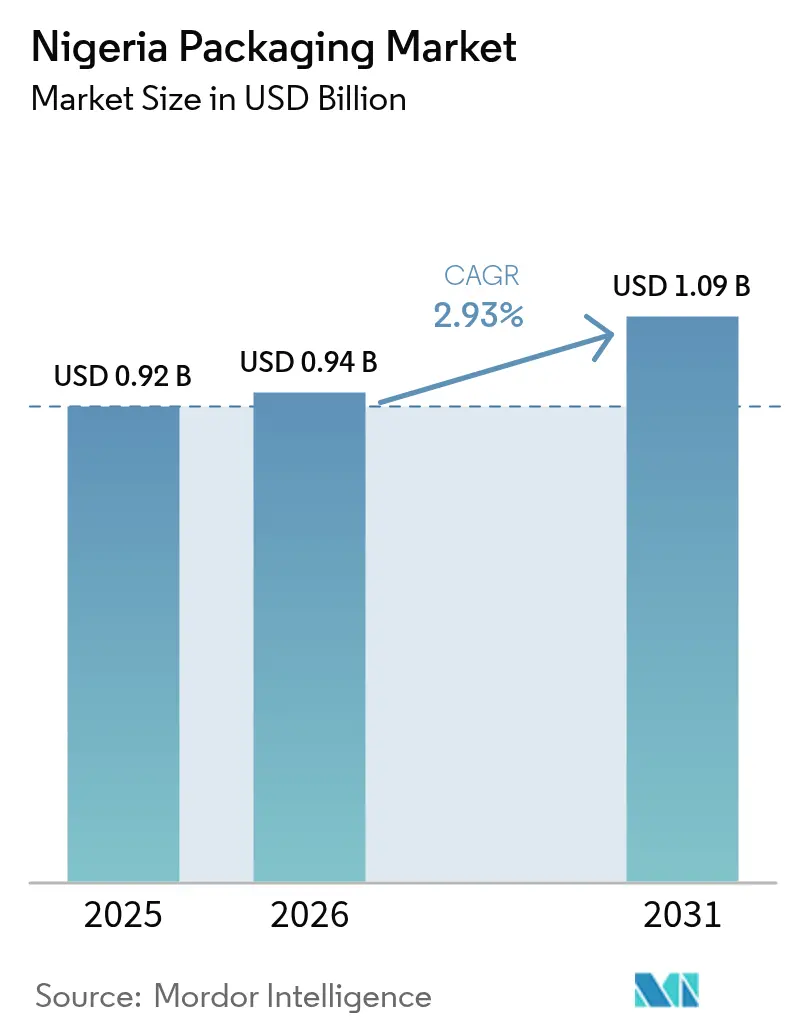
| Base Year Market Size (2025) | USD 0.92 Billion |
| Market Size (2026) | USD 0.94 Billion |
| Market Size (2031) | USD 1.09 Billion |
| Growth Rate (2026 - 2031) | 2.93 % |
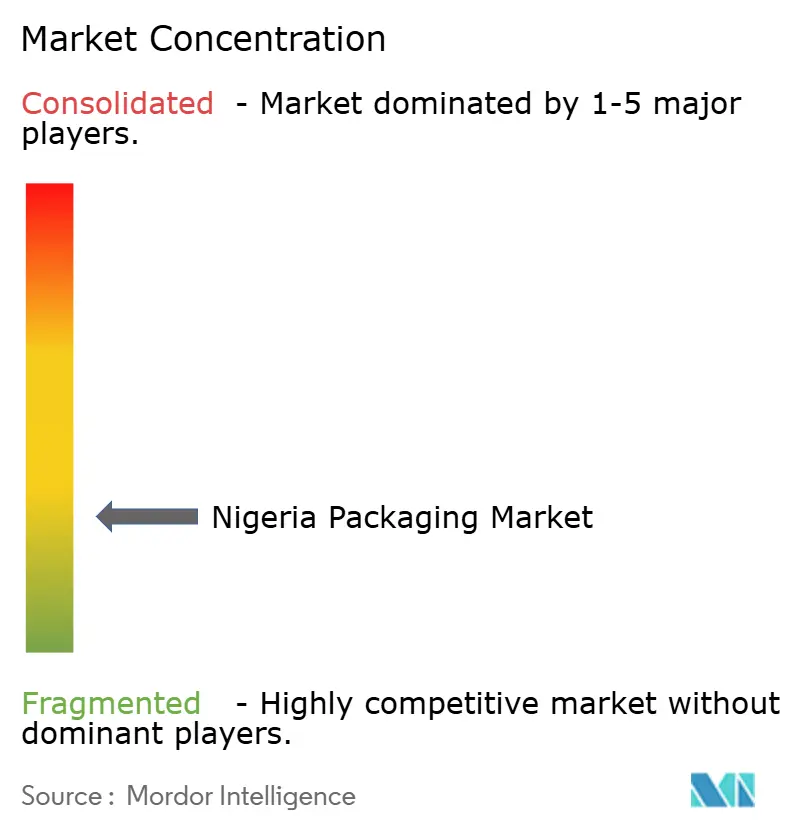
| Market Concentration | Low |
Major Players *Disclaimer: Major Players sorted in no particular order Image © Mordor Intelligence. Reuse requires attribution under CC BY 4.0. | |
Nigeria Packaging Market Analysis by Mordor Intelligence
The Nigeria packaging market size was valued at USD 0.92 billion in 2025 and is estimated to grow from USD 0.94 billion in 2026 to reach USD 1.09 billion by 2031, at a CAGR of 2.93% during the forecast period (2026-2031). Momentum stems from beverage converters securing multi-year polymer allocations, fast-moving consumer-goods brands redesigning packs around sachet formats, and the federal Nigeria First Policy that diverts procurement toward domestic plants. Flexible films keep freight costs low for inland deliveries, while corrugated converters add brownfield capacity to tap rising e-commerce volumes. Exchange-rate volatility continues to raise resin import costs, yet on-shore recycling investments temper exposure to virgin-polymer swings. Multinational converters retain service hubs in Lagos that transfer know-how to local toll partners, but naira-denominated invoicing remains the decisive advantage for homegrown firms, prompting the Nigeria packaging market to evolve into a hybrid of foreign technology and indigenous execution.
Key Report Takeaways
- By material type, plastic packaging led with 53.45% share of the Nigeria packaging market in 2025; paper and paperboard is expanding at a 3.51% CAGR through 2031.
- By packaging format, flexible packaging commanded 55.86% of the Nigeria packaging market share in 2025, while the same format is projected to advance at a 3.64% CAGR through 2031.
- By product type, flexible plastics accounted for 36.59% share of the Nigeria packaging market size in 2025; single-use paper products are forecast to record the fastest 3.83% CAGR over 2026-2031.
- By end-user, food held 28.18% of the Nigeria packaging market in 2025, whereas personal care and cosmetics posts the highest expected CAGR at 3.76% to 2031.
Note: Market size and forecast figures in this report are generated using Mordor Intelligence’s proprietary estimation framework, updated with the latest available data and insights as of 2026.
Nigeria Packaging Market Trends and Insights
Drivers Impact Analysis*
| Driver | (~) % Impact on CAGR Forecast | Geographic Relevance | Impact Timeline |
|---|---|---|---|
| Surge in Demand from Beverage Industry | +0.9% | National, Lagos, Ogun, Kano | Medium term (2-4 years) |
| Growing Penetration of E-commerce and Last-Mile Delivery | +0.7% | National, Lagos, Abuja, Port Harcourt | Short term (≤ 2 years) |
| Urban Middle-Class Expansion and Convenience Culture | +0.6% | National, tier-1 and tier-2 cities | Long term (≥ 4 years) |
| Government's Local-Content Push for FMCG Packs | +0.5% | National, manufacturing clusters | Medium term (2-4 years) |
| Investments in On-Shore Converting Capacity | +0.4% | Lagos, Ogun, Rivers | Medium term (2-4 years) |
| Rapid Shift Toward Sachet and Micro-Pack Formats | +0.5% | Rural and peri-urban markets | Short term (≤ 2 years) |
| Source: Mordor Intelligence | |||
Surge in Demand from Beverage Industry
Brand-owner targets for recycled content are rewriting raw-material sourcing, most notably after a 13,000 metric-ton collection hub came online in Lagos in February 2025, enabling closed-loop polyethylene terephthalate flows.[1]Coca-Cola Hellenic Bottling Company, “Coca-Cola Opens Packaging Collection Hub in Lagos,” coca-colahellenic.com Breweries running 65,000-bottle-per-hour lines now contract for 30% recycled input, lifting crown-cap and closure volumes for local metal converters. The consolidation of juice and dairy players under United Africa Company ratcheted aseptic-carton procurements, locking Tetra Pak into multi-year offtake deals. Closure specialists responded by doubling weld-line capacity, ensuring that the Nigeria packaging market meets tamper-evidence norms without importing finished caps. New capital from Tolaram Group is shifting part of the beer mix toward returnable glass, broadening the pack portfolio beyond single-serve bottles.
Growing Penetration of E-commerce and Last-Mile Delivery
E-commerce sales reached USD 9.35 billion in 2025, compelling parcel carriers to specify corrugated boxes with edge-crush values above 32 psi.[2]Nigerian Communications Commission, “E-Commerce Growth Statistics 2025,” ncc.gov.ng Fulfillment hubs established by Jumia and Konga now require standardized outer-carton footprints that maximize pallet yield, trimming freight cost per order. With 12% of parcels historically damaged on pothole-ridden roads, shippers over-engineer secondary packs, fueling uptake of double-wall board and rigid crates. The Nigeria First Policy directs ministries to prioritize locally boxed products, diverting a slice of e-commerce flow to domestic converters. By dovetailing carton design with robotic picking systems, large box makers secure recurring orders as the Nigeria packaging market deepens its link with online retail.
Urban Middle-Class Expansion and Convenience Culture
Urbanization running at 4.3% pulls disposable income into cities where households prefer portion-controlled goods that fit daily cash flow.[3]National Bureau of Statistics, “Consumer Behavior and Urbanization Trends 2024,” nigerianstat.gov.ng A 2024 survey showed 84.1% of shoppers in Ekiti State buying sachets of toothpaste and seasoning cubes to limit spoilage, a trend that scales water-sachet output to 50-60 million units per day in Lagos. Manufacturers launch 50-milliliter shampoo sachets and 15-gram coffee sticks priced at NGN 50-NGN 150, keeping the Nigeria packaging market in sync with mobile-money pay caps. Modern-trade revenues jumped to USD 160 billion in 2027, and these outlets demand barcode-ready packs that integrate with point-of-sale scanners. Cold-chain creep into tier-1 cities unlocks yogurt cups and ready-to-drink coffees that rely on high-barrier films, adding depth to local extrusion portfolios.
Government's Local-Content Push for FMCG Packs
The May 2025 Nigeria First Policy compels federal buyers to meet a 60% local-pack threshold, ring-fencing demand for plants clustered in Lagos-Ogun corridor. A NGN 200 billion SME fund carved out NGN 50 billion for packaging upgrades, financing gravure presses and ink kitchens that lift domestic print fidelity. Labeling rules now mandate QR codes and batch data, steering converters toward inline coding systems and nudging smaller job-shops to consolidate. Beta Glass evaluates a third furnace to chase new orders for spirit bottles and pharma vials, illustrating how local-content policy reshapes capital allocation. Compliance effectively narrows the supplier pool, and the Nigeria packaging market tilts toward mid-sized firms able to finance continuous-improvement cycles.
Restraints Impact Analysis*
| Restraint | (~) % Impact on CAGR Forecast | Geographic Relevance | Impact Timeline |
|---|---|---|---|
| Strict Environmental and Recycling Mandates | -0.6% | Lagos, Abuja | Short term (≤ 2 years) |
| FX Volatility Inflating Polymer and Paper Costs | -0.8% | Nationwide | Short term (≤ 2 years) |
| Weak Logistics Infrastructure Causing Product Damage | -0.4% | Nationwide | Medium term (2-4 years) |
| Limited Skilled Workforce for Industry 4.0 Converting Lines | -0.3% | Manufacturing states | Long term (≥ 4 years) |
| Source: Mordor Intelligence | |||
Strict Environmental and Recycling Mandates
The National Environmental Standards and Regulations Enforcement Agency sealed non-compliant plants throughout 2025 and made extended producer responsibility compulsory, obliging producers to bankroll collection or face license revocation. Lagos outlawed polystyrene foam, pushing restaurants to molded-pulp trays priced 20-30% higher than legacy packs. Federal targets of 50% waste-reduction by 2025 and 75% recycling by 2030 contrast with a sub-30% collection rate, so regulators escalated fines and plant closures. A National Waste Marketplace launched in October 2025 connects aggregators with recyclers, yet limited broadband in informal settlements throttles uptake. Converters installing mechanical recycling lines still battle scarce clean feedstock, suppressing throughput and dampening returns in the Nigeria packaging market.
FX Volatility Inflating Polymer and Paper Costs
The naira plunged 371% between 2019 and 2025, escalating USD-denominated resin bills and pushing manufacturing input costs up 67% in the first half of 2024. With the policy rate at 27.5%, converters fund working capital at punitive levels, often passing hikes to brand owners or absorbing margin hits. Polymer lead times stretched to 120 days in 2024, prompting substitution with high-density blends that weaken seals. Port dwell times at Apapa and Tin Can averaged 19 days in 2025, layering demurrage charges worth 10% of cargo value. The absent domestic cracker network leaves the Nigeria packaging market exposed until the planned polypropylene unit tied to the 2024 refinery reaches scale post-2028.
*Our forecasts treat driver/restraint impacts as directional, not additive. The impact forecasts reflect baseline growth, mix effects, and variable interactions.
Segment Analysis
By Material Type: Plastic Dominance Meets Fiber Resurgence
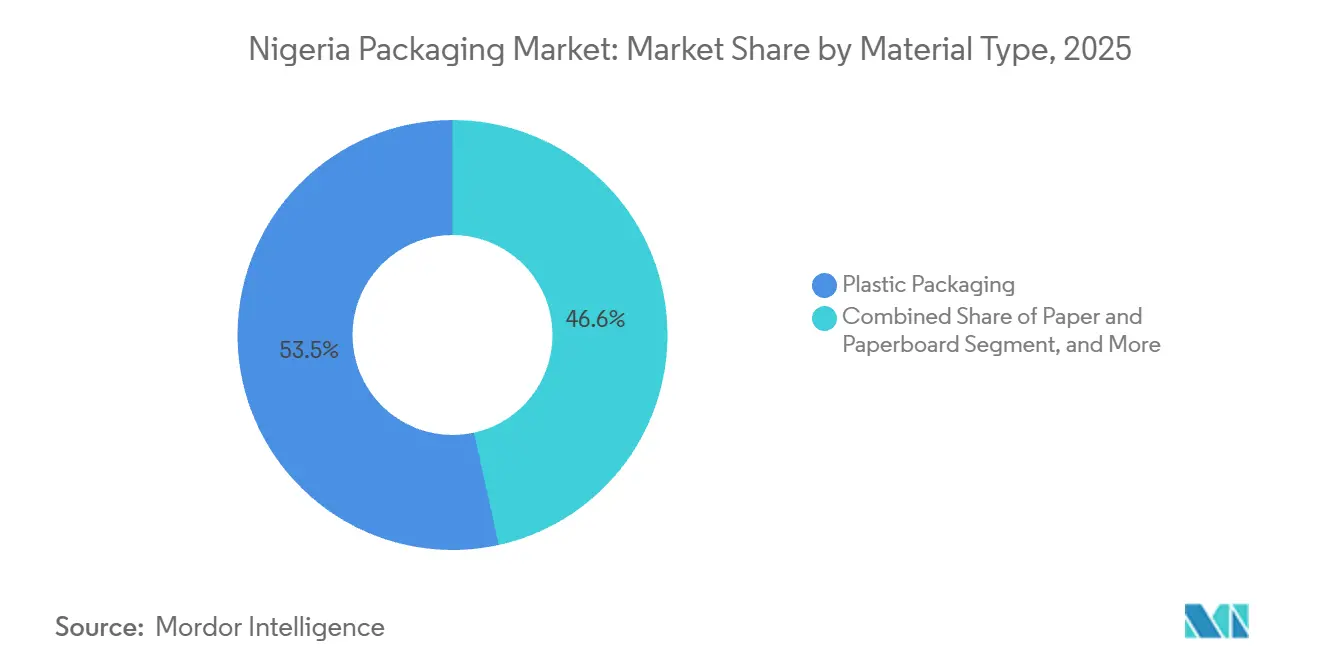
Plastic packaging retained 53.45% share of the Nigeria packaging market in 2025, buoyed by polyethylene terephthalate bottles, high-density polyethylene jerry cans, and low-density polyethylene sachets. Paper and paperboard is advancing at a 3.51% CAGR to 2031, fueled by retailer bans on non-recyclable laminates and eco-label preferences that align with updated food-contact rules. Glass retains premium status in spirits and beer, thanks to narrow-neck press-and-blow lines that shaved 12% weight per bottle and alleviated freight costs. Metal cans remain a niche for tomato paste and aerosols, where barrier integrity outranks unit price. Polypropylene and polyvinyl chloride gain ground in pharmaceuticals and personal care, offering moisture control and tamper resistance.
The fiber resurgence accelerated after quick-service chains swapped polystyrene for molded-pulp clamshells when Lagos enacted its plastic ban. Nestlé Nigeria hit 50% recycled polyethylene terephthalate in its water line, proving that domestic recycling can supply food-grade resin. Reverse-vending pilots in Abuja process 540 metric tons per year and could scale nationwide if deposit economics work. While container glass carries a weight penalty, its recyclability and local furnace capacity sustain demand. As brand owners publish recyclability scorecards, material choice is set to decide tender awards, anchoring plastic for performance and fiber for sustainability within the Nigeria packaging market.


By Packaging Format: Flexible Formats Capture Convenience Premium
Flexible packaging commanded 55.86% of the Nigeria packaging market in 2025 and is rising 3.64% each year through 2031. Stand-up pouches, pillow packs, and three-side-seal sachets cut freight costs, suit low-denomination retailing, and stack neatly on informal shelves. Rigid polyethylene terephthalate bottles remain essential for carbonated drinks where pressure resistance is non-negotiable. Glass serves premium juice and spirits, even though returnable cycles add manual handling fees. Modified-atmosphere pouches now extend the shelf life of fresh produce by five additional days, prompting cold-room operators to add film sealing stations.
Category expansion is most visible in condiments, powdered milk, and detergents, where NGN 50 sachets align with daily spending ceilings. Coca-Cola’s Lagos recovery hub processes both rigid and flexible post-consumer packs, signaling the necessity for multi-format capability. Corrugated e-commerce shippers drive design for crush resistance, nudging flexible mailers into electronics and fashion orders. As grocery delivery apps multiply, single-parcel kits require hybrid packs that merge bubble liners with kraft exteriors. The cumulative effect establishes flexible options as the functional backbone of the Nigeria packaging market, complemented but not replaced by rigid formats.
By Product Type: Single-Use Paper Products Lead Innovation
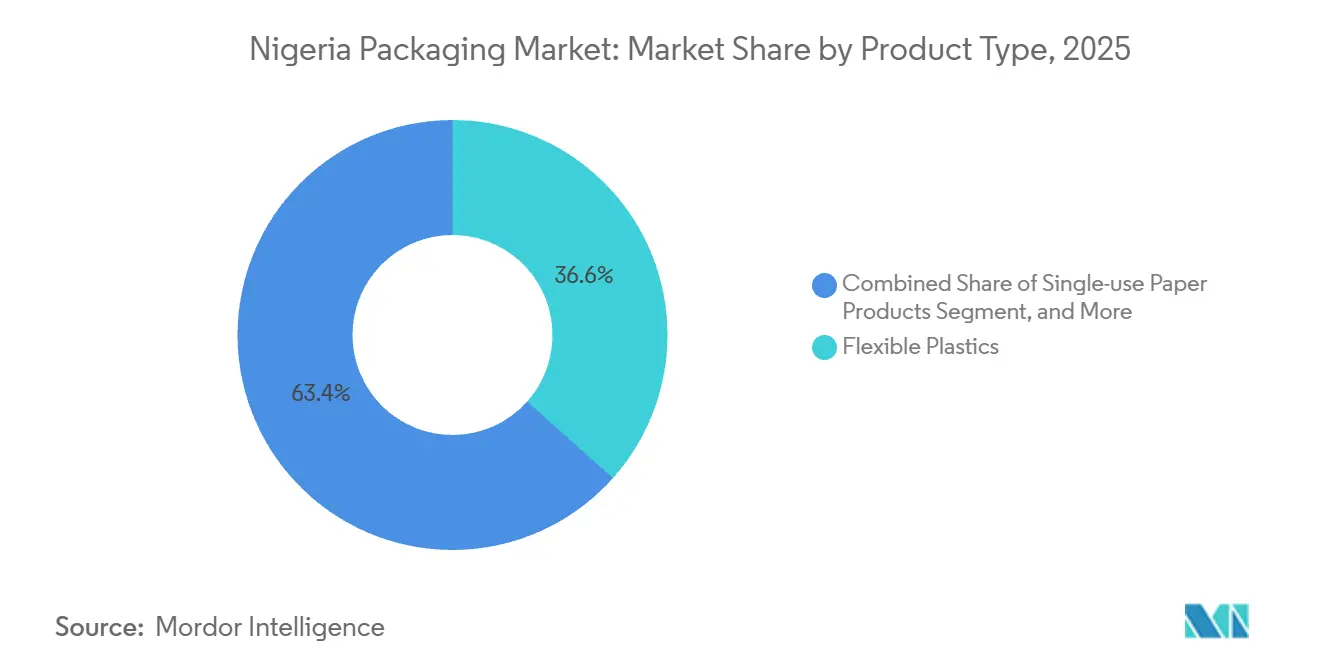
Flexible plastics held 36.59% of the Nigeria packaging market in 2025, underpinned by water sachets and seasoning pouches that dominate low-income consumption. Single-use paper items are expanding at a sector-leading 3.83% CAGR through 2031, propelled by restaurant conversions to molded-pulp trays and by retailer adoption of kraft bags. Corrugated boxes underpin e-commerce growth, where edge-crush thresholds dictate board grade. Metal caps, aerosol cans, and closures occupy specialized niches tied to beverages and insecticides, while folding cartons gain traction in cosmetics and pharmaceuticals that value tamper-evident embossing.
Beta Glass’s 650 million-unit output anchors rigid glass demand for breweries and distilleries. Meanwhile, Avon Crowncaps maintains 28 millimeter closure runs for beer and soda bottlers, ensuring supply continuity during currency swings. Aseptic cartons break into coconut water and ambient juice lines, leveraging portion control and long shelf life. Kraft shopping bags gain share as plastic-film bans widen beyond Lagos. Collectively, the diverse product slate boosts the Nigeria packaging market by matching material properties to end-use economics.
By End-User: Personal Care Outpaces Food in Growth
Food remained the largest outlet at 28.18% share of the Nigeria packaging market in 2025, spanning tomato-paste cans and powdered-milk pouches. Personal care and cosmetics registers the fastest 3.76% CAGR to 2031, as sachet shampoo and lotion packs priced below NGN 100 suit a population in which 60% are under 25. Beverage packaging benefits from USD 1 billion soft-drink expansions that elevate polyethylene terephthalate bottle demand and sustain glass conversion volumes. Pharmaceutical serialization rules that took effect in 2024 raise demand for blister packs with inline vision systems.
Industrial chemicals continue to consume high-density polyethylene jerry cans and steel drums, though lubricant fillers experiment with regrind content. Agricultural sacks of woven polypropylene enable grain trade into Sahel markets, creating a steady baseline. Electronics and hardware rely on anti-static and cushioning inserts, spawning a micro-segment for engineered foams. The layered profile of applications insulates the Nigeria packaging market from shocks in any single category, while personal-care dynamism keeps growth momentum intact.
Geography Analysis
Lagos alone accounts for roughly 40-45% of Nigeria packaging market demand, driven by its twin ports, dense consumer base, and cluster of fast-moving consumer-goods headquarters. Ogun State, contiguous to Lagos, hosts furnaces, recycling lines, and film extruders that capitalize on lower land costs yet share the same last-mile networks. Kano in the north acts as a trans-Sahel hub, feeding cartons and film into Niger and Chad via cross-border corridors. Federal procurement rules that favor states with installed converting capacity intensify regional imbalances, marginalizing southeastern plants that struggle to meet volume thresholds for tenders.
Port dwell time improvements to 19 days still double regional benchmarks, tying up working capital for kraftliner and resin importers and inflating landed costs. Diesel-powered generators bridge grid gaps outside tier-1 hubs, adding NGN 15-NGN 20 per kilogram to production outlays. Road damage during rainy seasons elevates breakage rates, so distributors request double-wall board and rigid crates, channeling volume toward converters in the Lagos-Ogun belt that can furnish heavier grades on short notice.
Cold-chain nodes remain limited to Lagos, Abuja, and Port Harcourt, restricting chilled dairy and pharma distribution and favoring ambient-stable packs like aseptic cartons. Environmental enforcement concentrates in Lagos and Abuja, where capacity exists to audit plants, leaving converters in secondary cities with more compliance latitude but fewer support resources. Collectively, geography steers the Nigeria packaging market toward a dual structure; urban export-linked regions with strict standards, and hinterland zones where flexible formats dominate due to logistics constraints.
Regulatory Landscape
Packaging compliance in Nigeria is shaped by product-safety and labeling oversight from the National Agency for Food and Drug Administration and Control (NAFDAC), alongside environmental enforcement led by the National Environmental Standards and Regulations Enforcement Agency (NESREA). NAFDAC requirements for pre-packaged food, water, and ice emphasize registration and labeling controls, including the use of NAFDAC Registration Numbers. Its inspection guidance for food manufacturing and packaging facilities tightens expectations around hygienic design, documentation, and traceability.
Environmental rules have moved from voluntary initiatives to enforceable obligations for producers and brand owners through NESREA-led plastic-waste and extended producer responsibility (EPR) measures. In 2026, NESREA advanced the National Environmental (Plastic Waste Control) Regulations framework, and subsequent enforcement communications emphasized phased compliance rather than a blanket ban on thin-gauge single-use plastics. This approach points to a compliance pathway that supports formal recovery systems, documented take-back schemes, and packaging redesign tied to recyclability and recycled-content readiness, including phased rPET content requirements with dated milestones.
Value Chain Analysis
Nigeria's packaging value chain starts with imported and locally available feedstocks (polymers, paper, glass inputs, inks, and adhesives) and moves through converters across flexible films, corrugated and cartons, closures, and container glass. These products then supply FMCG, beverage, pharma, and industrial end users. Standards and conformity needs are reinforced by the Standards Organisation of Nigeria (SON) through Nigerian Industrial Standards, while NAFDAC requirements create a compliance gateway for packaging tied to regulated products. That linkage elevates the role of quality systems, batch coding, and traceability within converting and printing.
Downstream, distribution and fulfillment networks centered on Lagos and major inland corridors influence secondary and tertiary packaging specifications. Port congestion and inland logistics constraints also increase the value of local sourcing and short-lead-time converting. End-of-life collection and recycling are increasingly integrated into the chain through EPR-oriented platforms and alliances, including industry-backed recycling initiatives, with NESREA circular-economy actions in 2025-2026 accelerating formal linkages between aggregators and recyclers. This is expanding demand for sorted post-consumer feedstock, particularly for PET-to-rPET loops.
Competitive Landscape
The Nigeria packaging industry shows fragmentation. Container glass is concentrated, with Beta Glass controlling major share but translating to under around 15% share of the Nigeria packaging market across all substrates. Local champions such as Avon Crowncaps, Sonnex Packaging, and PrimePak win orders through shorter lead times and naira pricing that buffers forex shocks. Global majors Amcor, Mondi, and Tetra Pak rely on toll manufacturing and technical hubs rather than greenfield assets, a capital-light model that limits direct share capture but transfers process expertise to local partners.
Exit signals surfaced when Nampak sold its Bevcan Nigeria unit for ZAR 2.3 billion in September 2025, underscoring the difficulty of scaling rigid-metal operations amid aluminum price spikes and naira weakness. At the same time, Beta Glass adopted press-and-blow technology, trimming bottle weight by 12% and cutting freight, while most film extruders still operate manual die changes, illustrating a technology gap inside the Nigeria packaging market. The Food and Beverage Recycling Alliance pools investment from Coca-Cola, Nestlé, and Unilever to fund collection infrastructure that single converters cannot underwrite.
Niche opportunities surface in pharmaceutical serialization, where fewer than 10 local converters own the required in-line vision systems. Digital print start-ups offer 24-hour turnaround for craft beverage labels, a service larger players overlook due to minimum-order constraints. Overall rivalry balances scale with agility, and procurement shifts toward sustainability metrics will likely consolidate share among converters that can document recycled-content compliance and traceability.
Nigeria Packaging Industry Leaders
Avon Crowncaps & Containers Nigeria Limited
Beta Glass Plc
Nampak Ltd
Greif, Inc.
Twinstar Industries Limited
- *Disclaimer: Major Players sorted in no particular order

Market Opportunities and Future Outlook
Policy-driven circularity and local manufacturing programs are creating investable whitespace across recycling, compliant materials, and testing infrastructure. The 2026 push toward mandatory EPR enforcement, along with the dated recycled-content roadmap for PET packaging, is tightening the demand funnel for collection, sorting, and food-grade recycling capability. Large announced projects are positioned to support that shift, including Polysmart Packaging's first-phase build of a 100,000-ton plastic recycling facility targeting food-grade rPET, and the Indorama Ventures, Nigerian Breweries, and Genesis Energy partnership for a 45,000-ton-per-year food-grade rPET facility in Ogun State.
Industrial policy also opens a second lane around domestic conversion and export readiness. The Federal Government's National Industrial Policy (NIP) 2025, launched in February 2026, highlights industrial parks and special economic zones that can host packaging and adjacent manufacturing. SMEDAN's focus on shared packaging and testing hubs targets compliance bottlenecks for MSMEs participating in AfCFTA trade. Alongside this, the Nigeria First Policy implemented in May 2025, with a 60% local-pack threshold for federally procured packaged goods, supports ongoing demand for converters that can document local content, meet SON and NAFDAC requirements, and supply standardized secondary packs for organized retail and e-commerce fulfillment.
Recent Industry Developments
- June 2026: NESREA issued public clarifications on the National Environmental (Plastic Waste Control) Regulations, 2026, emphasizing phased compliance and rejecting interpretations of a blanket ban on thin-gauge single-use plastics. The communication reduced near-term uncertainty for converters while keeping pressure on brand owners to formalize EPR and recovery plans.
- February 2026: Frigoglass Group completed the sale of its Nigerian glass business, including Beta Glass Plc and Frigoglass Industries Nigeria Limited, to Helios Investment Partners for about EUR 100 million. The ownership change reshaped competitive dynamics in container glass by placing a major local producer under a new investment sponsor with scope to prioritize operational performance and capacity utilization.
- October 2025: The Federal Ministry of Environment launched the National Waste Marketplace Programme to connect waste aggregators with recyclers and help formalize feedstock flows. The program strengthened downstream availability of post-consumer material, supporting packaging converters and recyclers working to meet stricter EPR-linked recovery expectations.


Research Methodology Framework and Report Scope
Market Definition and Coverage
For this study, the Nigeria packaging market is the value of packaging products supplied for use within Nigeria across major materials and formats, where demand is created by consumer and industrial end-use sectors.
Scope exclusions: We exclude packaging machinery, printing-only services, and logistics services that do not represent the sale of packaging products.
Segmentation Overview
- By Material Type
- Paper and Paperboard
- Plastic
- Polyethylene Polypropylene (PP)
- High-density Polyethylene (HDPE) and Low-density Polyethylene (LDPE)
- Polyethylene Terephthalate (PET)
- Polyvinyl Chloride (PVC)
- Polystyrene (PS)
- Other Plastics
- Metal
- Container Glass
- By Product Type
- Paper and Paperboard Product Type
- Folding Carton and Rigid Boxes
- Corrugated Boxes and Containers
- Single-use Paper Products
- Other Paper and Paperboard Product Types
- Plastic Product Type
- Rigid Plastics
- Bottles and Jars
- Caps and Closures
- Bulk-Grade Products
- Other Rigid Plastics Product Types
- Flexible Plastics
- Pouches
- Bags
- Films and Wraps
- Other Flexible Plastics Product Types
- Rigid Plastics
- Metal Product Type
- Cans
- Aerosol Containers
- Caps and Closures
- Other Metal Product Types
- Container Glass Product Type
- Bottles
- Jars
- Paper and Paperboard Product Type
- By Packaging Format
- Rigid Packaging Format
- Flexible Packaging Format
- By End-user
- Food
- Beverage
- Pharmaceuticals and Medical
- Personal Care and Cosmetics
- Industrial and Chemical
- Agriculture
- Automotive
- Other End-users
Data Sources, Market Sizing, and Validation
Desk Research
We start by mapping the local packaging demand pool through public statistics and policy signals, and then we align them to packaging consumption patterns in Nigeria. Desk inputs also help us understand what is imported versus made locally, which matters when resin, paper, and metal prices move quickly.
Key non-paywalled sources reviewed include Nigeria Bureau of Statistics releases (manufacturing and consumption indicators), Nigeria Customs Service trade statistics where available, the Central Bank of Nigeria macro series, and standards and guidance from the Standards Organization of Nigeria. We also use sources such as UN Comtrade and World Bank indicators to cross-check trade and economic direction, and we complement this with company filings, investor presentations, reputable press coverage, and association updates. In addition, a paid subscription database for shipment-level import and export records and a patent database are used selectively to support checks on materials flow and innovation activity. This list is illustrative, and many other public and private sources were also referred to for data collection, validation, and research clarification.
Primary Interviews and Surveys
We speak with packaging producers, converters, distributors, brand procurement teams, and end-user managers in Nigeria. Their input helps assess material demand, average selling prices, capacity use, import substitution, and assumptions that public data cannot fully explain. We recheck unusual responses before final triangulation.
Distribution of primary research fieldwork respondents
| Company type | Respondent position |
|---|---|
| Top tier: 28% | CXOs: 15% |
| Mid tier: 47% | Functional/Unit leaders: 30% |
| Smaller Players: 25% | Managers: 55% |
Market-Sizing & Forecasting
Sizing is built using a top-down approach where manufacturing output and trade signals are reconstructed into a packaging demand pool, and then allocated across materials and formats used by major end-use industries in Nigeria. To keep it practical, we anchor the model on inputs such as packaged food and beverage throughput, pharmaceutical and personal care production direction, import and export movement of packaging materials and finished packs, and the pass-through of key input costs like resin and paper.
The totals are then corroborated with selective bottom-up approximations, such as sampled price per pack or price per kilogram ranges from interviews multiplied by estimated volumes in key applications, followed by channel checks with distributors and importers where gaps exist. For forecasting, scenario analysis is used because inflation, currency movement, and input cost swings can shift short-term demand, and assumptions are agreed and stress-tested with industry experts before finalizing the outlook.
Data Validation & Update Cycle
Validation is done through multiple cross-checks so the final number stays consistent with real-world signals, and any unusual jumps are re-tested before sign-off. We compare the market output against independent indicators such as trade direction, manufacturing momentum, and material cost trends, and then we review variances by end-use and by material to make sure changes are explainable.
Before publication, the model is reviewed in steps by analysts, and re-contact is triggered if a key assumption moves outside the expected range. Reports are refreshed annually, and interim updates are made when a material event occurs, such as a major policy change, sharp input cost movement, or a shift in import availability. Right before delivery, a fresh pass is completed so clients receive the latest updated view.
Mordor Intelligence's Nigeria Packaging Market Size Compared With Other Published Estimates
Published numbers for Nigeria packaging can look far apart because the boundary of what is counted is not always the same, and some sources mix product sales with adjacent services. Differences also show up when currency timing is unclear or when price changes are applied evenly across all materials without checking what buyers actually paid.
By tracking material-wise pricing and end-use throughput checks, Mordor Intelligence keeps the 2025 total tied to packaging product value inside Nigeria rather than wider manufacturing activity, which is why some broader statements land higher.
Benchmark comparison
| Source | Market Size | Gaps in Research Methodology |
|---|---|---|
| Mordor Intelligence | USD 0.92 B (2025) | |
| Trade Journal A | USD 2.50 B (2025) | Often presented as an industry value statement without a clear product boundary, which can bundle packaging with printing services, events, or wider manufacturing value added, and it may not separate rigid and flexible packs by material pricing. |
| Regional Consultancy B | USD 0.80 B (2024) | Uses an earlier base year and can understate the market when exchange rate timing and inflation-driven input cost pass-through are not refreshed, and when import availability changes are not revalidated with buyer-side checks. |
The spread across sources mainly comes from what is included and when prices and currency are applied. Our approach stays traceable to a defined pack demand pool and uses repeatable checks by material and end-use, which helps keep the estimate stable even when costs and imports shift quickly.


Key Questions Answered in the Report
How large will Nigeria’s packaging sector be by 2031?
The Nigeria packaging market size is forecast to reach USD 1.09 billion by 2031, expanding at a 2.93% CAGR from 2026 to 2031.
Which packaging format is gaining the most ground?
Flexible formats such as pouches and sachets are the fastest risers, growing 3.64% annually through 2031 as brands prioritize lightweight, low-cost solutions.
Why is paperboard demand accelerating despite plastic dominance?
Retail bans on polystyrene, new fiber-friendly labeling rules, and brand sustainability pledges are pushing paper and paperboard to the highest 3.51% CAGR among material types.
What strain does foreign-exchange volatility place on converters?
A 371% naira depreciation since 2019 inflates import costs for resin and paper, lengthens polymer lead times, and forces converters to raise prices or accept thinner margins.
Which end-user category will outpace the rest?
Personal care and cosmetics leads growth at 3.76% CAGR to 2031, driven by single-use sachets of shampoo, lotion, and detergent that suit low-denomination buying habits.
Page last updated on:


 Your data is secure and never sold or shared.


