
Market Overview
| Study Period | 2020 - 2031 |
|---|---|
| Forecast Data Period | 2026 - 2031 |
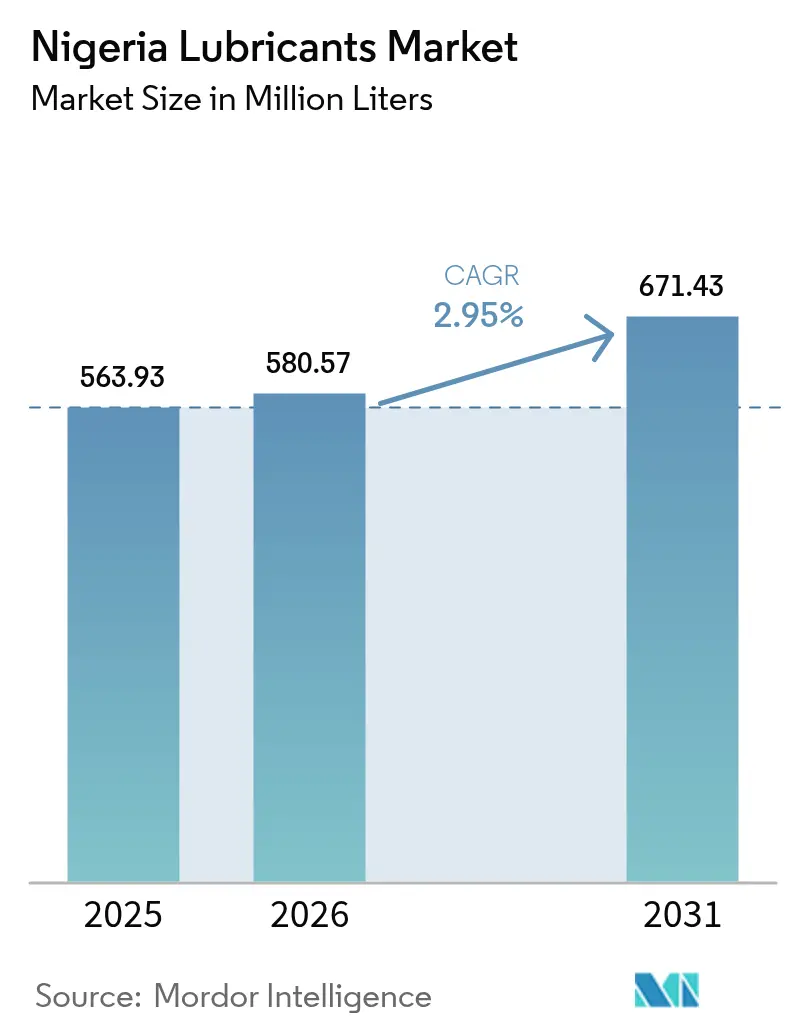
| Base Year Market Size (2025) | 563.93 Million Liters |
| Market Volume (2026) | 580.57 Million Liters |
| Market Volume (2031) | 671.43 Million Liters |
| Growth Rate (2026 - 2031) | 2.95 % |
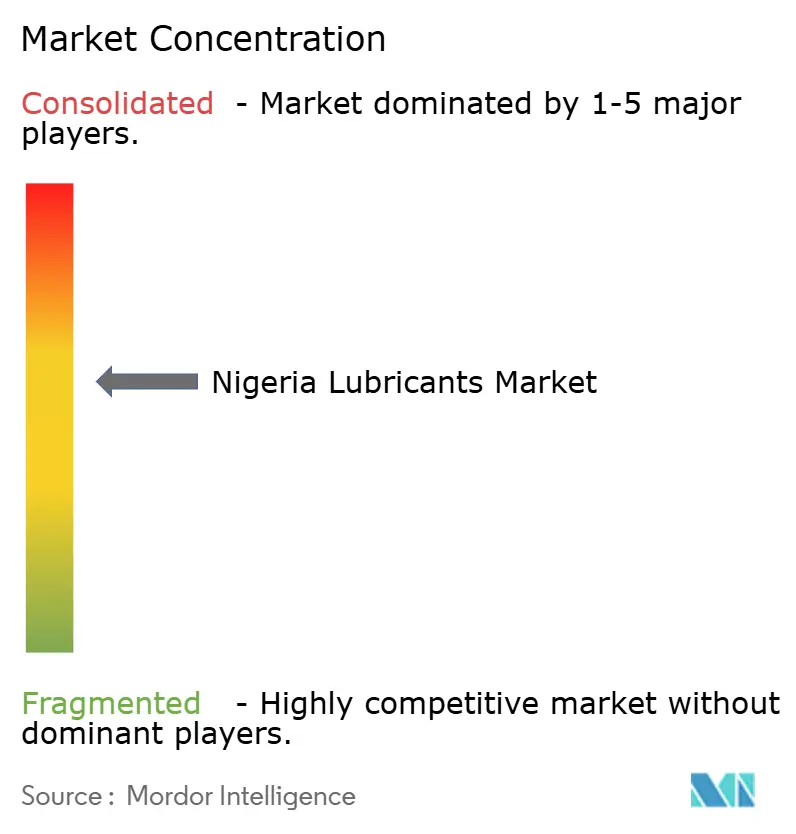
| Market Concentration | Medium |
Major Players *Disclaimer: Major Players sorted in no particular order Image © Mordor Intelligence. Reuse requires attribution under CC BY 4.0. | |
Nigeria Lubricants Market Analysis by Mordor Intelligence
Nigeria Lubricants Market size in 2026 is estimated at 580.57 Million Liters, growing from 2025 value of 563.93 Million Liters with 2031 projections showing 671.43 Million Liters, growing at 2.95% CAGR over 2026-2031. Current growth reflects a blend of vehicle-driven demand, widening industrial use, and a gradual pivot toward synthetic formulations that promise extended drain intervals and fuel-saving properties. Consumer preference keeps mineral oils firmly in the lead, yet sales of synthetic and semi-synthetic grades are rising in Lagos, Ogun, and Abuja as vehicle fleets modernize. Exchange-rate volatility remains the biggest margin risk, as nearly all base oils are imported. Meanwhile, tightening federal quality controls curbs counterfeit volumes and supports legitimate suppliers. New e-commerce channels, led by platforms such as Petro Powers, shorten distribution chains, reduce inventory costs, and provide lubricant makers with direct insight into customer buying patterns.
Key Report Takeaways
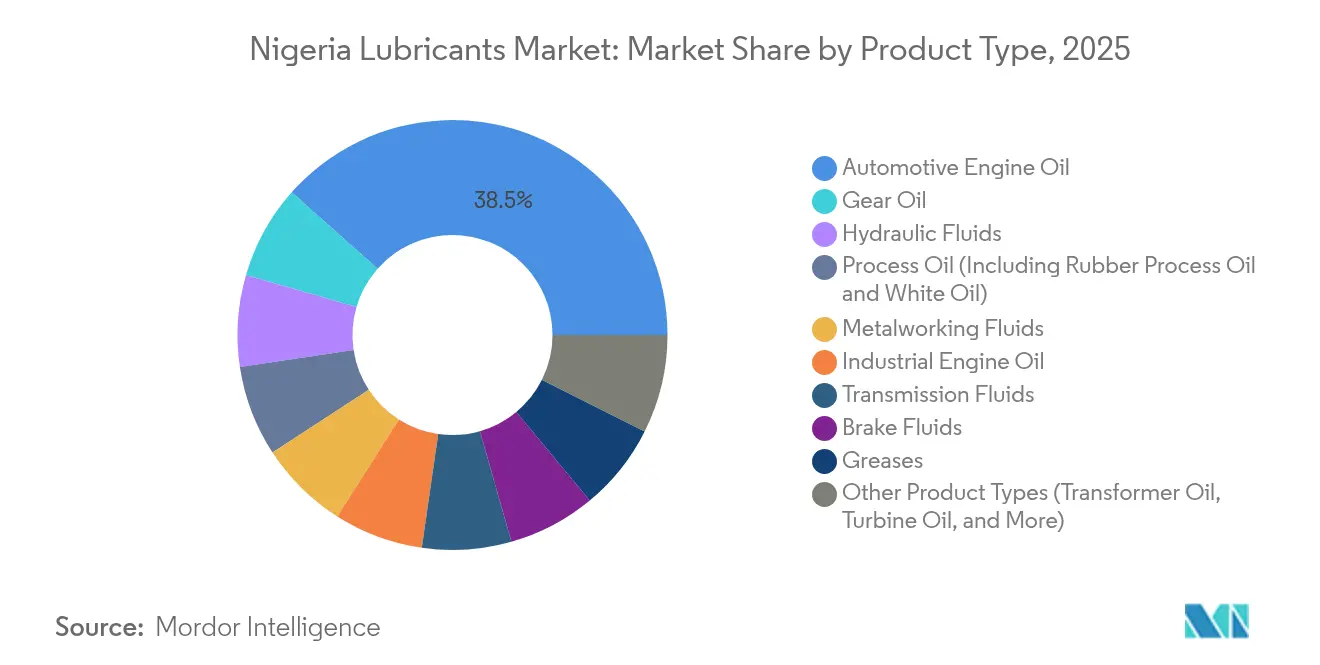
- By product type, automotive engine oil accounted for 38.45% of the market share in 2025. The market size of gear oils is expected to increase with a CAGR of 4.36% during the forecast period (2026-2031).
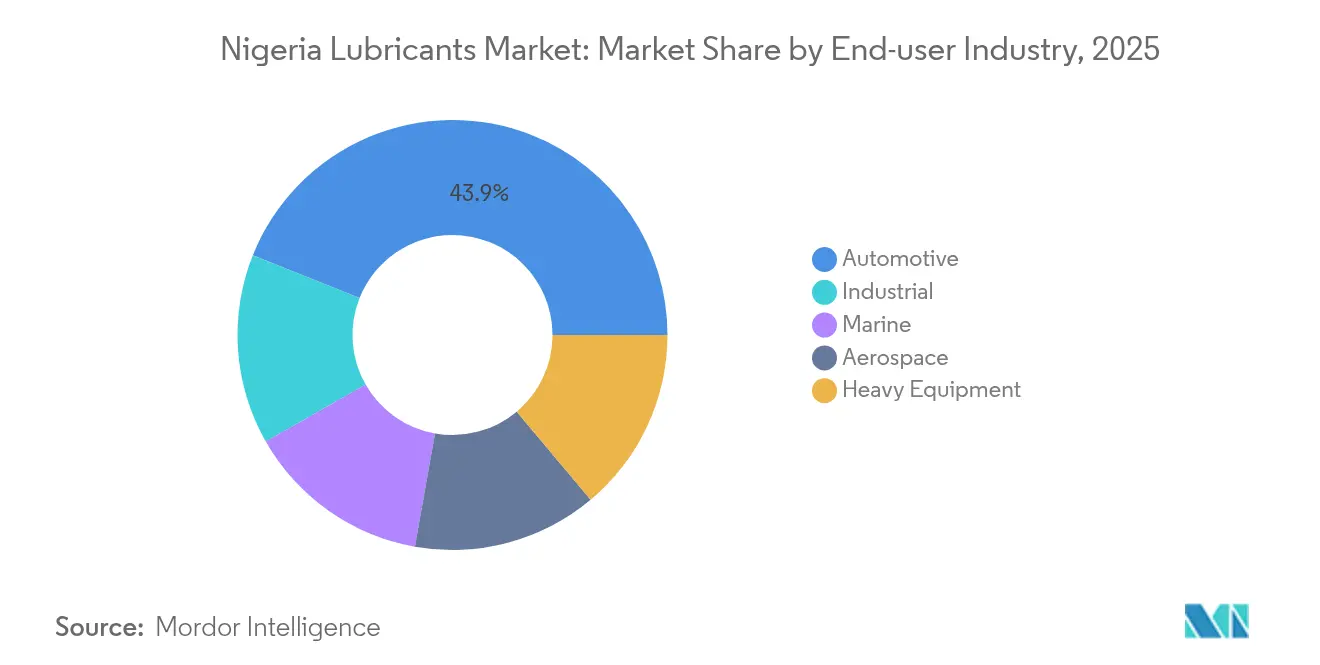
- By end-user industry, the automotive sector held a 43.95% market share in 2025, and during the forecast period (2026-2031), the industrial sector's share is expected to increase at a CAGR of 5.09%.
- By base stock type, the market share of the mineral oil-based lubricants was 75.95% in 2025 and the share of synthetic lubricants is expected to increase with a CAGR of 4% during the forecast period (2026-2031).
Note: Market size and forecast figures in this report are generated using Mordor Intelligence’s proprietary estimation framework, updated with the latest available data and insights as of 2026.
Nigeria Lubricants Market Trends and Insights
Drivers Impact Analysis*
| Driver | (~) % Impact on CAGR Forecast | Geographic Relevance | Impact Timeline |
|---|---|---|---|
| Surging demand for synthetic and semi-synthetic lubricants | +0.8% | Lagos-Ogun-Ibadan corridor and other urban centers | Medium term (2-4 years) |
| Rapid expansion of Nigeria's used-vehicle fleet | +0.6% | Lagos, Kano, Port Harcourt | Short term (≤ 2 years) |
| Growth in Lagos-Ogun industrial corridor | +0.4% | Southwest Nigeria | Long term (≥ 4 years) |
| Digitalisation of lubricant retail channels | +0.3% | Lagos, Abuja, Port Harcourt, Kano | Medium term (2-4 years) |
| Federal auto-assembly incentives for OEM-approved lubes | +0.2% | National | Long term (≥ 4 years) |
| Source: Mordor Intelligence | |||
Surging Demand for Synthetic and Semi-Synthetic Lubricants
Synthetic grades are expanding as fleet operators weigh extended drain intervals against upfront price premiums. Sales of premium products climb fastest where turbocharged and hybrid vehicles enter the parc under OEM assembly programs in Lagos and Kaduna. TotalEnergies notes a nationwide upswing in Quartz branded synthetics, while Shell’s Helix Ultra is now standard across several logistics fleets that target lower service downtime[1]. Local blenders, notably MRS Oil and Ardova, have retrofitted plants to incorporate Group III base stocks and stricter additive chemistries that meet API SP and ACEA C6 specs, reinforcing the move to higher-quality formulations.
Rapid Expansion of Nigeria's Used-Vehicle Fleet
Used-vehicle imports feed aftermarket demand because older engines require more frequent oil changes. National policies project 11.8 million registered vehicles by 2030, with commercial transport making up 56% and consuming 3–4 times more oil than private cars. Registration data shows the heaviest concentrations in Lagos, Kano, and Rivers, turning these states into high-volume hubs for multi-grade diesel and gasoline engine oils.
Growth in Lagos-Ogun Industrial Corridor
This corridor contributes over 60% of manufacturing output, spurring purchases of hydraulic fluids, metal-working oils, and turbine oils. Power-plant expansion, led by gas-fired projects, raises demand for high-temperature turbine lubricants that protect against varnish and deposit formation. Easy port access lowers inbound freight costs for base oils, supporting competitive pricing for industrial users.
Digitalisation of Lubricant Retail Channels
Online platforms connect blenders directly to mechanics and end-users, shrinking traditional mark-ups. In Lagos and Abuja, where internet coverage exceeds 70%, Petro Powers offers same-day delivery of packaged lubricants, enabling small workshops to source genuine products with QR-code authentication. Suppliers gain real-time sales analytics for better demand forecasting.
Restraints Impact Analysis*
| Restraint | (~) % Impact on CAGR Forecast | Geographic Relevance | Impact Timeline |
|---|---|---|---|
| Counterfeit/adulterated lubricant prevalence | -0.40% | National, concentrated in northern markets and border regions | Short term (≤ 2 years) |
| FX volatility and import-dependent base-oil costs | -0.60% | National, highest impact on import-dependent blenders | Short term (≤ 2 years) |
| Stringent waste-oil disposal regulation | -0.30% | National, with stricter enforcement in Lagos, Rivers, and FCT | Medium term (2-4 years) |
| Source: Mordor Intelligence | |||
Counterfeit/Adulterated Lubricant Prevalence
Substandard products undermine engine integrity and erode brand trust. The Standards Organisation of Nigeria confiscated NGN 20 billion worth of counterfeit goods in 2024, highlighting the scale of the challenge[2]. Smuggled stocks in border states retail at 30–40% discounts, drawing cost-sensitive buyers but causing premature engine failures that raise total ownership costs.
FX Volatility and Import-Dependent Base-Oil Costs
Nigeria imports nearly all its base oils, exposing blenders to dollar-denominated feedstock prices, which can be volatile. A 100% naira depreciation historically inflated domestic petroleum product costs by 136.7%, compressing margins for local blenders that cannot adjust pump prices quickly. Frequent price resets strain customer contracts and working capital cycles, particularly for SMEs in the Nigerian lubricants industry.
*Our forecasts treat driver/restraint impacts as directional, not additive. The impact forecasts reflect baseline growth, mix effects, and variable interactions.
Segment Analysis
By Product Type: Engine Oils Drive Market Leadership
Automotive engine oils controlled 38.45% of sales in 2025, a dominance rooted in frequent service intervals and a hot climate that accelerates oil oxidation. Gear oils are projected to be the fastest-growing segment at a 4.36% CAGR, driven by the demand for heavy-duty trucks in the construction and mining industries. Process oils find demand in tire production, while metalworking fluids align with the expansion of auto-assembly plants. The Lagos-based manufacturing cluster boosts consumption of stamping oils and cutting fluids, while nationwide infrastructure projects sustain demand for hydraulic fluids. Brake fluids and greases register steadier growth as vehicle parc expansion underpins basic maintenance volumes.
The shift toward synthetic and semi-synthetic grades boosts the premium end of the product mix. Local blenders incorporate Group III imports to produce API SN-Plus and CK-4 oils, which offer longer drain intervals, thereby reducing downtime for fleet operators. Gearbox technologies in newer passenger vehicles also demand higher viscosity-index oils, reinforcing the shift to synthetics.

By End-User Industry: Automotive Dominance with Industrial Acceleration
The automotive sector accounted for 43.95% of 2025 demand, led by commercial transport fleets that log high annual mileage. Commercial vehicles consume 3–4 times more oil than private cars, resulting in high rotation of multi-grade diesel engine oil. Motorcycle taxis have pushed demand for small-engine two-stroke and four-stroke oils in urban centers. Industrial users, however, are forecast to register the highest 5.09% CAGR, tracking new power-generation and manufacturing investments in the Southwest.
Power plants switching from diesel to natural-gas turbines require premium turbine oils and long-life transformer fluids. The oil-and-gas upstream segment continues to require compressors and circulating oils, while marine lubricants support offshore supply vessels gathering at Lagos and Port Harcourt ports. A small but rising aerospace segment specifies high-temperature, low-volatility oils for turbine maintenance in Nigeria’s developing aviation hubs.
By Base Stock Type: Mineral Oils Lead with Synthetic Growth
Mineral oils held 75.95% of the Nigeria lubricants market in 2025, owing to lower retail prices and entrenched supply chains. Synthetic grades, though, are forecast to post a 4% CAGR as OEM approvals, fleet trials, and total cost of ownership gains become more widely recognized. Semi-synthetic blends appeal to commercial fleets that want longer drain intervals without incurring the full premiums of full synthetic oils. Emerging bio-based lubricants remain niche, but they benefit from stricter disposal rules under the National Environment Regulations 2023.
Synthetic adoption is concentrated in Lagos and Abuja, where new-car sales are highest and service networks offer access to genuine low-viscosity oils. Mineral-oil pricing fluctuates with base-oil imports; the Dangote Refinery’s eventual Group I and Group II output could reduce dependence on offshore supply and stabilize prices after 2027.
Geography Analysis
The Nigeria lubricants market is heavily weighted toward the Lagos-Ogun-Ibadan axis, which absorbed about 39.45% of national volumes in 2025. Lagos alone hosts over 2.1 million registered vehicles and most blending plants, providing rapid access to seaports that handle base-oil imports. The industrial estate density here generates steady orders for hydraulic, process, and metal-working fluids.
Kano, in the north, with 890,000 vehicles, serves as a distribution hub for neighboring states and Sahel markets. While high transport volumes favor sales, porous borders also heighten counterfeit penetration, depressing legitimate supplier margins. To counteract this, Chevron expanded its Texaco dealer network in 2024, adding 15 licensed outlets across the north to shore up brand presence and product authenticity.
Port Harcourt and Rivers State contribute a sizable industrial demand, anchored in oil and gas processing, refineries, and marine logistics. Marine lubricants gain from the ONNE port’s growing role as a bunkering hub after TotalEnergies’ USD 12 million Lubmarine upgrade in 2024. Abuja and its environs emerge as a growth pocket backed by government fleet renewals and infrastructure investment. New road and rail links, notably the Lagos-Ibadan expressway, will shift distribution economics and could dilute Lagos’ concentration advantage over the forecast period.
Regulatory Landscape
Nigeria's lubricants market follows a dual compliance regime for product quality and downstream petroleum operations. The Standards Organisation of Nigeria (SON) enforces lubricant conformity through SONCAP for imports and MANCAP for locally manufactured products, while the Nigerian Midstream and Downstream Petroleum Regulatory Authority (NMDPRA), empowered by the Petroleum Industry Act (PIA) 2021, licenses entities involved in importing, storage, distribution, and sales of petroleum products and additives.
Regulatory tightening has focused on traceability and product integrity. In June 2025, NMDPRA introduced a Lubricant Importation Module and a licensing approach to manage a cited domestic supply gap while curbing substandard inflows, increasing documentation and compliance expectations for importers and blenders. SON also reinforced product-standard enforcement through anti-counterfeit actions, including 2024 enforcement results that pointed to large-scale seizure activity across counterfeit goods, strengthening quality verification for packaged lubricants in retail channels.
Value Chain Analysis
Nigeria's lubricants value chain starts with feedstock procurement, dominated by imported base oils and additive packages, followed by local blending at specialized plants, packaging, and distribution into automotive, industrial, and marine end users. Large blenders and marketers combine manufacturing with wholesale depots and retail networks, while third-party distributors and workshops remain key for last-mile access, especially for automotive engine oils.
Regulation and logistics shape operating economics across the chain. Under the PIA 2021 framework, NMDPRA licensing requirements apply to lubricant importation, storage, and sales, and the June 2025 rollout of the Lubricant Importation Module on the Lube Oil Blending Plant (LOBP) portal adds structured monitoring that can affect lead times and working-capital planning for import-reliant players. FX exposure on base-oil imports and inland distribution infrastructure constraints remain recurring bottlenecks, even as scale assets such as Ammasco's Kano blending facility (150,000 MT per annum) and MRS Oil Nigeria's 200+ outlet network show how capacity and route-to-market reach are used to stabilize supply and improve availability beyond coastal corridors.
Competitive Landscape
The Nigeria lubricants market displays moderate concentration. International majors control premium tiers through exclusive distributor networks and comprehensive OEM-approval lists. Shell (via Ardova), TotalEnergies, ExxonMobil, and Chevron rely on their global R&D strength to supply factory-fill and service-fill oils that meet new engine specifications. Indigenous firms such as MRS Oil Nigeria, Conoil, and Oando integrate blending with downstream retail, capturing cost-sensitive consumers who favor mineral oils but still demand better quality verification. Exchange-rate risk remains the great equalizer; high-import content exposes both multinationals and locals to the same currency swings, keeping cost management central to competitive strategy.
Nigeria Lubricants Industry Leaders
-
Conoil PLC
-
Exxon Mobil Corporation (11 PLC)
-
MRS Oil Nigeria PLC
-
TotalEnergies
-
Shell plc (Ardova PLC)
- *Disclaimer: Major Players sorted in no particular order
Market Opportunities and Future Outlook
Quality and traceability compliance is creating room for suppliers that can document provenance and maintain consistent specifications across channels where counterfeit risk is high. NMDPRA's June 2025 introduction of the Lubricant Importation Module on the LOBP portal elevates the role of licensed import and blending pathways, which supports opportunities for organized marketers, digital-first distributors, and blenders that can align packaging, authentication, and documentation to SON and NMDPRA requirements.
Local blending and capacity additions remain a central opportunity theme. Because base oils are largely imported, margin pressure increases when FX volatility rises. Announced and progressing blending investments, such as Eraskon's USD 50 million plant in Bayelsa State (reported at over 70% completion in May 2024) and CDN Oil and Lubricants' plan disclosed in January 2025 to build a new blending plant in Anambra State, indicate continued efforts to deepen domestic supply. On the premium side, fleet and service-fill adoption of higher-spec formulations supports product demand for packs aligned with newer API and ACEA requirements, particularly where distributors have established networks, including 11Plc's Mobil-branded lubricants footprint and Ardova's positioning through Shell.
Recent Industry Developments
- May 2026: 11Plc told shareholders at its 48th Annual General Meeting in Abuja that it is prioritizing growth in lubricants alongside broader downstream expansion, and reaffirmed that Mobil-branded lubricants continue to be produced in Nigeria to global standards. The statement reinforces continued investment attention on brand-led lubricants in a market where quality assurance and distributor reach are key competitive levers. It also signals that established downstream players are using existing station and distribution footprints to defend share against informal and counterfeit supply.
- November 2025: TotalEnergies and Conoil signed agreements to rebalance offshore assets in Nigeria, involving OPL 257 and OML 136, to support future upstream development. While upstream in nature, the deal highlights ongoing portfolio optimization by major downstream-linked players operating in Nigeria, which can affect local supply priorities, channel investment focus, and commercial partnerships across the broader petroleum value chain. The transaction also underscores the strategic role of Conoil as a domestic partner with downstream presence.
- May 2024: Eraskon reported over 70% completion of its USD 50 million lubricant blending plant in Gbarain, Yenagoa, Bayelsa State, with a stated capacity plan of 64,000 liters per day. The project adds new blending capacity that can increase availability of locally produced lubricants and reduce dependence on finished product imports. Its location in the Niger Delta also improves proximity to industrial and oil and gas demand centers compared with traditional Southwest-heavy supply routes.
Research Methodology Framework and Report Scope
Market Definition and Coverage
For this study, the market covers finished lubricants consumed within Nigeria across automotive and industrial use, measured at the point of domestic demand (including locally blended and imported finished products). Volumes are tracked in liters and then aligned to an implied value view through pricing checks used in validation.
Scope exclusions: Excludes crude oil, fuel products, and unblended base oils traded as feedstock (they are only considered indirectly when they influence local blending supply).
Segmentation Overview
- By Product Type
- Automotive Engine Oil
- Industrial Engine Oil
- Transmission Fluids
- Gear Oil
- Brake Fluids
- Hydraulic Fluids
- Greases
- Process Oil (Including Rubber Process Oil & White Oil)
- Metalworking Fluids
- Turbine Oil
- Transformer Oil
- Other Product Types
- By End-user Industry
- Automotive
- Passenger Vehicles
- Commercial Vehicles
- Two-Wheelers
- Marine
- Aerospace
- Heavy Equipment
- Construction
- Mining
- Agriculture
- Industrial
- Power Generation
- Metallurgy & Metalworking
- Textiles
- Oil and Gas
- Other End-Use Industries
- Automotive
- By Base Stock Type
- Mineral Oil-Based Lubricants
- Synthetic Lubricants
- Semi-Synthetic Lubricants
- Bio-Based Lubricants
Data Sources, Market Sizing, and Validation
Desk Research
Desk research started with public statistics and regulatory signals that shape lubricant consumption in Nigeria. We referred to sources such as Nigeria Customs and port trade releases for import direction, the National Bureau of Statistics for broader transport and petroleum distribution context, and NMDPRA and NUPRC public notices that indicate shifts in licensing and compliance requirements. To anchor demand-side reality, we also used global references such as the International Energy Agency for macro fuel and mobility indicators, and World Bank and IMF datasets for GDP, industrial output, and inflation series.
On the supply and pricing side, we reviewed company annual reports, investor decks, and press releases to understand blending capacity moves, channel footprints, and product positioning. A patent database was used selectively to identify activity around additive packages and lubricant formulations that can affect product mix over time. When public reporting was thin, we used paid subscriptions for company financials and for shipment-level import and export visibility to verify directionally consistent volumes and supplier activity. These desk sources are illustrative and not exhaustive, and other public documents and datasets were also cross-checked for data collection, validation, and clarification.
Primary Interviews and Surveys
We use expert interviews and surveys with lubricant producers, importers, distributors, fleet operators, industrial users, maintenance leaders, and channel participants across Nigeria. Their feedback helps test secondary data, clarify informal or underreported product flows, and examine assumptions on product mix, realized prices, drain intervals, and local blending activity. Follow-up discussions are used when reported demand, capacity use, or pricing differs materially from the available evidence.
Distribution of primary research fieldwork respondents
| Company type | Respondent position |
|---|---|
| Top tier: 30% | CXOs: 15% |
| Mid tier: 50% | Functional/Unit leaders: 35% |
| Smaller Players: 20% | Managers: 50% |
Market-Sizing & Forecasting
The core sizing was built using a top-down demand pool reconstruction, where vehicle parc and usage, industrial activity, and typical drain or re-lube cycles are translated into annual lubricant consumption in liters. Those liters were then split by major use patterns seen in Nigeria, such as gasoline versus diesel fleets, generator-heavy demand, and industrial equipment maintenance cycles, before being mapped to product families using interview-based mix shares.
To keep the totals realistic, the model was cross-checked with selective bottom-up approximations. This included supplier and distributor roll-ups for a sampled set of channels, and a simple volume times average selling price logic for key grades and pack sizes. Inputs that mattered most for Nigeria included vehicle parc growth and age profile, miles driven or operating hours, drain intervals by vehicle class and equipment type, the split between formal retail and workshop-driven sales, and pricing movement tied to base oil and additive costs along with currency and inflation effects. When bottom-up views had gaps, coverage factors were applied transparently, for example expanding from sampled cities to national demand using vehicle concentration and industrial footprint indicators.
Forecasting used scenario analysis supported by time-series smoothing on the volume baseline, then adjustments based on expert consensus on fleet growth, industrial utilization, and expected changes in drain intervals. These changes were tied to product quality and maintenance behavior described during interviews. This approach kept the forecast explainable while reflecting how lubricant demand typically moves in Nigeria, where volumes are often steady but sensitive to macro cycles and import conditions.
Data Validation & Update Cycle
Validation was done through several practical checks so the final numbers do not rely on one single data stream. Our analysts compared modeled volumes against independent signals such as import direction, blending capacity announcements, and what distributors reported about channel throughput, then flagged large variances for a second review.
Anomaly checks were run on mix shares and implied pricing, especially where sudden shifts did not match known changes in regulation, supply availability, or vehicle and industrial activity. When a mismatch stayed unresolved, the team re-contacted selected interviewees to confirm assumptions and remove misunderstandings before sign-off.
Reports are refreshed on an annual cycle, and interim updates are made when material events occur, such as licensing changes, major capacity additions, or sharp currency movement affecting lubricant pricing. Before delivery, an analyst performs a final pass to ensure the dataset reflects the latest public releases and field feedback available at that time.
Mordor Intelligence's Nigeria Lubricants Market Market Size Versus Other Published Estimates
It is common to see different market sizes published for lubricants in Nigeria because the boundaries are not always the same, and because some sources mix volume and value in ways that are not clearly explained. Differences also come from how firms treat informal channels, how they convert liters to dollars, and whether they update pricing assumptions quickly after currency or cost changes.
The table shows a noticeable spread, and in Mordor Intelligence's model the count is kept to finished lubricants consumed in Nigeria, reported in liters, with base oils treated as feedstock drivers rather than part of the market total. In other published figures, the total can move up when base oil trade is added into the same bucket, or when an aggressive price path is used for converting volume into USD without consistent timing and channel markup checks.
Benchmark comparison
| Source | Market Size | Gaps in Research Methodology |
|---|---|---|
| Mordor Intelligence | USD 0.56 B (2025) | |
| Industry Association A | USD 0.50 B (2025) | Often anchored on reported formal sales and FX outlay proxies, which can undercount workshop and informal distribution, and may not normalize for drain interval differences across vehicle and generator use. |
| Trade Journal B | USD 0.72 B (2025) | Commonly blends base oil trade and finished lubricants into one value pool, and may apply a high average price across grades, which inflates totals when pack-size mix and channel margins are not checked. |
Looking across the three figures, the direction of the gap is largely explained by scope boundaries and the way pricing is applied to volumes. By keeping the model tied to clear demand drivers (vehicles, equipment, and maintenance cycles) and then pressure-testing with channel feedback, the estimate stays easier to replicate and interpret for planning decisions.
Key Questions Answered in the Report
What is the projected demand for lubricants in Nigeria by 2031?
Consumption is forecast to reach 671.43 million liters, growing at a 2.95% CAGR from 2026 to 2031.
Which product type currently dominates Nigerian sales?
Automotive engine oils lead the Nigeria lubricants market, holding 38.45% of 2025 volumes.
How fast are synthetic lubricants expanding?
Synthetic grades are expected to log a 4% CAGR, outpacing mineral oils due to OEM and fleet adoption.
Which end-user group is forecast to grow the quickest?
Industrial users, especially manufacturing and power plants, are set to expand at 5.09% CAGR through 2031.
What geographic corridor consumes the most lubricants?
The Lagos-Ogun-Ibadan region accounts for most of national demand thanks to its vehicle density and industrial base, absorbing about 39.45% of national volumes in 2025.