
Market Overview
| Study Period | 2020 - 2031 |
|---|---|
| Forecast Data Period | 2026 - 2031 |
| Base Year Market Size (2025) | USD 27.76 Billion |
| Market Size (2026) | USD 31.04 Billion |
| Market Size (2031) | USD 54.3 Billion |
| Growth Rate (2026 - 2031) | 11.82% CAGR |
| Market Concentration | Medium |
Major Players *Disclaimer: Major Players sorted in no particular order Image © Mordor Intelligence. Reuse requires attribution under CC BY 4.0. | |
Nigeria Facility Management Market Analysis by Mordor Intelligence
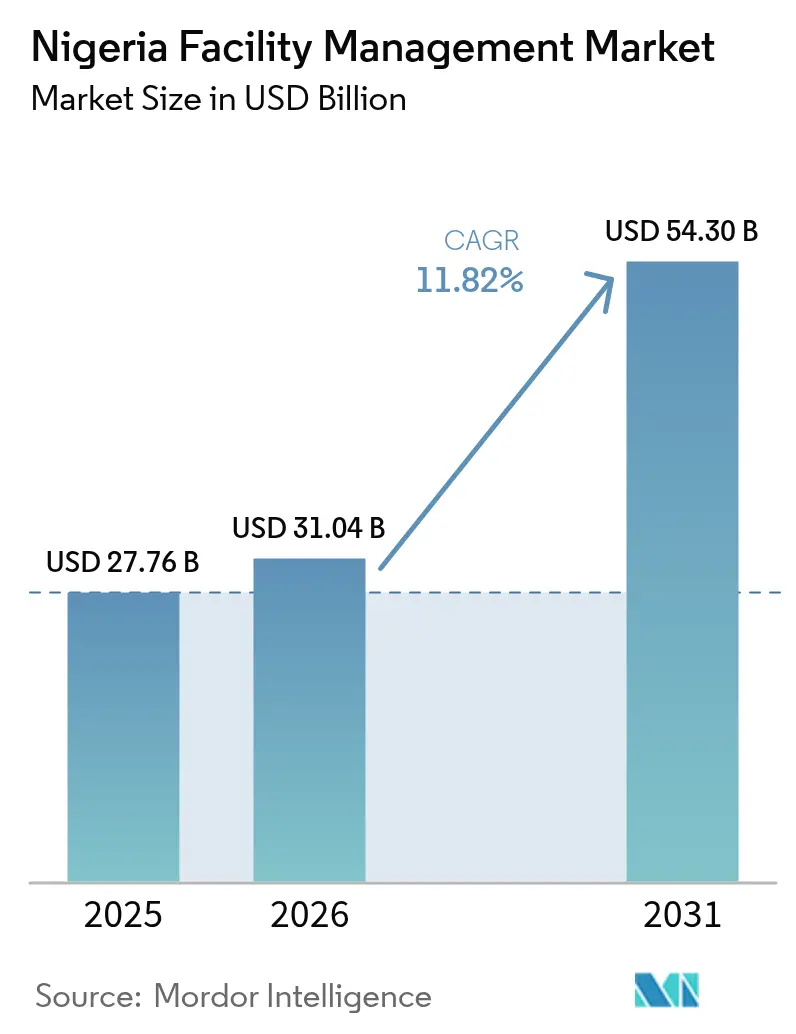
The Nigeria facility management market size was valued at USD 27.76 billion in 2025 and estimated to grow from USD 31.04 billion in 2026 to reach USD 54.3 billion by 2031, at a CAGR of 11.82% during the forecast period (2026-2031). Rapid urban expansion in Lagos, Abuja and Port Harcourt, mounting infrastructure investments such as the USD 20 billion Ogidigben Gas Revolution Industrial Park, and investor insistence on ISO 41001-aligned ESG programs continue to pull demand upward. Power-grid unreliability—averaging 32 monthly outages—pushes clients toward service providers that can integrate renewable generation, IoT-based energy monitoring, and predictive maintenance into a single offering. Lower IoT sensor prices—now below USD 5 per unit—plus nationwide 4G and emergent 5G coverage have slashed adoption barriers for smart-building systems that cut operating costs by 15-30%. Meanwhile, cement market concentration and the 2024 minimum-wage hike are intensifying cost pressures, encouraging a shift to outcome-based, integrated contracts that deliver measurable savings across energy, labour and materials.
Key Report Takeaways
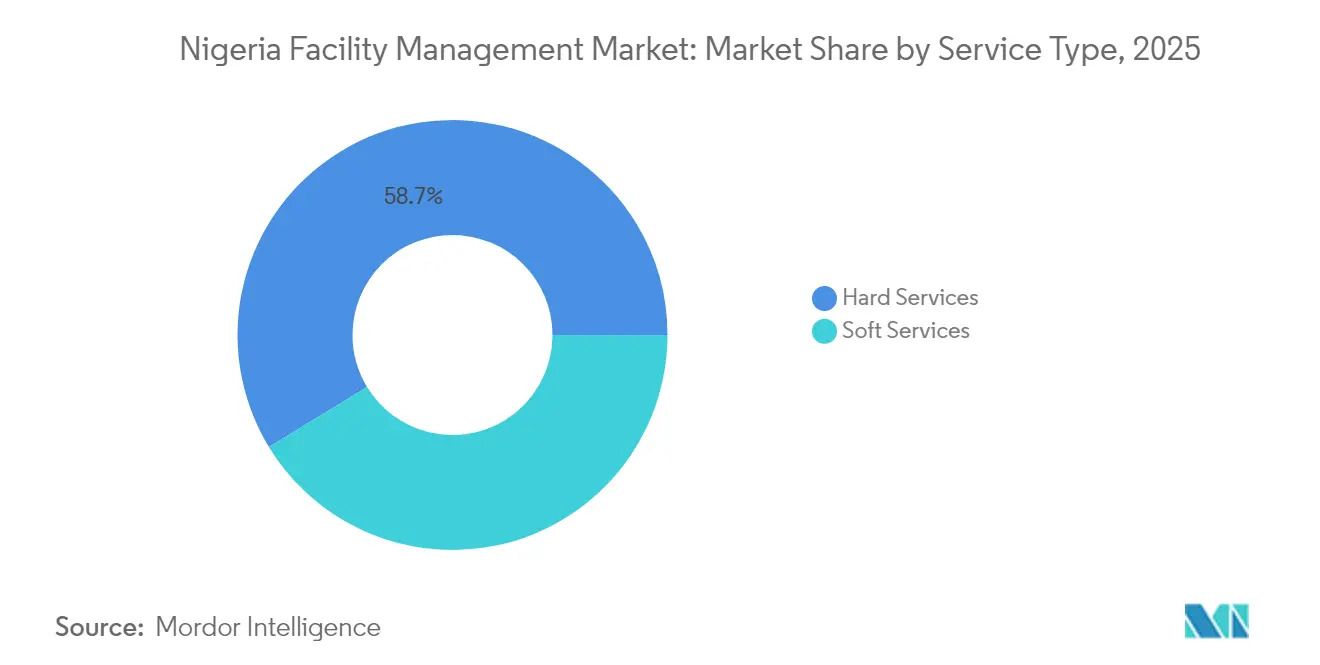
- By service type, hard services held 58.71% of the Nigeria facility management market share in 2025; soft services are on track to expand at a 13.02% CAGR through 2031.
- By offering, the outsourced model captured 66.02% share of the Nigeria facility management market size in 2025 and is projected to grow at a 13.86% CAGR between 2026-2031.
- By end-user, commercial facilities commanded 39.62% market share in 2025, while institutional and public-infrastructure properties are advancing at a 14.79% CAGR to 2031.
Note: Market size and forecast figures in this report are generated using Mordor Intelligence’s proprietary estimation framework, updated with the latest available data and insights as of 2026.
Nigeria Facility Management Market Trends and Insights
Drivers Impact Analysis*
| Driver | (~) % Impact on CAGR Forecast | Geographic Relevance | Impact Timeline |
|---|---|---|---|
| Urbanization and population growth | +2.1% | Lagos, Abuja, Port Harcourt with spillover to secondary cities | Medium term (2-4 years) |
| Infrastructure investment priorities | +1.8% | National, with concentration in Lagos-Abuja corridor | Long term (≥ 4 years) |
| Occupancy-rate fluctuations | +1.2% | Lagos Central Business District, Abuja Federal Capital Territory | Short term (≤ 2 years) |
| Labor and safety regulations | +0.9% | National, with stricter enforcement in Lagos and Abuja | Medium term (2-4 years) |
| Green-bond investors requiring ISO 41001-aligned ESG-compliant FM programs | +1.5% | Lagos, Abuja commercial districts | Long term (≥ 4 years) |
| Falling IoT sensor costs and nationwide 4G coverage | +2.2% | Urban centers with 4G infrastructure, expanding to tier-2 cities | Medium term (2-4 years) |
| Source: Mordor Intelligence | |||
Urbanisation and Population Growth Drive Facility Demand
Urban Nigeria now houses nearly 120 million residents, with Lagos alone growing at 13.6% annually and generating 25% of national GDP.[1]African Cities Research Consortium, “Lagos: City Scoping Study,” african-cities.org By 2050, 70% of citizens will live in cities, fuelling long-term need for professional property upkeep across housing estates, commercial towers and mixed-use hubs. This demographic momentum pushes portfolio owners to outsource preventive maintenance, security and waste services to meet tenancy expectations despite electricity and water shortfalls. The Nigeria facility management market therefore captures recurring revenue streams from both brownfield retrofits and greenfield megaprojects that require cradle-to-grave asset support. Facility managers that pair community-level services—sanitation, lighting, public-space care—with digital dashboards are emerging as partners of choice for municipal authorities seeking cost-efficient urban management. Concurrently, state governments’ push to formalise informal settlements expands addressable stock for compliant providers as residents demand reliable water, lighting and waste solutions.
Infrastructure Investment Priorities Shape Market Opportunities
Flagship schemes such as the USD 20 billion Ogidigben Gas Revolution Industrial Park and the Abuja African Medical Centre of Excellence create direct, multi-decade O&M opportunities for hard-service contractors, energy specialists and soft-service vendors. Public-private-partnership models overseen by the Infrastructure Concession Regulatory Commission guarantee 20- to 30-year concession windows, anchoring predictable cashflows. Construction majors such as Julius Berger are vertically integrating into FM, leveraging their civil-works track records to secure whole-life service contracts on projects like the 48,400 m² NUPRC HQ in Abuja. The Nigeria facility management market therefore rewards firms that can bridge capital-project execution with lifecycle O&M, offering bundled MEP, energy and cleaning services under performance-linked SLAs.
Green-Bond Investors Mandate ESG-Compliant FM Programs
Green-bond issuances funding new offices and logistics parks now stipulate ISO 41001-aligned operations throughout the lease term. Buildings certifying to LEED or EDGE during construction must retain those credentials post-handover, shifting accountability to facility managers for energy, waste, water and occupant wellbeing metrics. Empirical work on Nigerian listed firms links higher ESG scores to stronger ROA and ROE, illustrating tangible financial upside for owners that partner with compliant FM providers.[2]Oyegunle-Esimaje, “ESG Score and Corporate Financial Performance,” preprints.org Consequently, Nigeria facility management market leaders embed renewable-energy microgrids, recycling programs and digital indoor-air-quality monitoring to help asset owners access lower-cost capital.
IoT Sensor Cost Reductions Enable Smart-Building Adoption
Sensors priced below USD 5 and rising 5G coverage—12.3 million expected connections by 2025—have moved predictive maintenance from luxury to baseline requirement.[3]GSMA Intelligence, “5G in Africa 2023,” gsma.com A typical 20-storey Lagos office deploying 1,200 LoRaWAN nodes can recover installation costs in 36 months via 18% electricity savings validated by Harold Brothers’ BMS benchmarks. Nigeria facility management market incumbents now bundle cloud analytics, energy meters and flexible workspace software to provide CFOs with live dashboards linking OPEX, occupancy and ESG metrics. This technology layer differentiates providers amid a fragmented field of informal vendors lacking data capability.
Restraints Impact Analysis*
| Restraint | (~) % Impact on CAGR Forecast | Geographic Relevance | Impact Timeline |
|---|---|---|---|
| Profitability squeeze among FM firms | -1.4% | National, with acute pressure in Lagos and Abuja | Short term (≤ 2 years) |
| Workforce participation and skills gap | -0.8% | National, with concentration in technical roles | Medium term (2-4 years) |
| National grid outages forcing 18-25% higher OPEX | -2.1% | National, with severe impact in manufacturing regions | Short term (≤ 2 years) |
| Large informal FM workforce offering cut-rate services | -1.2% | Urban centers, particularly Lagos informal settlements | Medium term (2-4 years) |
| Source: Mordor Intelligence | |||
Profitability Squeeze Among FM Firms
The 2024 minimum-wage increase to NGN 70,000 (USD 90.25) per month lifted direct labour costs by 133%, tightening margins on fixed-price FM contracts. Simultaneously, cement prices doubled to NGN 10,000 (USD 6.25) per 50 kg bag on Lagos retail shelves as Dangote, BUA and Lafarge—who jointly hold 100% clinker capacity—passed energy costs to downstream buyers. Facility managers reliant on civil-works and MEP spare-part inventories must now renegotiate annual escalators, pivot to outcome-based SLAs or integrate renewable microgrids that lower diesel spend by 25–35%. Capitalising on this transition, Nigeria facility management market leaders bundle energy-as-a-service with long-term material sourcing agreements to lock-in cost visibility.
National Grid Outages Force Higher OPEX
An academic comparison of grid versus generator costs shows a 3.9× price differential for a 20 kVA diesel set operating six hours daily, forcing facilities to budget NGN 157,095 (USD 98.18) each month solely for fuel. Compounded by 32 collapses of the transmission network every month, FM providers allocate up to one-quarter of contract value to backup power, undermining profitability and sustainability. Leading operators respond by installing rooftop PV arrays sized at 30 kWp for mid-rise offices, integrated with lithium-ion storage that provides three-hour autonomy and pays back in under five years when diesel is USD 1.60 per L. As a result, Nigeria facility management market buyers increasingly specify renewable-energy performance guarantees in bid documents, favouring firms that can model load curves and interconnectivity with distribution companies.
*Our forecasts treat driver/restraint impacts as directional, not additive. The impact forecasts reflect baseline growth, mix effects, and variable interactions.
Segment Analysis
By Service Type: Technical Dominance With Rapid Soft-Service Upswing
Hard services accounted for 58.71% of the Nigeria facility management market size in 2025 as power-system unreliability, water scarcity and safety regulations required continuous MEP, HVAC and fire-protection expertise. The segment’s depth ranges from 24/7 generator maintenance to corrosion control of structural steel in coastal zones. Within hard services, asset-management contracts exceed five years on average, reflecting owners’ need for lifecycle cost certainty. IoT-enabled vibration analytics, deployed on centrifugal chillers, detect faults seven days earlier than manual inspection, reducing unplanned downtime by 30%. Soft services, although smaller, are accelerating at 13.02% CAGR as multinationals outsource cleaning, catering and mailroom tasks to comply with stricter ESG and labour laws. A bank headquartered in Victoria Island cut overtime by 18% after migrating 41 roles to an integrated soft-service bundle, proving cost-effectiveness amid wage inflation.
Soft services are benefiting from Lagos State’s 2025 mandatory building-hygiene regime, which requires licensed providers to submit quarterly pathogen audits. Firms leveraging electrostatic-spray cleaning cut chemical spend 14% and achieve 25% quicker room-turn times in hospitality settings. These metrics underpin the Nigeria facility management market share shift toward providers integrating robotics for floor-care and AI chatbots for occupant-service requests. Over the forecast window, bundled solutions that unify technical, security and janitorial tasks under single governance structures are expected to capture another 5–7 percentage-points of contract awards.


By Offering Type: Outsourcing Secures Clear Leadership
Outsourced contracts controlled 66.02% of the Nigeria facility management market share in 2025 and are expanding at a 13.86% CAGR, reflecting organisations’ appetite for single-invoice, KPI-driven partnerships. Integrated Facility Management (IFM) grew fastest, buoyed by international corporates demanding regional alignment with global SLAs. IFM providers commit to 5-year tenures, achieving 8–12% OPEX cuts through vendor consolidation and data-driven asset strategies.
In-house management’s 33.98% share is projected to erode as regulatory complexity around fire, labour and environmental compliance rises. Small-and-medium landlords, previously reliant on informal caretakers, now face mandatory safety-file submissions and insurance audits. Outsourced specialists provide compliance matrices, continuous training and digital document vaults, eliminating penalties that can reach NGN 2 million per infringement. These factors underpin sustained migration toward external partners, keeping the Nigeria facility management industry strategically attractive for global entrants such as CBRE and ISS that import process discipline and scale procurement.
By End-User Industry: Commercial Reigns, Institutional Outpaces
Commercial buildings contributed 39.62% of 2025 revenue but institutional and public infrastructure facilities are projected to post a 14.79% CAGR through 2031, powered by health, education and transport modernisation programs. In the commercial segment, Nigeria facility management market size for Grade-A offices in Lagos CBD surpassed USD 1.91 billion in 2026 on the back of fit-out densification and co-working uptake. Retail malls are adopting destination-experience strategies, outsourcing guest-services and event-management to FM providers to keep footfall resilient against e-commerce headwinds. Public-sector contracts show rising professionalism as ministries adopt UK-style NEC4 service agreements that allocate risk through KPIs. Transport-hub facilities—rail, airport and BRT depots—now demand crowd-flow analytics and anti-tamper surveillance as security becomes paramount. Meanwhile, manufacturing plants in the Niger Delta apply integrated safety, environmental and asset-care programs to satisfy both local regulators and overseas financiers. These cross-sector shifts affirm the Nigeria facility management market’s trajectory toward complex, outcome-linked engagements rather than commodity manpower supply.
Geography Analysis
Lagos State remains the linchpin of the Nigeria facility management market, representing more than one-third of national spending due to its 12 million urban residents and concentration of Grade-A offices. The city hosts 410,000 m² of premium workspace—71% of national supply—and depends on advanced HVAC, lift and security systems that require continuous monitoring to offset 32 average grid failures per month. Abuja’s share is expanding as state-backed office complexes adopt IFM contracts to guarantee uptime for policymaking and diplomatic missions. Facilities such as the 48,400 m² NUPRC headquarters employ digital command centres that link access control, energy dashboards and predictive MEP maintenance under single governance, reducing unplanned downtime by 27% year-over-year.
Port Harcourt and the wider Niger Delta present high-value, specialised demand profiles. Oil-and-gas processing facilities contract FM firms for hazardous-area maintenance, flare-stack inspections and corrosion-monitoring programs. Providers that combine ATEX-certified technicians with IoT sensors secure multi-year deals that carry above-market margins. The Nigeria facility management market size for industrial sites in Rivers State exceeded USD 916 million in 2026, despite security premiums embedded in guard-force contracts. Parallelly, Kano, Kaduna and Ibadan illustrate frontier growth where commercial real estate and light-manufacturing clusters leverage expanding 4G backbone to onboard remote BMS and workforce-management apps. National broadband coverage—94% 4G and 11% 5G as of Q1 2025—creates ubiquity for cloud-based FM platforms, permitting Lagos-based command centres to manage buildings in Kebbi or Calabar with identical SLA sophistication. As transport corridors such as the Lagos-Calabar Coastal Highway unlock new logistics parks, early mover FM firms are embedding design-for-maintenance principles before ground-breaking, securing annuity streams at reduced competitive intensity. Over the forecast horizon, regional diversification suggests the Nigeria facility management market will shift from its current coastal concentration toward an evenly distributed national footprint.
Regulatory Landscape
Nigeria's facility management (FM) compliance environment is shaped by federal and state requirements that affect building operations, maintenance documentation, and contractor eligibility. At the federal level, the National Building Code sets baseline standards across design, construction, and post-construction maintenance, while the National Maintenance Framework for public buildings (approved in 2019) formalizes maintenance protocols and procurement pathways for registered service providers handling public assets.
For digitally enabled FM and telecom-heavy estates (BTS sites, data centers, fibre routes, enterprise campuses), the Nigerian Communications Commission (NCC), under the Nigerian Communications Act 2003, regulates infrastructure deployment through technical specifications, collocation, and infrastructure sharing rules, alongside local permitting requirements for towers and masts. In Lagos, enforcement intensity is higher due to the Lagos State Building Control Agency (LASBCA) framework, which drives periodic building control and maintenance inspections and increases demand for outsourced providers that can maintain audit-ready compliance records and HSE systems across multi-site portfolios.
Value Chain Analysis
The Nigeria FM value chain starts with asset owners and occupiers (commercial offices, banks, telecom operators, industrial plants, hospitals, and government estates) who specify service levels and compliance requirements, followed by bundled and integrated FM providers that mobilize hard services (MEP, HVAC, fire and life safety, power systems) and soft services (cleaning, security, waste, catering). These providers rely on a network of OEMs and specialist subcontractors for HVAC, lifts, fire systems, security electronics, and BMS/IoT integrations, supported by workforce partners, training providers, and compliance auditors aligned to standards such as ISO 41001 for ESG-linked reporting.
Downstream delivery increasingly combines field execution with remote monitoring through CAFM platforms and sensor networks, reflecting demand for predictive maintenance and energy management amid frequent grid outages (32 per month on average in the report context). Inputs and bottlenecks concentrate around power and MRO availability, including diesel logistics, generator and electrical spares, and imported components, which raise cost and lead-time risk. As a result, FM firms move toward local sourcing agreements and tighter inventory control, including digital fuel monitoring. Technology enablement is moving deeper into day-to-day operations, as illustrated by Provast Limited integrating IoT-enabled monitoring and AI-driven analytics into managed facilities to improve asset visibility and predictive maintenance workflows.
Competitive Landscape
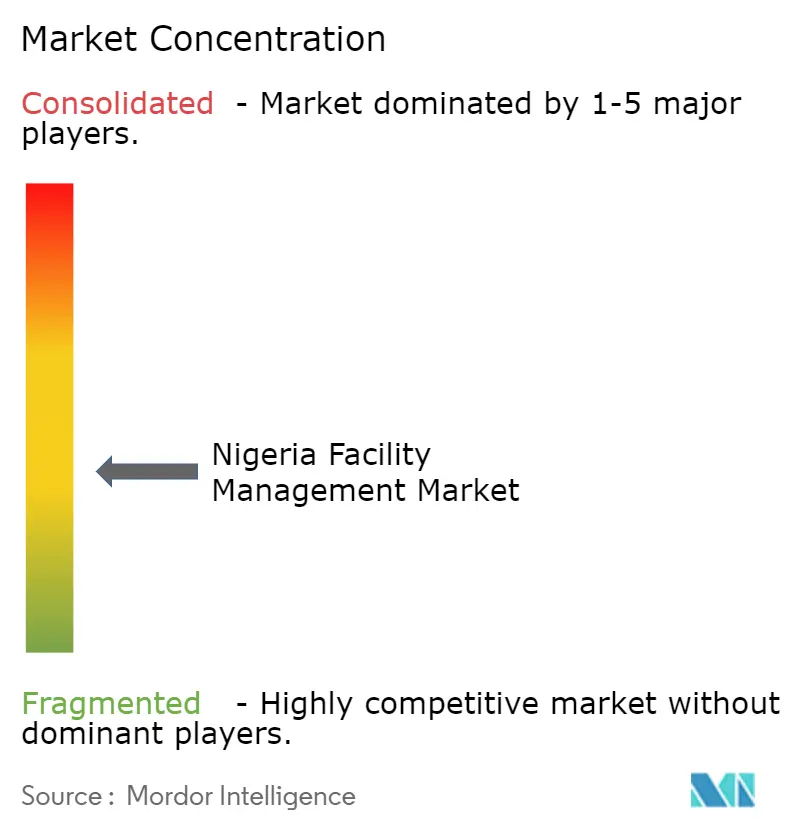
The market remains moderately fragmented: the top five formal players hold roughly 35-40% revenue, while more than 500 informal micro-providers service single sites. Global majors CBRE, ISS and Knight Frank extend process rigour, technology toolkits and ESG audit know-how, whereas indigenous leaders Alpha Mead and UPDC FM provide cultural proximity and cost-adapted solutions. Julius Berger’s FM division leverages EPC heritage to win lifecycle deals in government and oil-&-gas segments, often bundling civil alterations with preventive maintenance. CBRE’s 2025 integration of Turner & Townsend created a USD 3 billion project and facility management arm that offers Nigerian clients unified design-build-operate pathways.
Strategic plays revolve around technology. ISS assigns site teams handheld apps for real-time work-order tracking; this delivered a 16% productivity jump on a six-site pilot in Lagos. Alpha Mead recently unveiled an IoT platform co-developed with a local telco, enabling property owners to view generator load factors and diesel stock levels via mobile dashboard, preventing fuel-theft shrinkage. Commercial bundling is rising: a 2025 tender by a pan-African bank awarded IFM plus co-working fit-out services in a single 10-year contract—illustrating convergence of property, workplace and energy management scopes.
Price competition remains intense at the low-complexity end, where informal providers undercut by 25–30% but lack compliance assurance. Formal operators counter through value-engineering, offering performance-based energy savings that neutralise headline-price gaps within two years. ESG reporting competency is now a decisive bid criterion, leading CBRE and ISS to publish Nigeria-specific sustainability indices in 2025 tenders. Given these dynamics, the Nigeria facility management industry exhibits accelerating consolidation via M&A and strategic alliances, with scale players targeting a 50% share of formal revenue by 2030.
Nigeria Facility Management Industry Leaders
Total Facilities Management Limited
Global PFI Limited
Broll Property Group
Greenkey Facility Management Services
Solid Rock Facility Management Co.
- *Disclaimer: Major Players sorted in no particular order

Market Opportunities and Future Outlook
Public-asset preservation and standardized contracting are creating larger, more formal service pathways for FM operators. In January 2026, the Federal Ministry of Housing and Urban Development, through the Department of Federal Public Assets Maintenance (FPAM), initiated the rollout of standard operating procedures and compliance manuals across MDAs to institutionalize proactive maintenance. This expands demand for outsourced partners that can execute documented preventive maintenance regimes and provide audit trails. In June 2026, the Federal Government unveiled a Model PPP Agreement to standardize contract management, performance monitoring, and risk allocation for infrastructure projects, improving bankability for long-tenure O&M and integrated FM bids where KPIs and lifecycle outcomes are central to contract terms.
Digital infrastructure buildout is also creating whitespace for technical FM providers that can manage distributed networks while meeting safety and data governance requirements. A financing agreement finalized in January 2026 for the USD 2 billion BRIDGE project (targeting 90,000 km of fibre) and the April 2026 invitation for private-sector pre-qualification to connect over 770 local governments expand the footprint of assets that need right-of-way upkeep, site security, power resilience, and routine maintenance across diverse geographies. As these programs move through procurement, FM firms with capabilities spanning field services, energy systems, and remote monitoring can pursue multi-site frameworks, while differentiating on building-code obligations and data protection expectations referenced in Nigeria's TMT governance discussions (such as Privacy by Design practices).
Recent Industry Developments
- July 2026: IFMA Nigeria Chapter outlined plans to establish an IFMA Learning and Innovation Centre, alongside a Research and Development Platform and a Talent Bank, to address sector skill gaps. The effort supports deeper professionalization and strengthens the pipeline for ISO 41001-aligned FM competencies needed for integrated contracts.
- December 2025: IFMA Nigeria Chapter and Venco Africa signed a memorandum of understanding focused on digital transformation and PropTech adoption across Nigeria's facility management and real estate sectors. The collaboration targets operational automation use cases (such as utility vending and service-charge workflows), reinforcing the shift toward data-led service delivery.
- August 2025: Global Property and Facilities International (GPFI) Group announced the acquisition of Filmo FM's facility management business during its 25th-anniversary milestone. The transaction underscores ongoing consolidation among formal providers and expands the scale at which integrated and multi-site FM offerings can be delivered.


Research Methodology Framework and Report Scope
Market Definition and Coverage
For this study, the Nigeria facility management market is defined as the value of hard and soft services delivered to operate, maintain, and support buildings and sites across end users in Nigeria, covering both in-house delivery and outsourced contracts.
Scope exclusions: Standalone construction and new-build project costs (outside ongoing operations and maintenance) are not counted as facility management spend.
Segmentation Overview
- By Service Type
- Hard Services
- Asset Management
- MEP and HVAC Services
- Fire Systems and Safety
- Other Hard FM Services
- Soft Services
- Office Support and Security
- Cleaning Services
- Catering Services
- Other Soft FM Services
- Hard Services
- By Offering Type
- In-house
- Outsourced
- Single FM
- Bundled FM
- Integrated FM
- By End-User Industry
- Commercial (IT and Telecom, Retail, Warehousing)
- Hospitality (Hotels, Restaurants)
- Institutional and Public Infrastructure (Govt, Transport)
- Healthcare (Public and Private Facilities)
- Industrial and Process (Manufacturing, OandG, Mining)
- Other End-user Industries (Multi-house Residential, Leisure)
Data Sources, Market Sizing, and Validation
Desk Research
Desk research helped map the size of Nigeria's addressable building and infrastructure base, and how FM spending typically splits between hard services and soft services. We relied on public sources such as the National Bureau of Statistics (sector output and price trends), the Central Bank of Nigeria (macro indicators and investment signals), Nigeria Customs Service trade statistics (selected equipment and spares signals), and international sources such as the World Bank and the International Labour Organization for context on construction activity, employment, and services intensity.
To convert these signals into practical model inputs, we also reviewed company annual reports, investor presentations, procurement notices, and reputable press coverage tied to major commercial properties, hospitals, industrial sites, and public infrastructure. In addition, paid subscriptions for company financials and intelligence, plus a shipment-level import and export database and a global contracts and tenders database, were used selectively to cross-check provider revenue patterns and outsourcing momentum. The desk sources listed here are illustrative, and many other public documents were referred to for data collection, validation, and clarification.
Primary Interviews and Surveys
Primary work was used to validate how FM contracts are structured in Nigeria, what buyers include in their FM scope, and how pricing changes by service line and city cluster. We spoke with a mix of facility owners, service providers, and channel partners, then reconciled differences by end-user type (commercial, institutional, industrial, and healthcare) and by common delivery models such as single service, bundled, and integrated arrangements.
Distribution of primary research fieldwork respondents
| Company type | Respondent position | Region |
|---|---|---|
| Top tier: 28% | CXOs: 12% | APAC: 45% |
| Mid tier: 56% | Functional/Unit leaders: 41% | EMEA: 31% |
| Smaller Players: 16% | Managers: 47% | Americas: 24% |
Market-Sizing & Forecasting
The market size was built using top-down and bottom-up logic, so the totals stay grounded in Nigeria-specific demand signals and also remain realistic at the service line level. In the top-down view, building and infrastructure activity, services intensity, and outsourcing adoption are used to reconstruct an annual FM spend pool that can be split into hard services and soft services, and then into delivery models such as in-house, single outsourced, bundled, and integrated.
Those totals were then corroborated with selective bottom-up checks, including sampled contract values, typical annual spend per facility type, and partial provider revenue roll-ups where disclosures were available. When some categories had thin public visibility, gaps were handled by using conservative penetration ranges validated in interviews, followed by adjustments based on city concentration (for example, Lagos and Abuja) and end-user mix.
For forecasting, scenario analysis was used so the base case reflects how demand typically responds to macro conditions in Nigeria. Key inputs included outsourcing rate changes, wage inflation and minimum wage expectations, energy and utilities cost pressure that pushes maintenance planning, construction and real estate utilization trends, and the shift toward integrated contracts for multi-site portfolios. These variables were stress-tested with expert views before the forward curve was finalized.
Data Validation & Update Cycle
Validation was done through multiple checks so the final numbers do not rely on any single data series. We compared modeled outputs against independent signals such as reported services output trends, disclosed contract awards, and implied spend per facility across major end-user groups, then reviewed outliers that looked too high or too low.
Before sign-off, assumptions were re-checked by a second analyst, and respondents were re-contacted when pricing, outsourcing share, or service mix appeared inconsistent with market reality. Reports are refreshed annually, with interim updates when material events occur, such as a sharp currency move, policy shifts affecting public infrastructure spending, or a visible change in outsourcing behavior. Right before delivery, a final review pass is completed so clients receive the latest updated view.
Mordor Intelligence's Nigeria Facility Management Market Estimate Compared With Other Published Estimates
Published market numbers for Nigeria facility management can look far apart, even when the topic name is the same. The gaps usually come from what each study counts as FM spend, how it treats in-house delivery versus outsourced services, and which end users and service lines are included in the total.
Some estimates expand the total by folding in broader property or construction-related costs that sit next to FM budgets. In Mordor Intelligence, the market is counted only when the activity fits ongoing hard and soft facility services (such as MEP and HVAC upkeep, fire safety systems maintenance, cleaning, security, and catering) across in-house and outsourced delivery, and the totals are cross-checked with contract structures and pricing ranges shared by local buyers and providers.
Benchmark comparison
| Source | Market Size | Gaps in Research Methodology |
|---|---|---|
| Mordor Intelligence | USD 27.76 B (2025) | |
| Industry Association A | USD 32.10 B (2025) | Uses a broader spend lens that can include adjacent property operations and select refurbishment-related costs, which inflates totals beyond recurring hard and soft FM services. |
| Global Consultancy B | USD 24.90 B (2025) | Leans on a narrower outsourced-only interpretation and applies conservative outsourcing penetration and pricing progression, which reduces the counted value versus models that also size in-house delivery. |
The table indicates that most of the spread is explained by two practical choices, whether adjacent property costs are included and whether in-house delivery is sized alongside outsourcing. By keeping service definitions specific and then validating pricing, service mix, and outsourcing share with local checks, the estimate stays traceable to defined variables and repeatable steps.


Key Questions Answered in the Report
What is the current size of the Nigeria facility management market?
The market is valued at USD 31.04 billion in 2026 and is forecast to reach USD 54.3 billion by 2031, implying a 11.82% CAGR.
Which service segment dominates the market?
Hard services hold 58.71% share, largely due to persistent infrastructure gaps and the need for technical solutions such as MEP and power-backup maintenance.
Why are outsourced models gaining ground?
Organisations increasingly prefer integrated, KPI-driven contracts that transfer compliance and operational complexity to specialised providers, pushing outsourced penetration to 66.02% in 2025.
How do power outages influence facility management costs?
Grid unreliability forces facility managers to budget 18–25% higher OPEX for generators and fuel, spurring interest in solar-plus-storage microgrids that trim diesel consumption by up to 35%.
What role does ESG play in Nigeria’s facility management contracts?
Green-bond investors and new building codes require ISO 41001-aligned operations, prompting FM firms to integrate energy-efficiency, waste-reduction and worker-safety programs to secure long-term deals.
Which regions outside Lagos are emerging for facility management growth?
Abuja’s government district, Port Harcourt’s oil-and-gas corridor and secondary cities like Kano and Ibadan are expanding rapidly due to infrastructure investments and growing commercial real-estate stock.
Page last updated on:


