
| Study Period | 2018 - 2030 |
| Base Year For Estimation | 2024 |
| Forecast Data Period | 2025 - 2030 |
| Market Volume (2025) | 136.7 MW |
| Market Volume (2030) | 279.4 MW |
| CAGR | 15.37 % |
| Market Concentration | High |
Major Players*Disclaimer: Major Players sorted in no particular order |


Nigeria Data Center Market Analysis
The Nigeria Data Center Market size is estimated at 136.7 MW in 2025, and is expected to reach 279.4 MW by 2030, growing at a CAGR of 15.37%. Further, the market is expected to generate colocation revenue of USD 251.1 Million in 2025 and is projected to reach USD 578.1 Million by 2030, growing at a CAGR of 18.15% during the forecast period (2025-2030).
Nigeria's data center infrastructure is undergoing rapid transformation as the country positions itself as a key digital hub in Africa. The market is characterized by increasing investments in Tier 3 data centers in Nigeria facilities, which accounted for 51.44 MW of IT load capacity in 2022, demonstrating the industry's commitment to maintaining high operational standards. This transformation is supported by the growing internet penetration, with the Nigerian Communications Commission reporting over 152.71 million internet subscribers as of October 2022. The emergence of new data center companies in Nigeria and the expansion of existing facilities are reshaping the competitive landscape, with major players focusing on establishing carrier-neutral facilities to serve the growing demand for colocation data center services.
The market is witnessing a significant shift towards higher-tier facilities, with a complete absence of Tier 1 and Tier 2 data centers. This trend reflects the industry's focus on future-ready infrastructure capable of supporting advanced technologies. Service providers are increasingly investing in Tier 3 and Tier 4 facilities to accommodate the growing demand for cloud-native technologies, artificial intelligence, machine learning, and IoT applications. The construction of Galaxy Backbone's Tier 4 data center facility, with a capacity of 2.2 petabytes for cloud and disaster recovery services, exemplifies this trend towards advanced infrastructure development.
Data localization initiatives and digital transformation efforts are driving substantial changes in the Nigerian data center market. The government's emphasis on local data hosting has led to increased investments in domestic data center facilities. Industry stakeholders are working to enhance local cloud hosting capabilities, with officials from NITDA targeting a 30% growth in local cloud hosting by 2024. This push for data sovereignty is attracting both local and international investors, leading to the development of more sophisticated data center facilities across the country.
The regional distribution of data centers in Lagos presents both opportunities and challenges for market growth. Lagos remains the primary hub for data center development, although power infrastructure remains a significant concern with approximately 80% of the city's electricity being supplied by fuel generators as of March 2022. This has led to the exploration of alternative locations such as Sagamu and Ikoyi, which offer the necessary amenities for data center operations. The industry is also benefiting from the establishment of trade-free zones like the Lekki Free Zone, which provides business benefits and attracts investment in data center infrastructure.
Nigeria Data Center Market Trends
increase in the use of smartphones, increasing use of online shopping platforms, and increase mobile internet data usage to boost market growth
- As companies were forced to switch to virtual platforms and related options for continuing work during the COVID-19 pandemic, it contributed to the increase in data usage among smartphone users.
- This could also be attributed to an increase in the use of smartphones as a preferred device to access the Internet. The data suggests that about 84.4% of Nigerians access the internet through smartphones and tablets, compared to 15.7% using desktops. Also, in 2020, Nigeria recorded online transactions worth about USD 12 billion through different media and platforms.
- Similar trends were observed in the buying trends of the customers, preferring online shopping platforms, which is another crucial factor contributing to the overall data traffic in the country. For instance, as of 2022, one of the major e-commerce service providers, jumia.com.ng, reported about 7.9 million visitors from Nigeria, comprising about 31% of the total visitors, despite its presence across 13 African countries. As a result, Nigerians prefer online platforms, indicating trends in data generation.
- In the third quarter of 2022, Nigeria recorded more than 5 million subscribers, adding to data consumption. The rate of subscriber addition with network upgrades and constant grid expansion adds to the overall mobile internet data usage. Network evolution, coupled with changing internet usage habits in Nigeria, would result in increased data traffic across smartphones.

Understand The Key Trends Shaping This Market
Download PDF
Increasing mobile phone penetration and increasing mobile phone subscriptions to boost market growth
- While the mobile phone penetration rate is increasing in Nigeria, smartphone users account for about 10-20% of the total users. The country requires better smartphone penetration or more platforms to reach the masses, contributing to the demand for data generation and analysis.
- According to a report, smartphone penetration is expected to increase from 44% in 2021 to about 64% by 2025, which is higher than the Sub-Saharan African average penetration rate of 61% in 2025. Being one of the most populous countries in Africa, the population and rate of development would surely help increase the penetration rate.
- The data also suggests that new mobile subscriptions play a vital role in setting these trends. Nigeria projects promising numbers of new mobile phone subscribers, contributing to the overall smartphone penetration. The data suggested an increase of about 18 million mobile subscribers in the total subscribers in 2021 (515 million), which is one of the largest additions compared to other African countries.

OTHER KEY INDUSTRY TRENDS COVERED IN THE REPORT
- Upgradation of existing 2G sites to leverage 2G networks' vast coverage and introducing 4G and 5G networks to boost market growth
- Deployment of 5G and expansion programs to support rising demands through smart city initiatives including fiber connectivity to drive market growth
- Deployment of FTTH and maintenance of network infrastructure to drive market growth
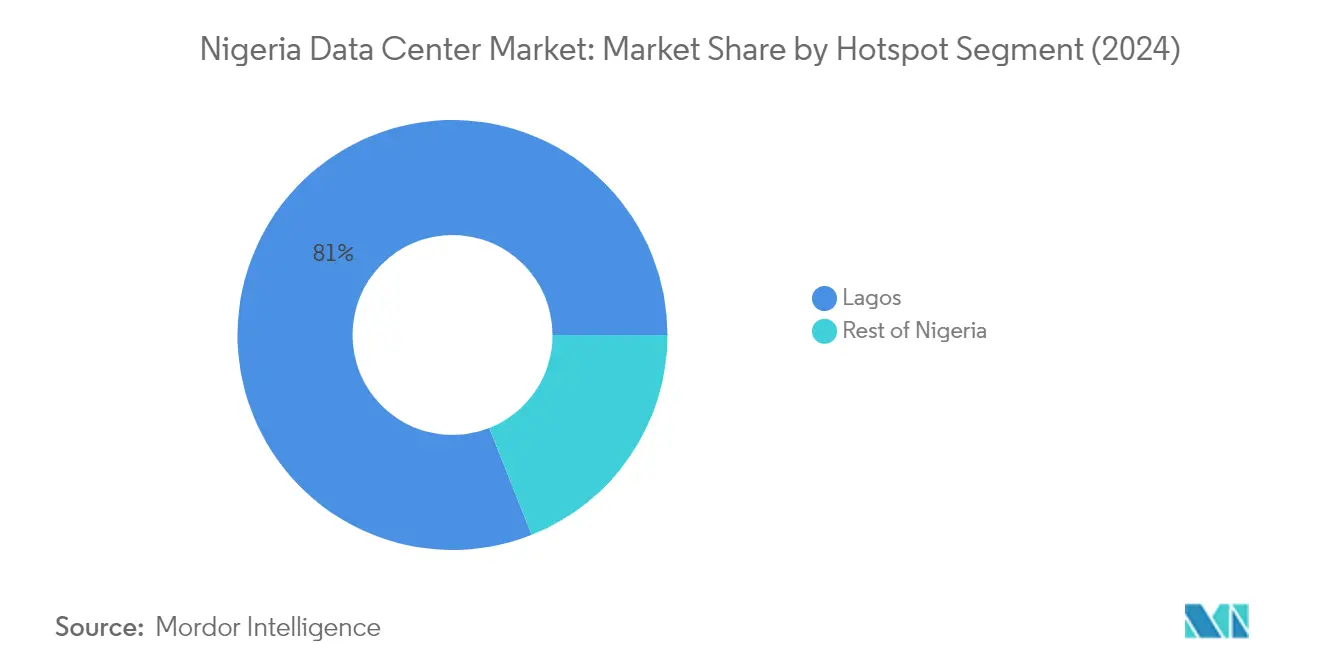
Segment Analysis: By Hotspot
Lagos Segment in Nigeria Data Center Market
Lagos dominates the Nigeria data center market, commanding approximately 81% market share in 2024, with an IT load capacity of 94.56 MW. The region serves as a strategic location catering to the majority of startups and businesses of different sizes, with about 88% of Nigerian tech startups located in Lagos. The city's prominence is further strengthened by being the landing point for nine submarine cables, providing robust internet connectivity through internet exchanges. Lagos incorporates trade-free zones like the Lekki Free Zone, offering significant business benefits for the data center industry. The region is expected to maintain its dominant position through 2029, driven by factors such as superior power supply infrastructure compared to other regions, proximity to business hubs, and the presence of major network operators.
Remaining Segments in Nigeria Data Center Market by Hotspot
The Rest of Nigeria segment, primarily represented by regions like Sagamu, plays a complementary role in the country's data center infrastructure. These regions provide strategic advantages such as fast internet connectivity, networking infrastructure, and proximity to disaster recovery sites outside Lagos. The presence of alternative locations helps in maintaining geographical diversity and risk mitigation for data center operations. While these regions may not match Lagos's scale, they offer important benefits such as potential cost advantages and the ability to serve specific regional markets, contributing to the overall robustness of Nigeria's data center ecosystem.
Segment Analysis: By Data Center Size
Massive Segment in Nigeria Data Center Market
The massive data center segment dominates the Nigeria data center market, accounting for approximately 46% market share in 2024 with an IT load capacity of 53.65 MW. The segment's prominence is driven by the rising adoption of smart devices for home automation, digitization applications, and government incentives on tax and land. Key players like Africa Data Centers (Cassava Technologies) and WIOCC's OADC have established significant massive data center facilities in Lagos, with capacities of 20.7 MW and 20 MW respectively. These Tier 3 certified facilities cater to the increasing demand from various end-users including cloud service providers, content delivery networks, and large enterprises requiring robust infrastructure for their operations.
Medium Segment in Nigeria Data Center Market
The medium data center segment is experiencing notable growth in Nigeria, projected to expand at approximately 3% CAGR from 2024 to 2029. This growth is primarily driven by small and medium-sized businesses adopting digitalization through cloud migration. The segment's expansion is supported by factors such as close proximity to end-users, enhanced data center storage requirements, and cost-effective solutions for businesses. Digital Realty, through Medallion Communications Ltd, is planning to introduce a 2 MW capacity facility by 2024, further strengthening the medium segment's position in the market. The segment particularly appeals to organizations seeking retail colocation data center options with high bandwidth speeds and reliable connectivity infrastructure.
Remaining Segments in Data Center Size
The mega and small data center segments complete the market landscape in Nigeria. The mega segment is positioned to play a crucial role in the market's future, with planned facilities designed to accommodate large-scale demands for faster and more capable implementations. These facilities are particularly suited for hyperscale and wholesale requirements from cloud providers and large enterprises. The small segment, while maintaining a modest presence, serves specific niches in the market, primarily catering to small retailers exploring cloud environments and deploying systems for distant operations. Both segments contribute to creating a diverse ecosystem that meets varying customer requirements across different scales of operation.
Segment Analysis: By Tier Type
Tier 3 Segment in Nigeria Data Center Market
The Tier 3 segment dominates the Nigeria data center market, commanding approximately 100% market share in 2024 with an IT load capacity of 116.72 MW. These facilities are predominantly located in Lagos, claiming nearly 96% of the total Tier 3 data center market in Nigeria. The segment's dominance is driven by service providers focusing on establishing facilities that offer reliable redundancy and meet stringent operational criteria for long-term market sustainability. Massive data centers currently lead the Tier 3 data center market with a significant market presence, followed by medium-sized and small-sized facilities. Major operators in the Tier 3 segment include Africa Data Centres (Cassava Technologies), WIOCC's OADC, and MDXi (an Equinix Inc. company), who have strategically positioned their facilities to serve the growing demand from various end-users. The segment is experiencing robust growth with service providers continuing to invest in new Tier 3 certified facilities to support the increasing adoption of cloud services, digital transformation initiatives, and the expanding internet infrastructure in Nigeria.
Growth Trajectory of Tier 3 Segment
The Tier 3 segment in Nigeria's data center market is projected to maintain strong growth momentum between 2024 and 2029, driven by increasing adoption of streaming services, online gaming platforms, and growing demand for low-latency data processing capabilities. The segment's expansion is supported by the rising internet penetration rate and the government's focus on enhancing local data hosting capabilities. Service providers are actively expanding their Tier 3 facilities to accommodate the surging demand from various sectors including financial services, telecommunications, and cloud service providers. The growth is further catalyzed by the increasing digitalization of businesses and the government's push towards data localization. These facilities are particularly attractive to enterprises due to their optimal balance of reliability, performance, and cost-effectiveness, making them the preferred choice for both local and international organizations operating in Nigeria.
Segment Analysis: By Absorption
Nigeria Data Center Industry Overview
Top Companies in Nigeria Data Center Market
The Nigerian data center market is characterized by significant investments in infrastructure expansion and technological advancement by key players. Companies are focusing on developing Tier 3 certified facilities to ensure reliable redundancy and meet long-term growth requirements. Strategic partnerships with global cloud providers and telecommunications companies are becoming increasingly common to enhance data center services offerings. Operators are emphasizing carrier-neutral facilities with direct connections to submarine cables and internet exchanges to provide superior connectivity options. The market shows a clear trend toward developing mega-sized facilities with higher power densities and advanced cooling systems to accommodate growing demand. Companies are also investing in green technologies and sustainable practices to reduce operational costs and environmental impact, while simultaneously expanding their presence in key industrial hubs like Lagos.
Market Dominated by Regional Infrastructure Leaders
The Nigerian data center market exhibits a moderate level of consolidation with a mix of regional specialists and global infrastructure providers. Local players have established strong positions through their deep understanding of the market and existing relationships with telecommunications providers and enterprises. The market has witnessed significant transformation through strategic acquisitions, such as Equinix's acquisition of MainOne, demonstrating growing international interest in the region. These consolidation activities are driven by the need to achieve economies of scale and expand service portfolios.
The competitive landscape is evolving with increased participation from international data center operators looking to establish a presence in this growing market. Companies are leveraging their expertise in developed markets to introduce advanced technologies and operational best practices. The market structure favors operators with strong financial backing and technical capabilities, as substantial investments are required for facility development and maintenance. Strategic partnerships between local and global players are becoming increasingly common to combine market knowledge with technical expertise.
Innovation and Connectivity Drive Market Success
Success in the Nigerian data center market increasingly depends on operators' ability to provide comprehensive data center solutions beyond basic colocation services. Companies need to focus on developing robust connectivity ecosystems, offering direct access to cloud providers, and maintaining high-quality infrastructure with reliable power supply solutions. Operators must also invest in skilled workforce development and maintain strong relationships with local authorities to navigate regulatory requirements effectively. The ability to offer flexible scaling options and customized solutions for different customer segments is becoming crucial for market success.
Market participants need to focus on developing strong value propositions through service differentiation and technical innovation. This includes offering advanced security features, implementing efficient cooling solutions, and providing comprehensive managed services. Companies must also maintain strong relationships with telecommunications providers and internet exchanges to ensure optimal connectivity. Future success will depend on the ability to anticipate and adapt to changing customer requirements, particularly in areas such as edge computing and hybrid cloud solutions. Operators need to balance expansion plans with market demand while maintaining operational efficiency and service quality, which is a critical aspect of data center management and data center operations.
Nigeria Data Center Market Leaders
-
Africa Data Centers (Cassava Technologies)
-
Digital Realty (Medallion Communications Ltd)
-
MDXi (MainOne by Equinix)
-
MTN Nigeria Communications Ltd
-
WIOCC (Open Access Data Centres)
- *Disclaimer: Major Players sorted in no particular order

Need More Details on Market Players and Competiters?
Download PDF
Nigeria Data Center Market News
- April 2022: Equinix Inc. acquired MainOne, the parent company of MDX-I, for about USD 320 million to begin its expansion into the African region. This would allow Equinix to practice its long-term strategy to offer carrier-neutral data center services in Nigeria.
Free With This Report
We provide a complimentary and exhaustive set of data points on the country and regional level metrics that present the fundamental structure of the industry. Presented in the form of 50+ free charts, the sections cover difficult to find data on various countries on smartphone users, data traffic per smartphone, mobile and broadband data speed, fiber connectivity network, and submarine cables.


Nigeria Data Center Market Report - Table of Contents
1. EXECUTIVE SUMMARY & KEY FINDINGS
2. REPORT OFFERS
3. INTRODUCTION
- 3.1 Study Assumptions & Market Definition
- 3.2 Scope of the Study
- 3.3 Research Methodology
4. MARKET OUTLOOK
- 4.1 It Load Capacity
- 4.2 Raised Floor Space
- 4.3 Colocation Revenue
- 4.4 Installed Racks
- 4.5 Rack Space Utilization
- 4.6 Submarine Cable
5. Key Industry Trends
- 5.1 Smartphone Users
- 5.2 Data Traffic Per Smartphone
- 5.3 Mobile Data Speed
- 5.4 Broadband Data Speed
- 5.5 Fiber Connectivity Network
-
5.6 Regulatory Framework
- 5.6.1 Nigeria
- 5.7 Value Chain & Distribution Channel Analysis
6. MARKET SEGMENTATION (INCLUDES MARKET SIZE IN VOLUME, FORECASTS UP TO 2030 AND ANALYSIS OF GROWTH PROSPECTS)
-
6.1 Hotspot
- 6.1.1 Lagos
- 6.1.2 Rest of Nigeria
-
6.2 Data Center Size
- 6.2.1 Massive
- 6.2.2 Medium
- 6.2.3 Mega
- 6.2.4 Small
-
6.3 Tier Type
- 6.3.1 Tier 3
-
6.4 Absorption
- 6.4.1 Non-Utilized
- 6.4.2 Utilized
- 6.4.2.1 By Colocation Type
- 6.4.2.1.1 Hyperscale
- 6.4.2.1.2 Retail
- 6.4.2.1.3 Wholesale
- 6.4.2.2 By End User
- 6.4.2.2.1 BFSI
- 6.4.2.2.2 Cloud
- 6.4.2.2.3 E-Commerce
- 6.4.2.2.4 Government
- 6.4.2.2.5 Manufacturing
- 6.4.2.2.6 Media & Entertainment
- 6.4.2.2.7 Telecom
- 6.4.2.2.8 Other End User
7. COMPETITIVE LANDSCAPE
- 7.1 Market Share Analysis
- 7.2 Company Landscape
-
7.3 Company Profiles (includes Global Level Overview, Market Level Overview, Core Business Segments, Financials, Headcount, Key Information, Market Rank, Market Share, Products and Services, and Analysis of Recent Developments).
- 7.3.1 Africa Data Centers (Cassava Technologies)
- 7.3.2 Digital Realty (Medallion Communications Ltd)
- 7.3.3 MDXi (MainOne by Equinix)
- 7.3.4 MTN Nigeria Communications Ltd
- 7.3.5 Rack Centre Limited
- 7.3.6 WIOCC (Open Access Data Centres)
- 7.4 LIST OF COMPANIES STUDIED
8. KEY STRATEGIC QUESTIONS FOR DATA CENTER CEOS
9. APPENDIX
-
9.1 Global Overview
- 9.1.1 Overview
- 9.1.2 Porter’s Five Forces Framework
- 9.1.3 Global Value Chain Analysis
- 9.1.4 Global Market Size and DROs
- 9.2 Sources & References
- 9.3 List of Tables & Figures
- 9.4 Primary Insights
- 9.5 Data Pack
- 9.6 Glossary of Terms
You Can Purchase Parts Of This Report. Check Out Prices For Specific Sections
Get Price Break-up Now
List of Tables & Figures
- Figure 1:
- VOLUME OF IT LOAD CAPACITY, MW, NIGERIA, 2018 - 2030
- Figure 2:
- VOLUME OF RAISED FLOOR AREA, SQ.FT. ('000), NIGERIA, 2018 - 2030
- Figure 3:
- VALUE OF COLOCATION REVENUE, USD MILLION, NIGERIA, 2018 - 2030
- Figure 4:
- VOLUME OF INSTALLED RACKS, NUMBER, NIGERIA, 2018 - 2030
- Figure 5:
- RACK SPACE UTILIZATION, %, NIGERIA, 2018 - 2030
- Figure 6:
- COUNT OF SMARTPHONE USERS, IN MILLION, NIGERIA, 2018 - 2030
- Figure 7:
- DATA TRAFFIC PER SMARTPHONE, GB, NIGERIA, 2018 - 2030
- Figure 8:
- AVERAGE MOBILE DATA SPEED, MBPS, NIGERIA, 2018 - 2030
- Figure 9:
- AVERAGE BROADBAND SPEED, MBPS, NIGERIA, 2018 - 2030
- Figure 10:
- LENGTH OF FIBER CONNECTIVITY NETWORK, KILOMETER, NIGERIA, 2018 - 2030
- Figure 11:
- VOLUME OF IT LOAD CAPACITY, MW, NIGERIA, 2018 - 2030
- Figure 12:
- VOLUME OF HOTSPOT, MW, NIGERIA, 2018 - 2030
- Figure 13:
- VOLUME SHARE OF HOTSPOT, %, NIGERIA, 2018 - 2030
- Figure 14:
- VOLUME SIZE OF LAGOS, MW, NIGERIA, 2018 - 2030
- Figure 15:
- VOLUME SHARE OF LAGOS, MW, HOTSPOT, %, NIGERIA, 2018 - 2030
- Figure 16:
- VOLUME SIZE OF REST OF NIGERIA, MW, NIGERIA, 2018 - 2030
- Figure 17:
- VOLUME SHARE OF REST OF NIGERIA, MW, HOTSPOT, %, NIGERIA, 2018 - 2030
- Figure 18:
- VOLUME OF DATA CENTER SIZE, MW, NIGERIA, 2018 - 2030
- Figure 19:
- VOLUME SHARE OF DATA CENTER SIZE, %, NIGERIA, 2018 - 2030
- Figure 20:
- VOLUME SIZE OF MASSIVE, MW, NIGERIA, 2018 - 2030
- Figure 21:
- VOLUME SIZE OF MEDIUM, MW, NIGERIA, 2018 - 2030
- Figure 22:
- VOLUME SIZE OF MEGA, MW, NIGERIA, 2018 - 2030
- Figure 23:
- VOLUME SIZE OF SMALL, MW, NIGERIA, 2018 - 2030
- Figure 24:
- VOLUME OF TIER TYPE, MW, NIGERIA, 2018 - 2030
- Figure 25:
- VOLUME SHARE OF TIER TYPE, %, NIGERIA, 2018 - 2030
- Figure 26:
- VOLUME SIZE OF TIER 3, MW, NIGERIA, 2018 - 2030
- Figure 27:
- VOLUME OF ABSORPTION, MW, NIGERIA, 2018 - 2030
- Figure 28:
- VOLUME SHARE OF ABSORPTION, %, NIGERIA, 2018 - 2030
- Figure 29:
- VOLUME SIZE OF NON-UTILIZED, MW, NIGERIA, 2018 - 2030
- Figure 30:
- VOLUME OF COLOCATION TYPE, MW, NIGERIA, 2018 - 2030
- Figure 31:
- VOLUME SHARE OF COLOCATION TYPE, %, NIGERIA, 2018 - 2030
- Figure 32:
- VOLUME SIZE OF HYPERSCALE, MW, NIGERIA, 2018 - 2030
- Figure 33:
- VOLUME SIZE OF RETAIL, MW, NIGERIA, 2018 - 2030
- Figure 34:
- VOLUME SIZE OF WHOLESALE, MW, NIGERIA, 2018 - 2030
- Figure 35:
- VOLUME OF END USER, MW, NIGERIA, 2018 - 2030
- Figure 36:
- VOLUME SHARE OF END USER, %, NIGERIA, 2018 - 2030
- Figure 37:
- VOLUME SIZE OF BFSI, MW, NIGERIA, 2018 - 2030
- Figure 38:
- VOLUME SIZE OF CLOUD, MW, NIGERIA, 2018 - 2030
- Figure 39:
- VOLUME SIZE OF E-COMMERCE, MW, NIGERIA, 2018 - 2030
- Figure 40:
- VOLUME SIZE OF GOVERNMENT, MW, NIGERIA, 2018 - 2030
- Figure 41:
- VOLUME SIZE OF MANUFACTURING, MW, NIGERIA, 2018 - 2030
- Figure 42:
- VOLUME SIZE OF MEDIA & ENTERTAINMENT, MW, NIGERIA, 2018 - 2030
- Figure 43:
- VOLUME SIZE OF TELECOM, MW, NIGERIA, 2018 - 2030
- Figure 44:
- VOLUME SIZE OF OTHER END USER, MW, NIGERIA, 2018 - 2030
- Figure 45:
- VOLUME SHARE OF MAJOR PLAYERS, %, NIGERIA
Nigeria Data Center Industry Segmentation
Lagos are covered as segments by Hotspot. Massive, Medium, Mega, Small are covered as segments by Data Center Size. Tier 3 are covered as segments by Tier Type. Non-Utilized, Utilized are covered as segments by Absorption.| Hotspot | Lagos | |||
| Rest of Nigeria | ||||
| Data Center Size | Massive | |||
| Medium | ||||
| Mega | ||||
| Small | ||||
| Tier Type | Tier 3 | |||
| Absorption | Non-Utilized | |||
| Utilized | By Colocation Type | Hyperscale | ||
| Retail | ||||
| Wholesale | ||||
| By End User | BFSI | |||
| Cloud | ||||
| E-Commerce | ||||
| Government | ||||
| Manufacturing | ||||
| Media & Entertainment | ||||
| Telecom | ||||
| Other End User | ||||
Need A Different Region or Segment?
Customize Now
Market Definition
- IT LOAD CAPACITY - The IT load capacity or installed capacity, refers to the amount of energy consumed by servers and network equipments placed in a rack installed. It is measured in megawatt (MW).
- ABSORPTION RATE - It denotes the extend to which the data center capacity has been leased out. For instance, a 100 MW DC has leased out 75 MW, then absorption rate would be 75%. It is also referred as utilization rate and leased-out capacity.
- RAISED FLOOR SPACE - It is an elevated space build over the floor. This gap between the original floor and the elevated floor is used to accommodate wiring, cooling, and other data center equipment. This arrangement assist in having proper wiring and cooling infrastructure. It is measured in square feet (ft^2).
- DATA CENTER SIZE - Data Center Size is segmented based on the raised floor space allocated to the data center facilities. Mega DC - # of Racks must be more than 9000 or RFS (raised floor space) must be more than 225001 Sq. ft; Massive DC - # of Racks must be in between 9000 and 3001 or RFS must be in between 225000 Sq. ft and 75001 Sq. ft; Large DC - # of Racks must be in between 3000 and 801 or RFS must be in between 75000 Sq. ft and 20001 Sq. ft; Medium DC # of Racks must be in between 800 and 201 or RFS must be in between 20000 Sq. ft and 5001 Sq. ft; Small DC - # of Racks must be less than 200 or RFS must be less than 5000 Sq. ft.
- TIER TYPE - According to Uptime Institute the data centers are classified into four tiers based on the proficiencies of redundant equipment of the data center infrastructure. In this segment the data center are segmented as Tier 1,Tier 2, Tier 3 and Tier 4.
- COLOCATION TYPE - The segment is segregated into 3 categories namely Retail, Wholesale and Hyperscale Colocation service. The categorization is done based on the amount of IT load leased out to potential customers. Retail colocation service has leased capacity less than 250 kW; Wholesale colocation services has leased capacity between 251 kW and 4 MW and Hyperscale colocation services has leased capacity more than 4 MW.
- END CONSUMERS - The Data Center Market operates on a B2B basis. BFSI, Government, Cloud Operators, Media and Entertainment, E-Commerce, Telecom and Manufacturing are the major end-consumers in the market studied. The scope only includes colocation service operators catering to the increasing digitalization of the end-user industries.
| Keyword | Definition |
|---|---|
| Rack Unit | Generally referred as U or RU, it is the unit of measurement for the server unit housed in the racks in the data center. 1U is equal to 1.75 inches. |
| Rack Density | It defines the amount of power consumed by the equipment and server housed in a rack. It is measured in kilowatt (kW). This factor plays a critical role in data center design and, cooling and power planning. |
| IT Load Capacity | The IT load capacity or installed capacity, refers to the amount of energy consumed by servers and network equipment placed in a rack installed. It is measured in megawatt (MW). |
| Absorption Rate | It denotes how much of the data center capacity has been leased out. For instance, if a 100 MW DC has leased out 75 MW, then the absorption rate would be 75%. It is also referred to as utilization rate and leased-out capacity. |
| Raised Floor Space | It is an elevated space built over the floor. This gap between the original floor and the elevated floor is used to accommodate wiring, cooling, and other data center equipment. This arrangement assists in having proper wiring and cooling infrastructure. It is measured in square feet/meter. |
| Computer Room Air Conditioner (CRAC) | It is a device used to monitor and maintain the temperature, air circulation, and humidity inside the server room in the data center. |
| Aisle | It is the open space between the rows of racks. This open space is critical for maintaining the optimal temperature (20-25 °C) in the server room. There are primarily two aisles inside the server room, a hot aisle and a cold aisle. |
| Cold Aisle | It is the aisle wherein the front of the rack faces the aisle. Here, chilled air is directed into the aisle so that it can enter the front of the racks and maintain the temperature. |
| Hot Aisle | It is the aisle where the back of the racks faces the aisle. Here, the heat dissipated from the equipment’s in the rack is directed to the outlet vent of the CRAC. |
| Critical Load | It includes the servers and other computer equipment whose uptime is critical for data center operation. |
| Power Usage Effectiveness (PUE) | It is a metric which defines the efficiency of a data center. It is calculated by: (𝑇𝑜𝑡𝑎𝑙 𝐷𝑎𝑡𝑎 𝐶𝑒𝑛𝑡𝑒𝑟 𝐸𝑛𝑒𝑟𝑔𝑦 𝐶𝑜𝑛𝑠𝑢𝑚𝑝𝑡𝑖𝑜𝑛)/(𝑇𝑜𝑡𝑎𝑙 𝐼𝑇 𝐸𝑞𝑢𝑖𝑝𝑚𝑒𝑛𝑡 𝐸𝑛𝑒𝑟𝑔𝑦 𝐶𝑜𝑛𝑠𝑢𝑚𝑝𝑡𝑖𝑜𝑛). Further, a data center with a PUE of 1.2-1.5 is considered highly efficient, whereas, a data center with a PUE >2 is considered highly inefficient. |
| Redundancy | It is defined as a system design wherein additional component (UPS, generators, CRAC) is added so that in case of power outage, equipment failure, the IT equipment should not be affected. |
| Uninterruptible Power Supply (UPS) | It is a device that is connected in series with the utility power supply, storing energy in batteries such that the supply from UPS is continuous to IT equipment even during utility power is snapped. The UPS primarily supports the IT equipment only. |
| Generators | Just like UPS, generators are placed in the data center to ensure an uninterrupted power supply, avoiding downtime. Data center facilities have diesel generators and commonly, 48-hour diesel is stored in the facility to prevent disruption. |
| N | It denotes the tools and equipment required for a data center to function at full load. Only "N" indicates that there is no backup to the equipment in the event of any failure. |
| N+1 | Referred to as 'Need plus one', it denotes the additional equipment setup available to avoid downtime in case of failure. A data center is considered N+1 when there is one additional unit for every 4 components. For instance, if a data center has 4 UPS systems, then for to achieve N+1, an additional UPS system would be required. |
| 2N | It refers to fully redundant design wherein two independent power distribution system is deployed. Therefore, in the event of a complete failure of one distribution system, the other system will still supply power to the data center. |
| In-Row Cooling | It is the cooling design system installed between racks in a row where it draws warm air from the hot aisle and supplies cool air to the cold aisle, thereby maintaining the temperature. |
| Tier 1 | Tier classification determines the preparedness of a data center facility to sustain data center operation. A data center is classified as Tier 1 data center when it has a non-redundant (N) power component (UPS, generators), cooling components, and power distribution system (from utility power grids). The Tier 1 data center has an uptime of 99.67% and an annual downtime of <28.8 hours. |
| Tier 2 | A data center is classified as Tier 2 data center when it has a redundant power and cooling components (N+1) and a single non-redundant distribution system. Redundant components include extra generators, UPS, chillers, heat rejection equipment, and fuel tanks. The Tier 2 data center has an uptime of 99.74% and an annual downtime of <22 hours. |
| Tier 3 | A data center having redundant power and cooling components and multiple power distribution systems is referred to as a Tier 3 data center. The facility is resistant to planned (facility maintenance) and unplanned (power outage, cooling failure) disruption. The Tier 3 data center has an uptime of 99.98% and an annual downtime of <1.6 hours. |
| Tier 4 | It is the most tolerant type of data center. A Tier 4 data center has multiple, independent redundant power and cooling components and multiple power distribution paths. All IT equipment are dual powered, making them fault tolerant in case of any disruption, thereby ensuring interrupted operation. The Tier 4 data center has an uptime of 99.74% and an annual downtime of <26.3 minutes. |
| Small Data Center | Data center that has floor space area of ≤ 5,000 Sq. ft or the number of racks that can be installed is ≤ 200 is classified as a small data center. |
| Medium Data Center | Data center which has floor space area between 5,001-20,000 Sq. ft, or the number of racks that can be installed is between 201-800, is classified as a medium data center. |
| Large Data Center | Data center which has floor space area between 20,001-75,000 Sq. ft, or the number of racks that can be installed is between 801-3,000, is classified as a large data center. |
| Massive Data Center | Data center which has floor space area between 75,001-225,000 Sq. ft, or the number of racks that can be installed is between 3001-9,000, is classified as a massive data center. |
| Mega Data Center | Data center that has a floor space area of ≥ 225,001 Sq. ft or the number of racks that can be installed is ≥ 9001 is classified as a mega data center. |
| Retail Colocation | It refers to those customers who have a capacity requirement of 250 kW or less. These services are majorly opted by small and medium enterprises (SMEs). |
| Wholesale Colocation | It refers to those customers who have a capacity requirement between 250 kW to 4 MW. These services are majorly opted by medium to large enterprises. |
| Hyperscale Colocation | It refers to those customers who have a capacity requirement greater than 4 MW. The hyperscale demand primarily originates from large-scale cloud players, IT companies, BFSI, and OTT players (like Netflix, Hulu, and HBO+). |
| Mobile Data Speed | It is the mobile internet speed a user experiences via their smartphones. This speed is primarily dependent on the carrier technology being used in the smartphone. The carrier technologies available in the market are 2G, 3G, 4G, and 5G, where 2G provides the slowest speed while 5G is the fastest. |
| Fiber Connectivity Network | It is a network of optical fiber cables deployed across the country, connecting rural and urban regions with high-speed internet connection. It is measured in kilometer (km). |
| Data Traffic per Smartphone | It is a measure of average data consumption by a smartphone user in a month. It is measured in gigabyte (GB). |
| Broadband Data Speed | It is the internet speed that is supplied over the fixed cable connection. Commonly, copper cable and optic fiber cable are used in both residential and commercial use. Here, optic cable fiber provides faster internet speed than copper cable. |
| Submarine Cable | A submarine cable is a fiber optic cable laid down at two or more landing points. Through this cable, communication and internet connectivity between countries across the globe is established. These cables can transmit 100-200 terabits per second (Tbps) from one point to another. |
| Carbon Footprint | It is the measure of carbon dioxide generated during the regular operation of a data center. Since, coal, and oil & gas are the primary source of power generation, consumption of this power contributes to carbon emissions. Data center operators are incorporating renewable energy sources to curb the carbon footprint emerging in their facilities. |
Need More Details on Market Definition?
Ask a Question
Research Methodology
Mordor Intelligence follows a four-step methodology in all our reports.
- Step-1: Identify Key Variables: In order to build a robust forecasting methodology, the variables and factors identified in Step-1 are tested against available historical market numbers. Through an iterative process, the variables required for market forecast are set and the model is built on the basis of these variables.
- Step-2: Build a Market Model: Market-size estimations for the forecast years are in nominal terms. Inflation is not a part of the pricing, and the average selling price (ASP) is kept constant throughout the forecast period for each country.
- Step-3: Validate and Finalize: In this important step, all market numbers, variables and analyst calls are validated through an extensive network of primary research experts from the market studied. The respondents are selected across levels and functions to generate a holistic picture of the market studied.
- Step-4: Research Outputs: Syndicated Reports, Custom Consulting Assignments, Databases & Subscription Platforms

Get More Details On Research Methodology
Download PDF


