
Global NGS Sample Preparation Market Size and Share
Market Overview
| Study Period | 2020 - 2031 |
|---|---|
| Market Size (2026) | USD 3.08 Billion |
| Market Size (2031) | USD 5.95 Billion |
| Growth Rate (2026 - 2031) | 14.08 % |
| Fastest Growing Market | Asia-Pacific |
| Largest Market | North America |
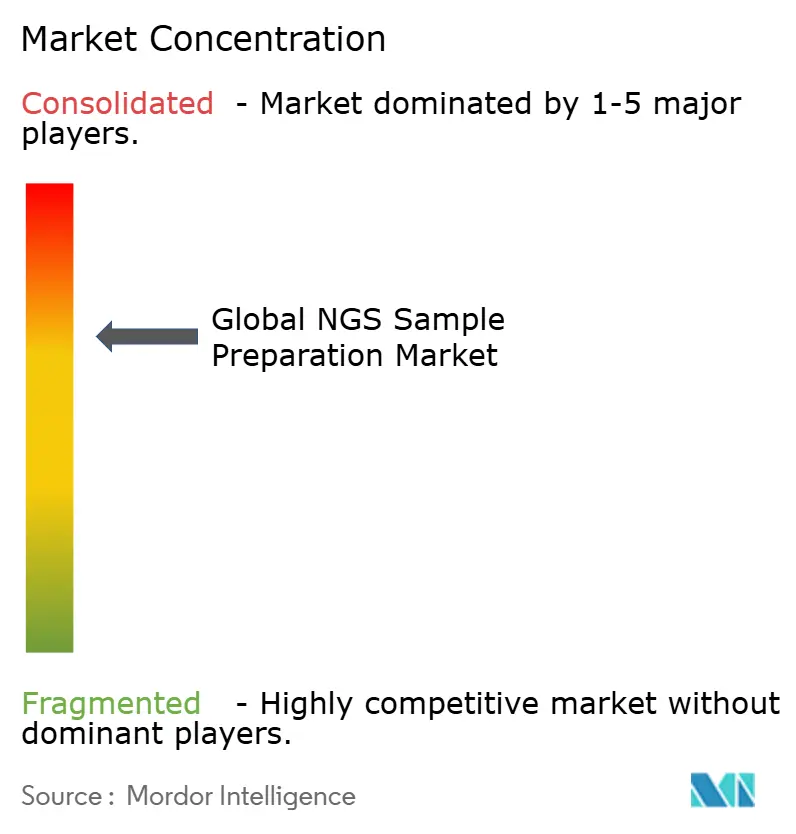
| Market Concentration | Medium |
Major Players *Disclaimer: Major Players sorted in no particular order Image © Mordor Intelligence. Reuse requires attribution under CC BY 4.0. | |
Global NGS Sample Preparation Market Analysis by Mordor Intelligence
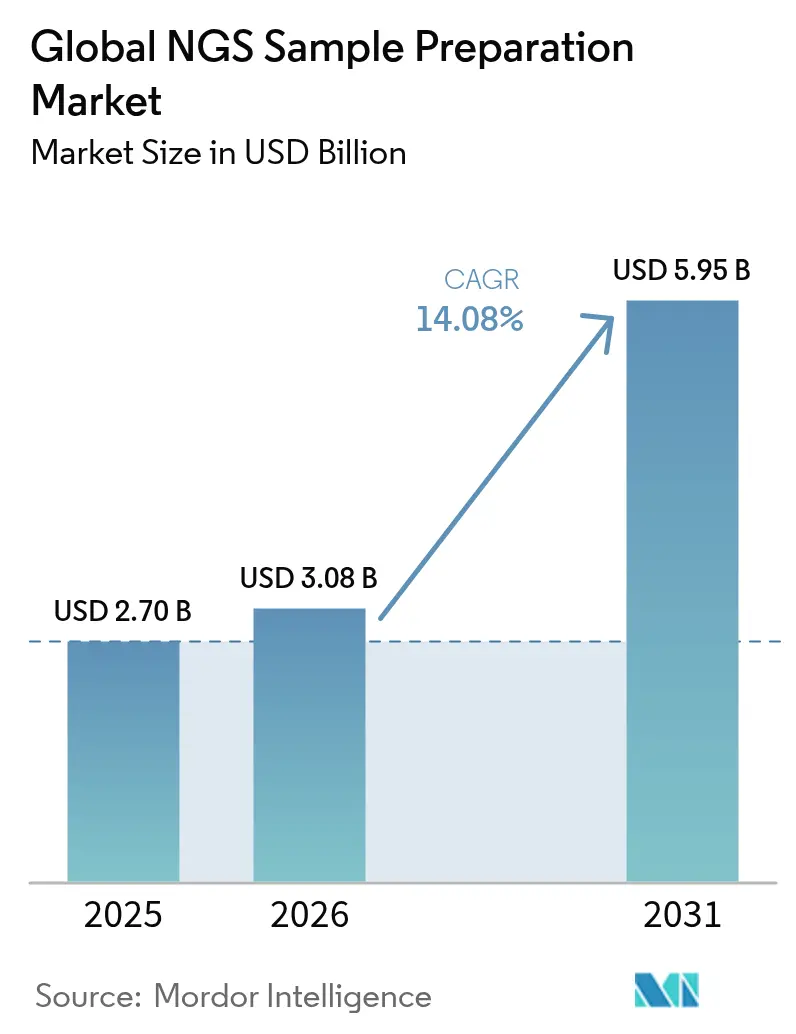
The next-generation sequencing sample preparation market size is expected to grow from USD 2.7 billion in 2025 to USD 3.08 billion in 2026 and is forecast to reach USD 5.95 billion by 2031 at 14.08% CAGR over 2026-2031. Growth is propelled by falling sequencing-per-base costs, automation that trims hands-on time, and expanding clinical use cases such as oncology and non-invasive prenatal testing. Reagents and consumables continue to supply recurring revenue streams, while automation workstations capture budget reallocation toward labor-saving infrastructure. Regulatory clarity in North America and government-funded genomic programs across Asia Pacific sustain demand, even as supply-chain resilience and cold-chain-free chemistry reshape procurement strategies. Competitive intensity remains moderate: incumbents leverage vertical integration, and well-funded entrants differentiate on cost and platform flexibility.
Key Report Takeaways
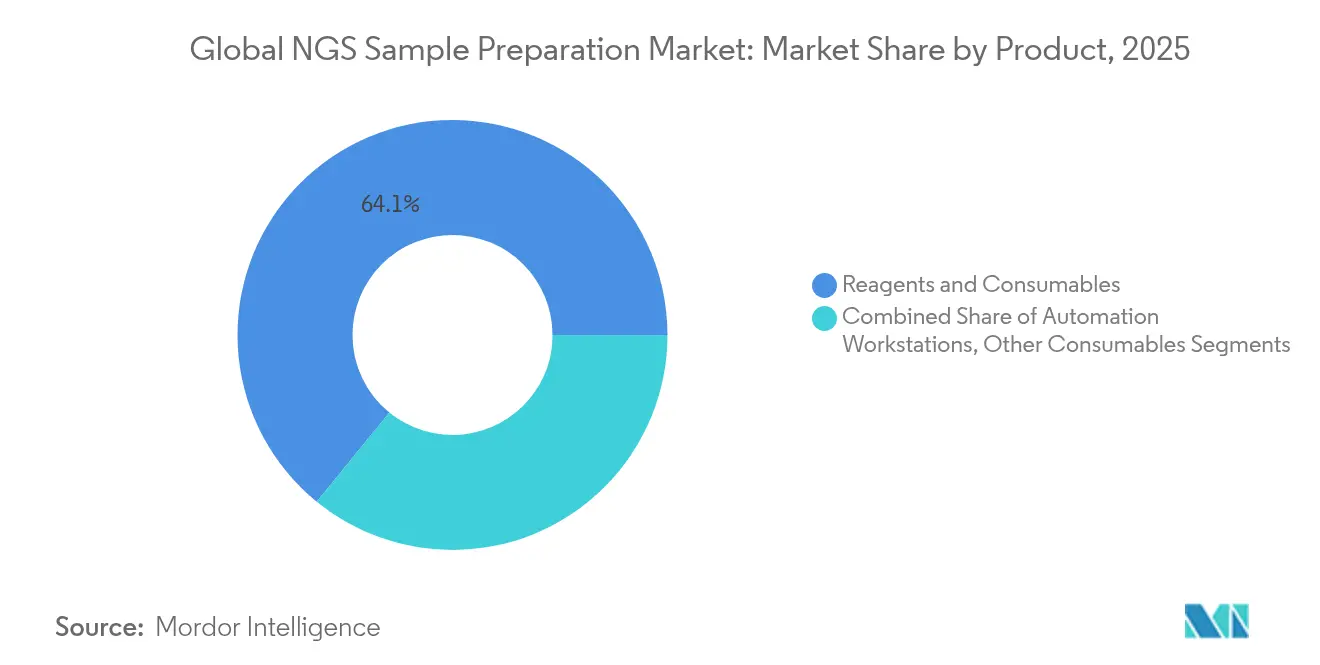
- By product class, reagents and consumables held 64.12% of the next-generation sequencing sample preparation market share in 2025, whereas automation workstations are projected to grow at an 18.28% CAGR through 2031.
- By application, diagnostics, including oncology, commanded a 53.62% revenue share in 2025; reproductive health (NIPT) is expected to expand at a 17.62% CAGR to 2031.
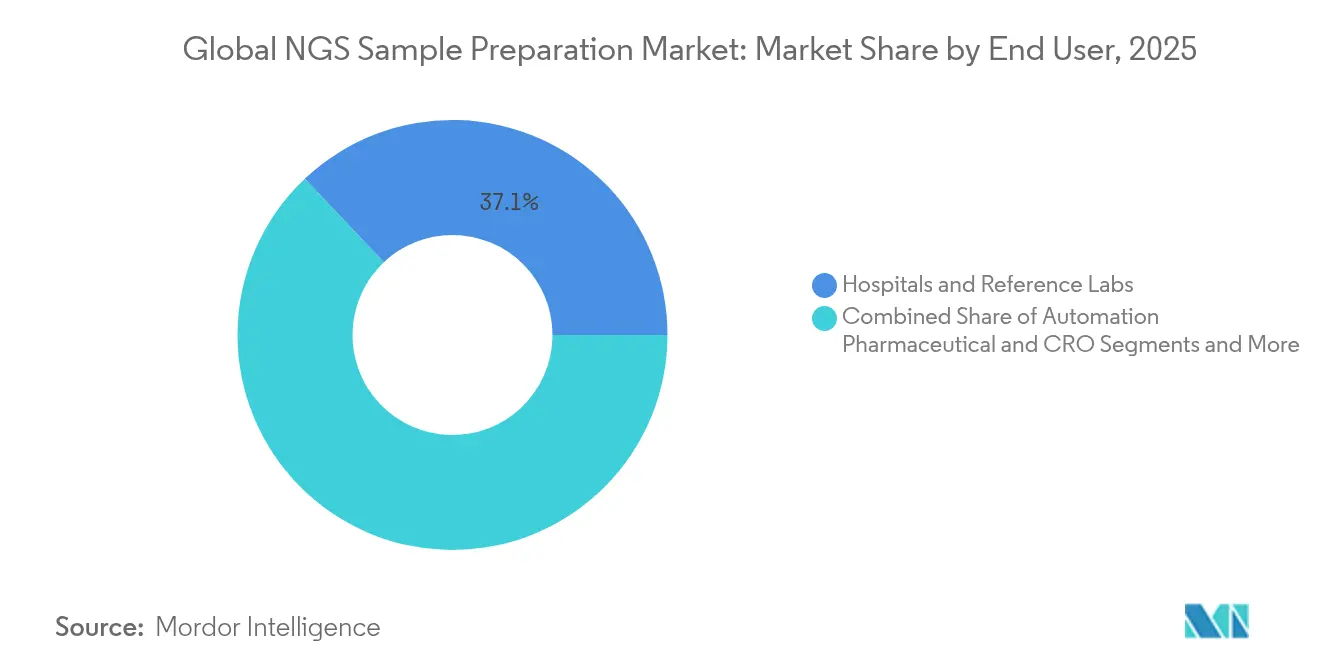
- By end-user, hospitals and reference laboratories accounted for 37.05% of the next-generation sequencing sample preparation market size in 2025, while contract research organizations recorded the fastest CAGR at 15.74% through 2031.
- By region, North America led with 39.10% revenue share in 2025; Asia Pacific is forecast to rise at a 14.22% CAGR over 2026-2031.
Note: Market size and forecast figures in this report are generated using Mordor Intelligence’s proprietary estimation framework, updated with the latest available data and insights as of 2026.
Market Trends and Insights
Drivers Impact Analysis of Global NGS Sample Preparation Market*
| Driver | ( ~ ) % Impact on CAGR Forecast | Geographic Relevance | Impact Timeline |
|---|---|---|---|
| Rising prevalence of infectious and emerging pathogens | +2.10% | Sub-Saharan Africa, Asia Pacific | Medium term (2-4 years) |
| Falling sequencing-per-base costs and open-platform chemistry | +2.80% | North America, Europe | Short term (≤ 2 years) |
| Automation reducing hands-on time in high-throughput laboratories | +2.40% | North America, European Union, spill-over to core Asia Pacific markets | Medium term (2-4 years) |
| Clinical adoption of rapid on-board sample-to-answer systems | +1.90% | Developed healthcare systems globally | Short term (≤ 2 years) |
| Venture funding for sample-prep-as-a-service startups | +1.20% | North America, Europe, emerging Asia Pacific | Long term (≥ 4 years) |
| Expansion of precision oncology and companion diagnostics applications | +3.10% | North America, Europe | Medium term (2-4 years) |
| Source: Mordor Intelligence | |||
Rising Prevalence of Infectious and Emerging Pathogens
Over half of Sub-Saharan African nations now run in-country NGS surveillance platforms, accelerating pathogen tracking capacity built during the COVID-19 response.[1] Regional consortia, such as the Asia Pathogen Genomics Initiative, aggregate resources to mitigate persistent supply bottlenecks. Validated metagenomic assays reach 93.6% sensitivity for respiratory viruses in under 24 hours.[2] Coupling nanopore sequencing with antimicrobial-resistance calling delivers >90% concordance with phenotypic data, reinforcing sample-prep upgrades designed for diverse specimen matrices. Laboratories, therefore, prioritize kits compatible with low-input, pathogen-rich samples and shortened turnaround.
Falling Sequencing-Per-Base Costs and Open-Platform Chemistry
Component prices for flow cells, enzymes, and terminators continue to decline as multi-vendor supply chains mature, allowing new entrants to commercialize benchtop sequencers for below USD 100,000. Illumina’s on-flow-cell library chemistry, scheduled for commercial release in 2025, removes separate library prep steps and lowers overall per-run costs. Platform-agnostic kits such as CapTrap-seq give laboratories flexibility to switch instruments without revalidating upstream preparation. These developments shift capital budget decisions from hardware replacement cycles to chemistry and workflow optimization, reinforcing price competition across reagents.
Automation Reducing Hands-On Time in High-Throughput Laboratories
Acoustic liquid handlers compress an eight-hour manual workflow into roughly 30 minutes, freeing scarce technologist hours. High-throughput systems like MGISP-960 automate 96 plates in an unmanned run, aligning with hospitals that now process thousands of oncology and hereditary disease samples monthly. Artificial-intelligence scheduling modules further cut procurement delays and reduce consumable stockouts. Once automated, cytogenetics labs report lower inter-operator variability, underlining the reproducibility premium that justifies capital spending.
Clinical Adoption of Rapid On-Board Sample-to-Answer Systems
Liquid-biopsy programs in Canada achieve a median three-day turnaround—from draw to report—versus traditional tissue workflows that can exceed two weeks. FDA breakthrough approvals for metagenomic NGS assays in 2023 opened a fast track for infectious disease panels, incentivizing hospital labs to embed sequencing directly in emergency care settings.[3] Nanopore Q20+ chemistry now records ≥99% raw read accuracy, supporting rapid outbreak tracing while retaining long-read benefits. On-board prep modules integrated with sequencers strip away legacy library steps and meet oncology dosing windows.
Restraints Impact Analysis of Global NGS Sample Preparation Market*
| Restraint | ( ~ ) % Impact on CAGR Forecast | Geographic Relevance | Impact Timeline |
|---|---|---|---|
| Capital-intensive automation and consumable costs for mid-size laboratories | -1.80% | Global, more acute in emerging markets | Medium term (2-4 years) |
| High variability in upstream sample quality impacting library yield | -1.20% | Resource-limited settings worldwide | Short term (≤ 2 years) |
| Fragmented regulatory guidance for laboratory developed tests across regions | -2.10% | Asia Pacific, Latin America | Long term (≥ 4 years) |
| Cold-chain constraints for reagent logistics in emerging markets | -1.40% | Sub-Saharan Africa, Southeast Asia, Latin America | Medium term (2-4 years) |
| Source: Mordor Intelligence | |||
Capital-Intensive Automation and Consumable Costs for Mid-Size Laboratories
Units such as the MGISP-960 demand six-figure investments and steady throughput; labs processing under 1,000 samples each month struggle to realize per-sample savings. Consumables can comprise up to 70% of total preparation cost, pressuring mid-volume facilities to outsource sequencing. Ambient-temperature stabilization chemistries from Biomatrica now maintain DNA integrity without a cold chain, offering a partial remedy and trimming logistics spend. Sample-prep-as-a-service providers bridge capability gaps, yet slow direct capital equipment growth.
Fragmented Regulatory Guidance for Laboratory Developed Tests Across Regions
The FDA’s May 2024 final rule phases out enforcement discretion over four years, mandating premarket review for high-risk LDTs. European IVDR pathways diverge in documentation requirements, whereas several Asia Pacific countries apply local registration schemes, forcing multinational labs to manage parallel validations. Smaller companies face added administrative costs, amplifying the advantage of incumbents with dedicated compliance teams.
*Our forecasts treat driver/restraint impacts as directional, not additive. The impact forecasts reflect baseline growth, mix effects, and variable interactions.
Global NGS Sample Preparation Market Segment Analysis
By Product Class:
Automation Drives Premium Segment GrowthReagents and consumables held 64.12% of the next-generation sequencing sample preparation market share in 2025, underscoring their recurring revenue profile. Automation workstations, though lower in absolute revenue, are expected to grow 18.28% annually as staffing shortages raise the cost of manual workflows. The NEBNext Ultra II enzymatic fragmentation kit cuts hands-on time to 15 minutes while maintaining high library complexity, exemplifying how chemistry advances complement automation. Within this segment, value-added devices that monitor reagent use and prevent pipetting errors secure premium pricing and pay-back periods of under 18 months for labs exceeding 500 monthly samples.
Laboratories increasingly bundle automation hardware with software dashboards that predict reagent depletion, aligning purchasing with just-in-time delivery. DISPENDIX’s I.DOT handler automates 80% of library prep steps and provides visual QC checkpoints, lowering re-run rates. As throughput rises, these integrated platforms optimize reagent consumption and strengthen vendor lock-in strategies.

By Application:
Precision Medicine Accelerates Clinical AdoptionDiagnostics, led by oncology, generated 53.62% of 2025 revenue as genomic profiling became the standard of care across major cancer subtypes. NIPT is forecast to log a 17.62% CAGR through 2031, fueled by broader payer coverage and expanding paternal haplotype assays. Precision-oncology panels now detect minimal residual disease in early-stage tumors, guiding adjuvant therapy choices and heightening sensitivity requirements for sample prep. Labcorp’s alliance with Ultima Genomics on whole-genome-based residual-disease testing illustrates how clinical labs refine workflows for ultralow variant allele frequencies.
Drug discovery groups adopt single-cell sequencing to decipher tumor microenvironments, while agricultural researchers deploy targeted genotyping-by-sequencing to improve crop traits, diversifying revenue beyond human health. These varied use cases sustain the next-generation sequencing sample preparation market as kit manufacturers tailor chemistries for circulating DNA, FFPE tissue, or plant material, ensuring workflow adaptability.
By End-User:
CROs Capitalize on Outsourcing TrendsHospitals and reference laboratories secured 37.05% of 2025 revenue; however, contract research organizations are expanding at 15.74% CAGR as pharmaceutical developers offload genomics projects to specialized partners. Charles River now bundles microbial ID, RNA-Seq, and CRISPR editing services in turnkey packages that obviate internal infrastructure spend. Academic institutes remain steady buyers, yet mid-size biotechs increasingly partner with CROs for regulatory-grade sequence data, reinforcing third-party growth.
Automation makers respond by offering cloud-connected platforms that enable remote protocol updates and performance monitoring, features valued by distributed CRO networks handling multicenter clinical trials. These dynamics sustain demand for both equipment and consumables, cementing CROs as a pivotal downstream customer group.
By Workflow Phase:
Integration Drives Efficiency GainsExtraction quality determines downstream success, yet library construction remains the most error-prone phase. This has spurred the adoption of bead-linked transposon kits such as Illumina DNA Prep, which deliver even genome coverage from 1-500 ng input in 3.5 hours. Hybrid capture target-enrichment pushes sensitivity 10-100-fold, an essential benefit for liquid biopsy assays. Real-time QC modules now flag sub-optimal fragments mid-run, allowing on-the-fly protocol adjustments.
Workflow convergence is accelerating Illumina’s on-flow-cell chemistry, scheduled for 2025, which unites library prep and sequencing on a single consumable, promising lower contamination risk and shorter cycle times. Integrated suites that span extraction through data visualization are, therefore, reshaping procurement toward single-vendor ecosystems, further consolidating spend within the next-generation sequencing sample preparation market.
Geography Analysis
North America NGS Sample Preparation Market
North America held 39.10% of 2025 revenue, anchored by robust healthcare reimbursement structures and clear regulatory pathways that reduce adoption risk. Illumina, Thermo Fisher Scientific, and Element Biosciences maintain regional manufacturing and support footprints, easing customer validation cycles. Canada’s community-hospital liquid-biopsy programs illustrate clinical uptake, while Mexico leverages proximity to U.S. suppliers to scale reference-lab capacity.
Europe NGS Sample Preparation Market
Europe benefits from coordinated research funding and infrastructural maturity across Germany, the United Kingdom, France, Italy, and Spain. Harmonized IVDR rules enable cross-border kit deployment, although additional documentation imposes cost overheads that smaller labs offset via consortium purchasing models. Emerging Eastern European markets gain technology transfer through joint projects with established genomic centers, broadening regional contribution to the next-generation sequencing sample preparation market size.
APAC NGS Sample Preparation Market
Asia Pacific is the fastest-growing region at a 14.22% CAGR as governments embed genomics in public-health agendas. India’s IndiGen initiative, which sequenced 1,000 genomes, jump-started local bio-banking capacity. China’s MGI Tech scales automated workstations domestically and exports to Southeast Asia, while Japan pioneers rapid sequencing in tertiary hospitals. Nonetheless, cold-chain logistics and varied regulatory standards remain hurdles that vendors address via ambient-temperature stabilizers and local compliance support offices.

Regulatory Landscape
In the United States, NGS sample preparation used in clinical workflows is shaped by FDA device frameworks and method-validation guidance that extend into specimen handling, nucleic-acid purification, and documentation of DNA quality and quantity metrics. A key inflection point for labs using NGS in diagnostics is the FDA May 2024 final rule on laboratory developed tests (LDTs), which phases out enforcement discretion over four years and increases the need for standardized, auditable sample-prep processes supporting premarket review for higher-risk assays.
In Europe, Regulation (EU) 2017/746 (IVDR) requires performance evaluation and clinical evidence aligned to device classification (Classes A-D), with conformity assessment routes influencing how kit makers package validation data for extraction, library construction, and enrichment steps. Across regions, adoption is reinforced by standards activity for massively parallel sequencing workflows, including ISO 20397-1:2022 for nucleic-acid and library-preparation quality assessment and the in-development ISO/CD 25379-1 scope covering pre-examination through reporting for diagnostic purposes. These anchors increasingly guide how vendors and laboratories align QC, traceability, and workflow claims for regulated use cases.
Value Chain Analysis
The NGS sample preparation value chain starts with upstream production of critical biochemicals (enzymes produced via fermentation and purification) and oligonucleotide components (adapter and primer synthesis), followed by midstream kit formulation, fill-finish, and packaging into workflow-phase products spanning extraction, library construction, target enrichment, and QC. Downstream, vendors route products through regional distribution and service networks to hospitals and reference labs, academic centers, pharma/biotech, and CROs, where installation support, method transfer, and ongoing consumables supply drive recurring revenue.
Bottlenecks concentrate around manual library preparation, which is labor intensive and sensitive to pipetting and timing variability. That dynamic supports demand for robotic liquid handling and integrated workcells that standardize steps and reduce contamination risk. Supply resilience is shaped by concentration of enzyme production in North America and Europe and by cold-chain constraints for many reagents, which leads to inventory buffering and alternative chemistries designed for ambient handling. On the quality and compliance side, laboratories increasingly align purchasing and vendor qualification with clinical workflow assessment schemes, including ISO/CD 25379-1 and European Accreditation guidance EA-4/24 G:2025 for evaluating clinical NGS laboratories. This tightens expectations around validation packages when sample preparation is outsourced or embedded in automated platforms.
Competitive Landscape
Market concentration is moderate: the top five vendors, such as Illumina, Thermo Fisher Scientific, Qiagen, Agilent, and MGI Tech, collectively control significant market share, reflecting both platform ownership and reagent attach rates. Illumina’s USD 350 million purchase of SomaLogic brings proteomics into its ecosystem, reinforcing multiomics cross-sell potential. Hitachi High-Tech’s majority stake in Nabsys expands electronic mapping capabilities, signaling a broader interest in structural-variant workflows.
Element Biosciences demonstrates how focused R&D and USD 277 million in fresh capital can quickly move from 40 to 190 sequencer installs in a year, challenging price-performance benchmarks. Vendors increasingly compete on total cost of ownership, workflow breadth, and integrated analytics rather than on read length or accuracy alone.
Strategic alliances with diagnostic labs, CROs, and agricultural genomic partners broaden application footprints and lock in consumable revenue.
Global NGS Sample Preparation Industry Leaders
-
Illumina, Inc.
-
Agilent Technologies, Inc.
-
Thermo Fisher Scientific Inc.
-
PerkinElmer Inc.
-
F. Hoffmann-La Roche Ltd
- *Disclaimer: Major Players sorted in no particular order
Global NGS Sample Preparation Market Companies Covered in this Report
- Illumina
- Thermo Fisher Scientific
- QIAGEN
- Agilent Technologies
- Roche
- PerkinElmer
- Danaher Corp (Beckman Coulter)
- BGI
- Eurofins
- Bio-Rad Laboratories
- Oxford Nanopore Technologies
- Pacific Biosciences
- Macrogen
- Integrated DNA Technologies
- Genomatix
- Tecan Group
- Hamilton Company
- New England Biolabs
- Swift Biosciences
- Helix OpCo
Market Opportunities and Future Outlook
A clear whitespace is the expansion of integrated, automation-forward library preparation into lower-throughput and decentralized settings that historically relied on manual bench workflows. 2026 product activity illustrates this direction: Illumina introduced fireflyGO as a benchtop automation platform tied to targeted oncology research workflows, and n6 launched icon16 in a 16-well format targeting smaller-batch amplification and normalization needs. These offerings broaden the addressable base beyond high-throughput core labs by packaging fewer manual touchpoints and more repeatable outcomes into compact footprints.
Another opportunity sits in cold-chain reduction and workflow robustness for geographically distributed testing, where ambient-stable or lyophilized chemistries remove logistics friction and improve procurement flexibility in emerging markets and multi-site networks. Meridian Life Science expanded an ambient-stable NGS portfolio with a lyophilized enzymatic DNA fragmentation kit (February 2026) and later collaborated with 4bases SA to integrate stabilized library-prep chemistries into Oxford Nanopore Technologies workflows (June 2026), signaling commercial momentum around stabilization as a differentiator. Standards development for clinical NGS workflows, including ISO/CD 25379-1 and CEN/TS 17981-1, further supports opportunity for kit and automation suppliers that can ship complete validation and QC packages aligned to regulated diagnostic environments.
Recent Industry Developments in Global NGS Sample Preparation Market
- July 2026: n6 launched icon16, a 16-well NGS amplification system incorporating AutoNorm adaptive amplification technology for lower-throughput workflows. The release targets labs that need consistent normalization and amplification without investing in high-throughput automation platforms. It widens the competitive field for sample-prep automation beyond centralized core facilities.
- June 2026: Meridian Bioscience and 4bases SA announced a collaboration to integrate stabilized NGS library preparation chemistries into Oxford Nanopore Technologies workflows, supporting ambient-stable deployment. The partnership addresses cold-chain constraints that add cost and risk to reagent logistics, particularly for distributed testing networks. It also strengthens the positioning of stabilized chemistry as a procurement and operational lever in sample preparation.
- July 2024: Labcorp broadened its partnership with Ultima Genomics to apply whole-genome sequencing for minimal residual disease detection. The move elevates sensitivity and reproducibility requirements upstream in library preparation as clinical workflows push toward ultralow variant allele frequencies. It reinforces demand for optimized sample-prep kits and automation that reduce reruns and turnaround time in oncology testing.
Global NGS Sample Preparation Market Report Scope and Research Methodology
Market Definition and Coverage
For this study, the NGS sample preparation market is the revenue generated from products used to convert biological samples into sequencing-ready libraries, including key preparation steps before running an NGS instrument, across research and clinical workflows.
Scope exclusions: This scope does not count the sequencing instruments themselves, sequencing services, or downstream bioinformatics and data analysis tools.
Segments Covered in This Report
- By Product Class
- Reagents & Consumables
- Automation Workstations
- Other Consumables
- By Workflow Phase
- Nucleic-acid Extraction & Purification
- Library Construction
- Target Enrichment / Amplicon Generation
- Quality Control & Quantification
- By Application
- Diagnostics
- Drug Discovery / Functional Genomics
- Agriculture & Animal Research
- Other Research Applications
- By End-User
- Hospitals & Reference Labs
- Pharmaceutical & Biotechnology Companies
- Academic & Research Institutes
- Contract Research Organizations
- Others
- By Geography
- North America
- United States
- Canada
- Mexico
- Europe
- Germany
- United Kingdom
- France
- Italy
- Spain
- Rest of Europe
- Asia Pacific
- China
- Japan
- India
- South Korea
- Australia
- Rest of Asia Pacific
- Middle East & Africa
- GCC
- South Africa
- Rest of Middle East & Africa
- South America
- Brazil
- Argentina
- Rest of South America
- North America
Data Sources, Market Sizing, and Validation
Desk Research
Desk research started with clarifying what "sample preparation" means in an NGS workflow, and where spending happens in real labs. We referenced public and official sources such as NIH and NCBI resources on sequencing workflows, the FDA database for cleared sequencing-related tests, and CDC publications that describe genomics use in public health.
To keep the sizing practical, we also used evidence on demand signals and lab adoption, such as OECD health data where relevant, peer-reviewed journals on library prep and nucleic acid extraction practices, and trade association or consortium resources that discuss standards and quality controls. Company annual reports, investor presentations, and reputable press were used to understand product mix and regional exposure. We also used paid subscriptions for company financials and patent databases to confirm technology direction. These examples are not exhaustive, and many other public sources were also checked to collect, validate, and clarify the final assumptions.
Primary Interviews and Surveys
Primary work focused on interviews and structured surveys with a mix of kit and reagent suppliers, automation platform providers, lab managers, and procurement leads from hospitals, reference labs, and biopharma users. Inputs from these respondents were used to confirm the adoption pace for automation, typical pricing movement for major prep steps, and how demand differs across APAC, EMEA, and the Americas when funding cycles and testing volumes shift.
Distribution of primary research fieldwork respondents
| Company type | Respondent position | Region |
|---|---|---|
| Top tier: 27% | CXOs: 17% | APAC: 46% |
| Mid tier: 55% | Functional/Unit leaders: 29% | EMEA: 31% |
| Smaller Players: 18% | Managers: 54% | Americas: 23% |
Market-Sizing & Forecasting
We built the market using a top-down approach where the global NGS demand pool is reconstructed through sequencing activity and workflow usage, and then the portion attributable to pre-sequencing preparation is applied step by step. The split across major preparation steps is shaped using workflow adoption patterns, and then mapped to spend on reagents, consumables, and automation workstations.
To keep totals realistic, the results were checked with selective bottom-up approximations, including sampled pricing times run volumes for common library preparation and extraction routines, plus supplier revenue exposure where it is clearly reported. Several inputs drive the model most in this market, including NGS run volumes by setting, the share of runs using automated library prep, average kits or reagent consumption per sample, typical replacement and utilization rates for workstations, and the mix between research and diagnostic use where purchasing behavior differs. Where direct data was thin, gaps were handled through conservative ranges agreed in interviews, followed by re-checking the implied spend per sample so extreme values did not enter the model.
For forecasting, scenario analysis was used because NGS demand can move quickly with funding, reimbursement, and public health programs. Growth paths for the key variables were built first, then combined into the revenue outlook, with scenario weights adjusted based on expert consensus and observed momentum in automation uptake.
Data Validation & Update Cycle
Outputs were validated through triangulation across independent signals, then reviewed for unusual jumps across years, regions, and product types. If implied price per sample, automation penetration, or regional mix looked inconsistent with interview feedback, the assumptions were reworked and the respondents were re-contacted to confirm the cause.
Before sign-off, the model goes through multiple analyst review steps where formulas, unit logic, and conversion assumptions are checked, and then the narrative is aligned with the numbers. Reports are refreshed annually, with interim updates triggered when major events change sequencing demand or lab spending patterns. Right before delivery, a final pass is completed so clients receive the latest updated view.
Mordor Intelligence's Ngs Sample Preparation Market Size Compared Against Other Published Estimates
It is common to see a spread in published market sizes for NGS sample preparation, even when the topic label looks identical. The main reasons are usually what gets counted as "sample prep," which end users are assumed to drive demand, and how pricing and workflow shifts are handled over the forecast window.
By tracking workflow step level consumption and refreshing key assumptions with respondent checks, Mordor Intelligence keeps the sizing tied to pre-sequencing preparation spend rather than letting adjacent items like sequencing services or downstream analysis inflate the value.
Benchmark comparison
| Source | Market Size | Gaps in Research Methodology |
|---|---|---|
| Mordor Intelligence | USD 2.70 B (2025) | |
| Trade Journal A | USD 4.32 B (2024) | The estimate appears to use a broader workflow boundary that can bundle sequencing related items beyond preparation, and it may apply faster adoption assumptions for automation without step-level spend checks. |
| Regional Consultancy B | USD 2.55 B (2024) | This view looks more conservative, and it likely undercounts clinical and reference lab demand or uses slower pricing and volume progression, which reduces the implied spend per sample in the base year. |
The table shows that most of the gap comes from boundary choices and how sample volumes and pricing are moved forward year to year. When spend is traced to clear preparation steps, and then cross-checked using realistic per-sample economics, the resulting market total is easier to explain and repeat.
Key Questions Answered in the Report
What is the current size of the next-generation sequencing sample preparation market?
It is valued at USD 3.08 billion in 2026 and is projected to reach USD 5.95 billion by 2031.
Which product class dominates revenue?
Reagents and consumables account for 64.12% of 2025 revenue, reflecting recurring demand per sample.
Why is Asia Pacific considered the fastest-growing region?
Government-funded programs such as India’s IndiGen project, expanding pathogen surveillance, and rising healthcare investment drive a 14.22% CAGR in the region.
How are automation workstations impacting laboratory economics?
They reduce an eight-hour manual library prep to roughly 30 minutes, offering return on investment within 18 months for high-volume labs.
What regulatory changes affect laboratory developed tests in the United States?
The FDA’s May 2024 final rule phases out enforcement discretion over four years, requiring high-risk LDTs to undergo premarket review.