
Next-generation Computing Market Size and Share
Market Overview
| Study Period | 2020 - 2031 |
|---|---|
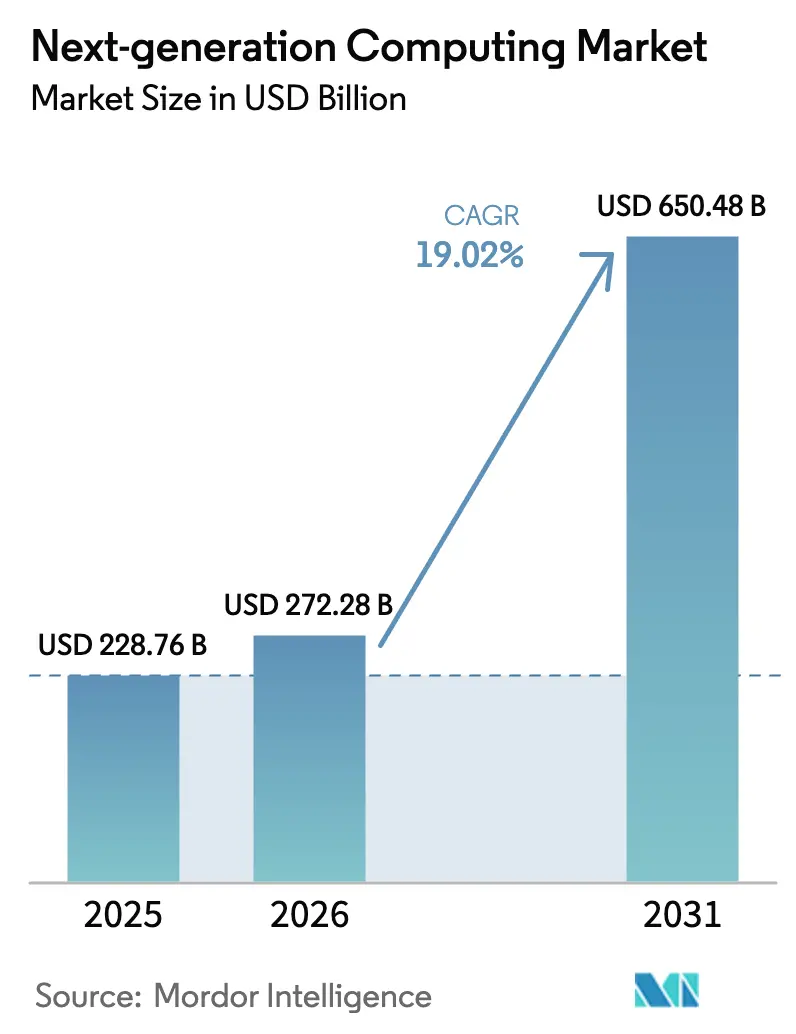
| Market Size (2026) | USD 272.28 Billion |
| Market Size (2031) | USD 650.48 Billion |
| Growth Rate (2026 - 2031) | 19.02% CAGR |
| Fastest Growing Market | Asia Pacific |
| Largest Market | North America |
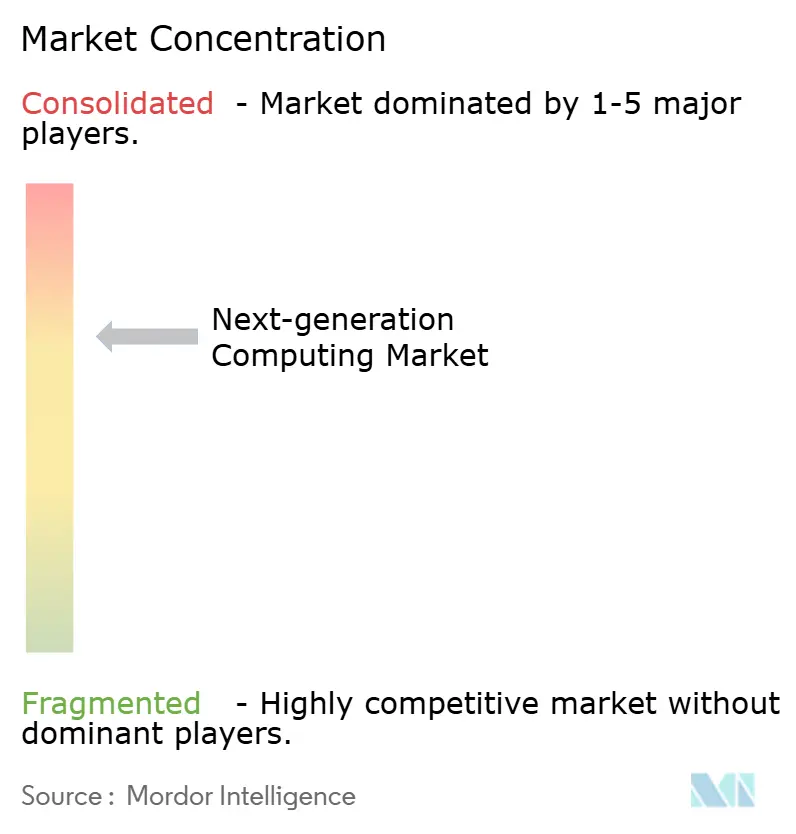
| Market Concentration | Medium |
Major Players *Disclaimer: Major Players sorted in no particular order Image © Mordor Intelligence. Reuse requires attribution under CC BY 4.0. | |
Next-generation Computing Market Analysis by Mordor Intelligence
The next-generation computing market size is expected to grow from USD 228.76 billion in 2025 to USD 272.28 billion in 2026 and is forecast to reach USD 650.48 billion by 2031 at 19.02% CAGR over 2026-2031. The expansion has been fuelled by record demand for generative-AI infrastructure, stepped-up public funding for quantum programmes, and tighter integration of edge and cloud resources that lower latency for industrial Internet of Things (IoT) use cases. Hardware components retained leadership with a 47.2% revenue contribution in 2024, helped by successive GPU and application-specific-integrated-circuit (ASIC) launches that improved performance per watt. Services nevertheless paced the fastest, as rising implementation complexity required specialist providers to integrate heterogeneous clusters across on-premise and cloud estates. Traditional high-performance computing (HPC) architectures still hold 41.2% revenue, though quantum computing solutions are projected to record a 35.2% CAGR, signalling an unmistakable pivot toward non-classical approaches. North America kept a 41.2% hold on the next-generation computing market, while Asia-Pacific emerged as the most buoyant region with a 23.1% CAGR thanks to quantum research incentives and hyperscale cloud build-outs.
Key Report Takeaways
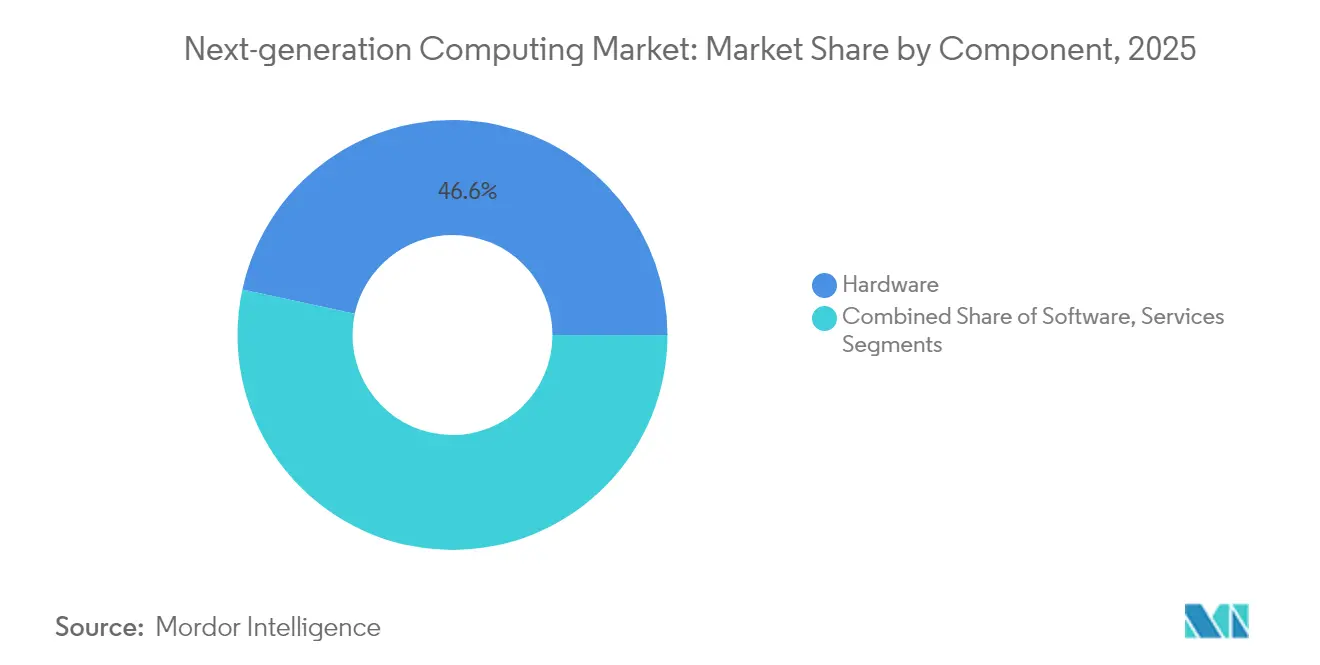
- By component, hardware produced 46.60% of 2025 revenue in the next-generation computing market, whereas services are on course to expand 23.78% CAGR through 2031.
- By computing paradigm, HPC led with 40.70% of the next-generation computing market share in 2025; quantum computing is projected to post a 34.05% CAGR.
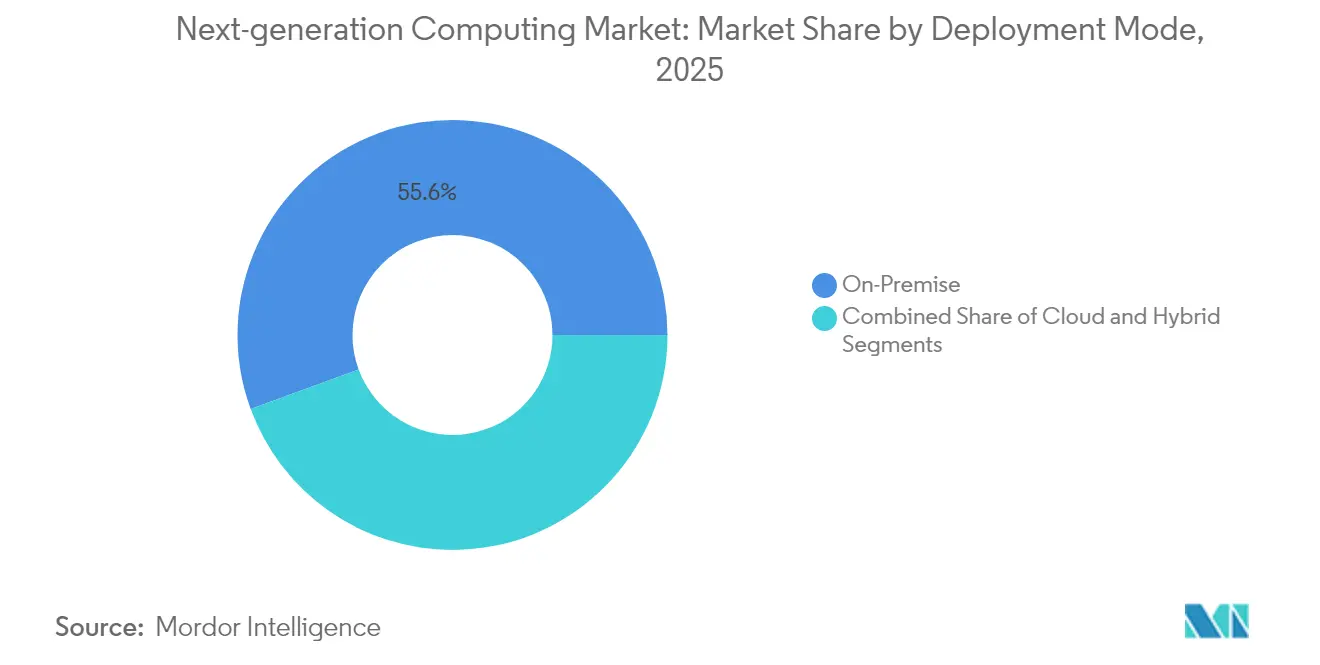
- By deployment mode, on-premise installations captured 55.60% of spending in 2025; cloud deployments carry the highest 27.4% CAGR outlook.
- By end-user sector, BFSI commanded 20.80% revenue, while healthcare and life sciences hold the fastest 31.05% CAGR trajectory.
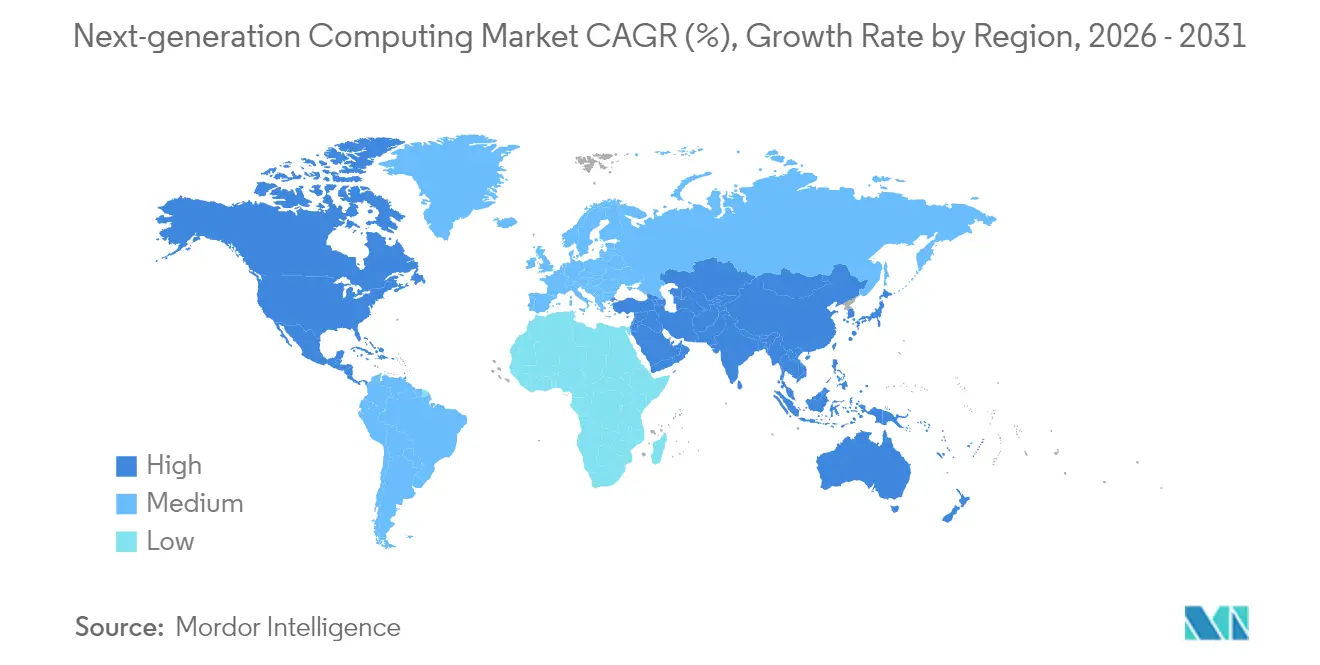
- By region, North America generated 40.80% of 2025 revenue, and Asia-Pacific will deliver the quickest 22.45% CAGR through 2031.
Note: Market size and forecast figures in this report are generated using Mordor Intelligence’s proprietary estimation framework, updated with the latest available data and insights as of 2026.
Global Next-generation Computing Market Trends and Insights
Drivers Impact Analysis*
| Driver | (~) % Impact on CAGR Forecast | Geographic Relevance | Impact Timeline |
|---|---|---|---|
| Demand surge for generative-AI compute scaling | +5.2% | Global with a focus on North America and East Asia | Medium term (2–4 years) |
| Government funding waves for quantum-tech hubs | +3.8% | North America, Europe, Asia-Pacific | Long term (≥ 4 years) |
| Edge-to-cloud convergence for ultra-low-latency IoT | +2.7% | Global with early adoption in industrial economies | Medium term (2–4 years) |
| Falling GPU TCO via cloud credits and open-IP chiplets | +1.9% | Global | Short term (≤ 2 years) |
| Liquid-cooling breakthroughs enabling dense HPC racks | +1.3% | North America, Europe, East Asia | Medium term (2–4 years) |
| Secondary market for de-commissioned AI accelerators | +0.8% | Global with concentration in emerging markets | Short term (≤ 2 years) |
| Source: Mordor Intelligence | |||
Demand surge for generative-AI compute scaling
Fiscal-2025 datacenter revenue at a leading GPU vendor more than doubled year-over-year, confirming that large language models (LLMs) and image generators now dominate silicon demand. Blackwell-class processors integrated 208 billion transistors, enabling trillion-parameter inference with a fraction of prior-generation energy draw. Cloud providers responded by releasing dedicated AI instances that bundle low-latency networking and pooled high-bandwidth memory, allowing medium-sized firms to access exa-scale capacity on demand. System integrators simultaneously re-engineered board-level power delivery and introduced software stacks that finesse scheduling across thousands of GPUs, flattening barriers to entry. These steps combined to accelerate capital flows into the next-generation computing market and to reinforce hardware refresh cycles.
Government funding waves for quantum-tech hubs
The United States Department of Energy opened USD 625 million in fresh awards for quantum research in January 2025. [1]United States Department of Energy, “Funding Opportunity Announcement: Quantum Information Science,” energy.gov Similar UK allocations of GBP 121 million (USD 164.34 million) supported national testbeds and business accelerators. Funding clusters anchor universities, national labs, and private suppliers into long-term partnerships, share prototyping risk, and catalyse workforce development through fellowship programmes. In parallel, Japan and India enlarged their sovereign quantum budgets to build supply-chain resilience around dilution refrigerators, photonics, and control electronics. These initiatives triggered patent filings in qubit connectivity, cryogenic packaging, and error-mitigation algorithms, adding durable momentum to the next-generation computing market.
Edge-to-cloud convergence for ultra-low-latency IoT
Roughly one-fifth of the 157 zettabytes created by connected devices in 2025 was processed outside central data centers, a proportion set to rise as 5G moves to 5.5G deployments. Industrial firms embedded AI accelerators into factory gateways, allowing vision systems to reject defects in under ten milliseconds. Cloud providers extended lightweight Kubernetes distributions for single-node clusters, permitting identical microservices to shift seamlessly between edge and core. Network-equipment vendors contributed Time-Sensitive Networking and private-5G slices to guarantee deterministic packet delivery. Collectively, these advances tightened feedback loops in autonomous vehicles, smart grids, and telemedicine, swelling the next-generation computing market with new workload classes.
Falling GPU TCO via cloud credits and open-IP chiplets
Hyperscalers used targeted credit programmes that cut initial AI-instance bills by up to 30%, luring developers who might otherwise buy on-premise gear. On the silicon side, modular chiplet architectures let vendors stitch independently verified logic, memory, and I/O tiles inside one package, improving yield and lowering die cost. An RDNA 4-based GPU family showcased 40% higher performance per compute unit than its predecessor, while retaining compatible drivers, reducing migration expense. Start-ups also prototyped chiplets on older nodes linked to advanced interposers, bringing acceptable performance to mid-market buyers. Cheaper entry points broadened the buyer base and lengthened the tail of the next-generation computing market.
Restraints Impact Analysis*
| Restraint | (~) % Impact on CAGR Forecast | Geographic Relevance | Impact Timeline |
|---|---|---|---|
| Quantum-skilled talent shortage | –2.1% | Global with severe impact in emerging markets | Medium term (2–4 years) |
| High CAPEX and integration risk for heterogeneous clusters | –1.8% | Global | Short term (≤ 2 years) |
| Grid-power and permitting bottlenecks for hyperscale DCs | –1.6% | North America, Europe, parts of Asia-Pacific | Medium term (2–4 years) |
| Export-control limits on advanced HBM and GPU shipments | –1.2% | Global but concentrated in China and Russia | Short term (≤ 2 years) |
| Source: Mordor Intelligence | |||
Quantum-skilled talent shortage
A 2025 survey of quantum-technology stakeholders showed 45% citing workforce scarcity as their primary adoption barrier. Quantum algorithm design blends physics, mathematics, and computer science, yet mainstream curricula rarely cover all three. Enterprises attempted to close gaps via internal boot camps and joint university chairs, but ramp-up time often exceeded project deadlines. While government scholarships expanded PhD enrolment, near-term supply remained tight, delaying planned roll-outs in cryptography, optimisation, and material-science workloads and moderating overall expansion of the next-generation computing market.
Grid-power and permitting bottlenecks for hyperscale DCs
Total global data center electricity draw is expected to cross 29,000 TWh by 2030, with generative-AI workloads alone absorbing 1.5% of global power demand. Regions such as Northern Virginia, Dublin, and Frankfurt faced multi-year wait-lists for new grid interconnects, forcing operators to postpone cluster deployments. Equipment vendors reacted by releasing 800V high-voltage DC powertrains that reduce copper use and losses. [2]HPCwire, “NVIDIA 800 V HVDC Architecture Will Power the Next Generation of AI Factories,” hpcwire.comSome operators also trialled underground thermal energy storage and liquid cooling to shave peak consumption. Permit streamlining remains crucial; until resolved, site-location decisions will skew toward regions offering renewable capacity, influencing geographic dispersion in the next-generation computing market.
*Our forecasts treat driver/restraint impacts as directional, not additive. The impact forecasts reflect baseline growth, mix effects, and variable interactions.
Segment Analysis
By Component: Hardware primacy under service-led acceleration
The next-generation computing market size tied to hardware reached USD 106.59 billion in 2025, powered by the adoption of GPUs, tensor processing units, and photonic interconnects. Exascale-class boards integrated six HBM stacks, doubling bandwidth and allowing 10× larger model training batches. Memory producers committed capacity expansions to meet a projected fifteen-fold increase in HBM demand for HPC and AI by 2035, safeguarding component supply. Power-efficient optical links also entered mainstream server boards, cutting latency between accelerator pods to microsecond levels.
Services, although smaller, grew faster by handling architecture design, secure deployment, and life-cycle management. Managed quantum workloads, AI-pipeline optimisation, and proactive cooling analytics formed new fee lines. Cloud providers bundled professional services hours into platform subscriptions, creating annuity-style revenue. This hybrid revenue mix improved resilience in the next-generation computing market during hardware supply oscillations and cultivated customer lock-in around specialised toolchains.


By Computing Paradigm: Quantum momentum reshapes dominant HPC
HPC still delivered the bulk of 2024 revenue, thanks to well-established procurement cycles in weather modelling, fluid dynamics, and financial risk grids. Vendors launched exascale systems that combined x86 or Arm CPUs with next-generation GPUs on NVLink-over-Ethernet fabrics, offering single-precision throughput beyond seven exaflops. Such leaps sustained the next-generation computing market even as alternative paradigms matured.
Quantum computing exhibited the steepest growth curve. D-Wave released a 5,000-plus-qubit annealer geared for combinatorial optimisation, while trapped-ion and neutral-atom providers attracted venture funding for error-corrected prototypes. Early hybrid pilots saw quantum kernels accelerate Monte Carlo simulation convergence in high-finance risk models. Given its 34.05% CAGR outlook, quantum will progressively erode classical-only budgets, solidifying its role in the overall next-generation computing market.
By Deployment Mode: On-premise dominance meets cloud elasticity
On-premise clusters accounted for 55.60% of 2025 spending in the next-generation computing market because defence, finance, and genomics labs require deterministic performance and regulatory control. Tier-1 banks retrofitted private GPU superpods with micro-channel liquid cooling that reduced floor-space needs by half. Sovereign cloud regulations in Europe further encouraged in-country hardware.
Cloud installations, however, posted the swiftest gains, with enterprise usage nearing universality by 2025. Hyperscalers expanded accelerator density via four-GPU mezzanine cards and liquid-cooled chassis offered as on-demand SKUs. Enterprises leveraged these remotely accessible clusters for model-training bursts, then pulled inference workloads on-premise to manage cost. Hybrid and multi-cloud orchestration frameworks fused identity management and data locality governance, mitigating vendor lock-in and widening the customer funnel for the next-generation computing market.
By End-User Industry: BFSI scale balanced by healthcare agility
Financial institutions represented 20.80% of 2025 revenue in the next-generation computing market. Algorithmic-trading desks required microsecond response times, achieving them with co-located FPGA edge nodes. Banks also trialled quantum-safe cryptography to future-proof data vaults, adding incremental spending on post-quantum key-exchange appliances.
Healthcare and life sciences are expected to deliver a 31.05% CAGR. Radiology departments deployed AI inference at point-of-image acquisition, slashing diagnosis wait times. Large bio-pharma firms ran de-novo drug-discovery pipelines that used protein-folding LLMs trained on hundreds of millions of sequences. Quantum machine-learning pilots at leading medical centres investigated cardiovascular-surgery risk prediction, showcasing how clinical outcomes can shape capital budgeting and broaden societal value in the next-generation computing market.
Geography Analysis
North America generated 40.80% of 2025 revenue in the next-generation computing market. The United States alone accounted for roughly three-quarters of regional spend, buoyed by public financing, deep venture capital, and dominant cloud incumbents. National laboratories operated pathfinder quantum testbeds that integrate neutral-atom arrays with exascale supercomputers, cementing leadership. Energy-efficient data-centre innovations emerged from cross-industry consortia, reflecting policy focus on sustainability.
Asia-Pacific will post the fastest 22.45% CAGR. China, Japan, and India expanded semiconductor park incentives and subsidised quantum-research fellowships. Hyperscale operators pledged to double colocation white-space in Singapore, Sydney, and Mumbai to meet AI demand. Parallel 5G-Advanced roll-outs created new edge-computing nodes, deepening workload localisation and strengthening regional relevance of the next-generation computing market. Australia and South Korea joined multilateral alliances on quantum standards, adding technical pluralism to the region.
Europe preserved a unified industrial strategy combining digital sovereignty and environmental stewardship. Germany’s Fraunhofer institutes advanced neuromorphic prototypes targeting sub-watt inference, while French labs piloted photonic-based quantum routers. The EU’s fit-for-55 climate package spurred data-centre operators to sign long-term renewable-energy purchase agreements, aligning regulatory compliance with investor pressure. These initiatives elevated Europe’s role as a sustainability vanguard within the next-generation computing market.

Regulatory Landscape
Regulation for next-generation computing is increasingly tied to AI governance and compute sovereignty, which then feeds into cloud deployment choices, model evaluation approaches, and data center procurement. In the European Union, general-purpose AI obligations under the EU AI Act became operational on 2 August 2025, while certain high-risk obligations were moved to later timelines through the Digital Omnibus (shifting key deadlines into December 2027 and August 2028). This sequence has affected compliance roadmaps for providers delivering foundation models and managed AI platforms.
In the United States, federal direction in 2026 focused on security and coordination rather than licensing. The White House released a National AI Legislative Framework in March 2026 to reduce fragmented state-level requirements, and a June 2026 executive order added classified benchmarking for covered frontier models involving agencies such as the NSA and CISA. At the state level, California SB 53 (Transparency in Frontier Artificial Intelligence Act) was signed on 29 September 2025 and set safety framework and reporting expectations for very large-scale models (thresholded by compute), reinforcing governance requirements that can shape validation tooling, auditing services, and deployment controls across cloud and on-premise accelerated computing estates.
Value Chain Analysis
The value chain runs from advanced semiconductor equipment and manufacturing through system integration and cloud delivery. Upstream value accrues to lithography and process tooling suppliers such as ASML and to foundries and advanced packaging partners such as TSMC, where high-end packaging capacity has become a gating factor. Expansions cited for TSMC CoWoS target roughly 120,000 to 130,000 wafers per month by end-2026, which directly affects accelerator and HBM-rich module availability.
Midstream, accelerator designers and platform owners such as NVIDIA for GPUs and interconnect stacks, and hyperscalers building custom ASICs such as Google TPU and AWS Trainium, sit alongside memory and storage suppliers, notably HBM providers, plus server OEMs and ODMs. For example, Dell and Supermicro assemble AI and HPC racks with power and thermal subsystems. Downstream, hyperscale cloud providers including AWS, Google Cloud, and Microsoft Azure productize the capacity into AI-optimized instances and managed services, while systems integrators and consulting arms support heterogeneous cluster design, security, and lifecycle operations across hybrid estates. A structural shift is the growing role of hyperscaler ASICs, positioned on workload-specific economics (cited as 40-65% lower TCO versus GPUs for certain use cases), which changes bargaining dynamics for accelerator suppliers and raises the importance of software toolchains, compilers, and orchestration that make mixed-accelerator environments workable at scale.
Competitive Landscape
The competitive arena remained moderately concentrated; the five largest vendors controlled majority of overall revenue share, yet niche innovators proliferated. NVIDIA kept nearly 80% of the enterprise AI-accelerator sub-segment through continuous GPU, interconnect and software-stack updates. AMD challenged with modular chiplet-based GPUs that promise competitive throughput at lower cost, while Intel refined Ponte Vecchio multicore tiles for HPC. Start-ups such as Cerebras Systems used wafer-scale engines for specialised natural-language-model inference, diversifying supplier options.
Quantum hardware competition intensified. IonQ acquired a controlling stake in cryptography specialist ID Quantique to bundle quantum-safe networking with trapped-ion processors. [4]Photonics Media, “IonQ to Acquire ID Quantique,” photonics.com Neutral-atom provider QuEra closed a large funding round to build fault-tolerant arrays exceeding one million physical qubits. Superconducting-qubit pioneers collaborated with microwave-component manufacturers to slash control-system overheads. These moves collectively expanded the supplier base, enlarging the total addressable portion of the next-generation computing market.
Horizontal alliances broadened solution scope. Eaton and Siemens Energy developed 50% lower-emission power-plant architectures targeting hyperscale campuses, tackling the grid-level footprint that could otherwise restrain expansion. Systems integrators partnered with photonics foundries to package co-packaged optics, solving bandwidth ceilings in next-generation Ethernet fabrics. Such cross-disciplinary ventures redirected competition from single-component races toward vertically integrated stacks that encompass silicon, software and sustainability, solidifying holistic value propositions in the next-generation computing market.
Next-generation Computing Industry Leaders
Amazon Web Services Inc.
Alphabet Inc. (Google Cloud)
Microsoft Corp.
IBM Corp.
NIVIDIA Corp.
- *Disclaimer: Major Players sorted in no particular order

Market Opportunities and Future Outlook
Public programs focused on compute sovereignty and hardware readiness create whitespace for capacity build-outs, more localized supply chains, and specialized integration services. In the United Kingdom, the DSIT AI Hardware Plan lays out an end-to-end hardware innovation pipeline, including AI Growth Zones and over GBP 1 billion committed to the AI Research Resource, which supports demand for accelerated infrastructure, networking, and deployment services across research and early commercial workloads. In the European Union, the proposed Cloud and AI Development Act is designed around increasing computing capacity and sovereignty through supply-side measures, which favors regional investments in data centers, cloud, and advanced compute, and can expand procurement for compliant, energy-aware infrastructure.
Commercially, hyperscaler capital intensity is a direct opportunity catalyst across servers, interconnect, cooling, and managed services. Evidence referenced in the report, including large 2026 capex guidance such as Google guidance of USD 175 to 185 billion and an aggregate range for top hyperscalers, points to continued scaling of AI-ready capacity. At the same time, constraints in advanced packaging, including CoWoS, increase the premium on supply assurance, packaging partnerships, and design choices that reduce reliance on the most constrained components. This combination supports (i) workload-optimized silicon programs spanning GPUs, ASICs, and supporting software, (ii) power delivery and thermal solutions for dense racks, and (iii) professional services that operationalize deployment governance, model evaluation, and hybrid operations under evolving AI compliance regimes.
Recent Industry Developments
- July 2026: IBM Corp. launches Power Systems and software built for enterprises to address risk, productivity, and flexibility. The move tightens IBM's alignment of hardware and software to enterprise AI workloads, expanding its role in next-generation computing deployments.
- June 2026: IBM Corp. debuts world's first sub-1 nanometer chip technology. IBM unveils a 1 nm class process, signaling a node advancement that boosts performance per watt. The development elevates IBM's hardware roadmap and potential competitive lead in advanced computing stacks.
- June 2026: IBM Corp./Google Cloud announce strategic partnership to scale AI with human expertise and AI powered delivery. The partnership combines cloud scale with AI delivery capabilities to accelerate enterprise AI adoption. The collaboration expands IBM and Google Cloud footprint in next-generation computing deployments.


Research Methodology Framework and Report Scope
Market Definition and Coverage
For this report, the next generation computing market is defined as the revenue earned from advanced computing hardware, software, and related services that enable higher performance, lower latency, or new compute methods for enterprise and public-sector use cases.
Scope exclusions: We exclude general purpose PCs and routine IT infrastructure refresh spending that does not add next generation compute capability.
Segmentation Overview
- By Component
- Hardware
- Processors and Accelerators
- Memory and Storage
- Interconnect and Networking
- Thermal and Power Solutions
- Software
- Services
- Hardware
- By Computing Paradigm
- High-Performance Computing (HPC)
- Quantum Computing
- Optical/Photonic Computing
- Neuromorphic Computing
- Edge / Near-Edge Computing
- Cloud-Native Accelerated Computing
- Hybrid and Other Emerging
- By Deployment Mode
- Cloud
- On-Premise
- Hybrid
- By End-user Industry
- BFSI
- Healthcare and Life Sciences
- Automotive and Transportation
- Energy and Utilities
- Aerospace and Defense
- Media and Entertainment
- IT and Telecom
- Retail and e-Commerce
- Manufacturing and Industrial
- Government and Public Sector
- Other End-user Industries
- By Geography
- North America
- United States
- Canada
- Mexico
- South America
- Brazil
- Argentina
- Rest of South America
- Europe
- Germany
- United Kingdom
- France
- Italy
- Russia
- Rest of Europe
- Asia Pacific
- China
- Japan
- South Korea
- India
- ASEAN
- Rest of Asia Pacific
- Middle East and Africa
- Middle East
- Saudi Arabia
- UAE
- Turkey
- Rest of Middle East
- Africa
- South Africa
- Nigeria
- Rest of Africa
- Middle East
- North America
Data Sources, Market Sizing, and Validation
Desk Research
Desk research was used to set clear market boundaries and to build the first layer of inputs around technology adoption, compute capacity expansion, and demand signals by end-user industry. We referred to non-paywalled sources such as U.S. Census datasets and U.S. Bureau of Economic Analysis (BEA) series for macro and IT spend context, World Bank indicators for cross-country normalization, and OECD digital economy statistics for adoption and investment signals. We also reviewed NIST publications and other public standards materials (where applicable) so terminology stays consistent across quantum, neuromorphic, optical, and advanced accelerator-led computing discussions.
To connect the model to realistic revenue pools, we complemented the above with company annual reports, earnings call transcripts, investor presentations, and reputable press coverage on data center builds and advanced compute deployments. Select paid subscriptions were used only where they help standardize company financial splits and to cross-check patenting activity trends in enabling technologies, without relying on paywalled market-size estimates. The desk sources listed here are illustrative, and many other public documents and datasets were also consulted for data collection, cross-checking, and clarification.
Primary Interviews and Surveys
Primary work was completed through expert interviews and structured surveys with participants across the value chain, including component suppliers, system providers, cloud and data center operators, and enterprise buyers. We used these conversations to validate what is being purchased versus piloted, how pricing is moving for advanced compute systems and enabling software, and which end uses are scaling across major regions.
Distribution of primary research fieldwork respondents
| Company type | Respondent position | Region |
|---|---|---|
| Top tier: 25% | CXOs: 17% | APAC: 47% |
| Mid tier: 58% | Functional/Unit leaders: 27% | EMEA: 34% |
| Smaller Players: 17% | Managers: 56% | Americas: 19% |
Market-Sizing & Forecasting
Our sizing starts with a top-down build that reconstructs the addressable revenue pool using IT and digital infrastructure spend signals, followed by penetration and mix assumptions for advanced compute across key end uses. Once that scaffold is set, the totals are corroborated with selective bottom-up checks, such as sampled supplier revenue roll-ups, channel conversations on shipment and deployment volumes, and ASP times volume calculations for representative compute categories, which are then used to adjust any overshoots.
Inputs were kept practical and market-linked, including data center capacity additions, accelerator and advanced compute attach rates, enterprise workload growth for AI and simulation, observed price movement for compute infrastructure, and the share of deployments shifting to cloud or edge setups. Forecasts were produced using scenario analysis, because adoption and pricing can move quickly with technology cycles, and the scenarios were anchored to expert views on capacity plans, procurement timing, and expected commercialization pace. When a clean bottom-up trail was not available for smaller countries or emerging paradigms, we filled gaps using proxy indicators like regional ICT investment, cloud build-out activity, and validated adoption ratios, and then rechecked the implied results with interview feedback.
Data Validation & Update Cycle
Validation is handled through multiple checks so the final numbers stay consistent with real-world signals. We compare model outputs against independent indicators such as infrastructure investment trends, deployment announcements, and the implied revenue per capacity, and then any large variance is investigated before sign-off. If an assumption creates an unusual jump in a single year, it is challenged, reworked, and sometimes re-tested through follow-up conversations.
Reports are refreshed annually, and interim updates are made when material events occur, such as policy changes, sharp pricing shifts, or major capacity expansion updates. Before delivery, an analyst completes a fresh pass on inputs and calculations so clients receive the most current view available at the time.
Mordor Intelligence's Next Generation Computing Market Size Measured Against Other Published Estimates
Published market sizes for next generation computing often differ because the scope can be interpreted in more than one way, and because not every publisher updates pricing and deployment assumptions at the same time. Differences also show up when one estimate counts only hardware shipments, but another adds software platforms, services, or adjacent IT spending that is not directly tied to advanced compute adoption.
Some external figures broaden the market by blending general cloud infrastructure spending and conventional compute refresh into the same total, which can inflate value in years with heavy data center investment. Those adjacent items sit outside scope here, and Mordor Intelligence keeps the count limited to revenue tied to identifiable next generation paradigms and their enabling stacks, and it is then checked against capacity additions and adoption signals to keep totals grounded.
Benchmark comparison
| Source | Market Size | Gaps in Research Methodology |
|---|---|---|
| Mordor Intelligence | USD 228.76 B (2025) | |
| Global Consultancy A | USD 160.97 B (2024) | Uses a narrower technology basket that emphasizes only selected advanced compute categories, and it appears to rely on older company revenue splits, which can understate platform and service revenue tied to deployments. |
| Trade Journal B | USD 152.13 B (2024) | Leans heavily on hardware-oriented reporting with limited normalization for recent ASP movement and regional deployment mix, which can compress totals when higher value systems take a larger share. |
The spread in the table mainly comes from what is counted as next generation computing revenue and how quickly pricing and deployment mix assumptions are refreshed. By keeping inputs tied to traceable demand signals and repeatable checks, we arrive at a balanced number that can be tracked year to year.


Key Questions Answered in the Report
What is the projected next-generation computing market size in 2031?
The next-generation computing market size is expected to reach USD 650.48 billion by 2031, up from USD 272.28 billion in 2026.
Which component category is expanding fastest?
Services are expanding the quickest, with a 23.78% CAGR to 2031 as enterprises seek integration, optimisation and managed-operations expertise.
How large is the opportunity for quantum computing within the next-generation computing market?
Quantum solutions are forecast to grow at a 34.05% CAGR, making them the most dynamic computing paradigm over the period.
Why does on-premise deployment still dominate the next-generation computing market?
Security mandates and deterministic performance requirements kept 55.60% of 2025 spending on on-premise clusters, especially in finance, defence and genomics research.
Which region will record the fastest growth?
Asia-Pacific will record the fastest expansion, at a 22.45% CAGR, driven by quantum research funding and hyperscale cloud capacity doubling.
What is the chief restraint on quantum-technology adoption?
A global shortage of quantum-skilled professionals is the biggest bottleneck, trimming the overall CAGR by an estimated 2.1%.
Page last updated on:






