
Next-Generation Antibody Therapeutics Market Size and Share
Market Overview
| Study Period | 2020 - 2031 |
|---|---|
| Market Size (2026) | USD 3.09 Billion |
| Market Size (2031) | USD 4.35 Billion |
| Growth Rate (2026 - 2031) | 7.12 % |
| Fastest Growing Market | Asia-Pacific |
| Largest Market | North America |
| Market Concentration | Medium |
Major Players *Disclaimer: Major Players sorted in no particular order Image © Mordor Intelligence. Reuse requires attribution under CC BY 4.0. | |
Next-Generation Antibody Therapeutics Market Analysis by Mordor Intelligence
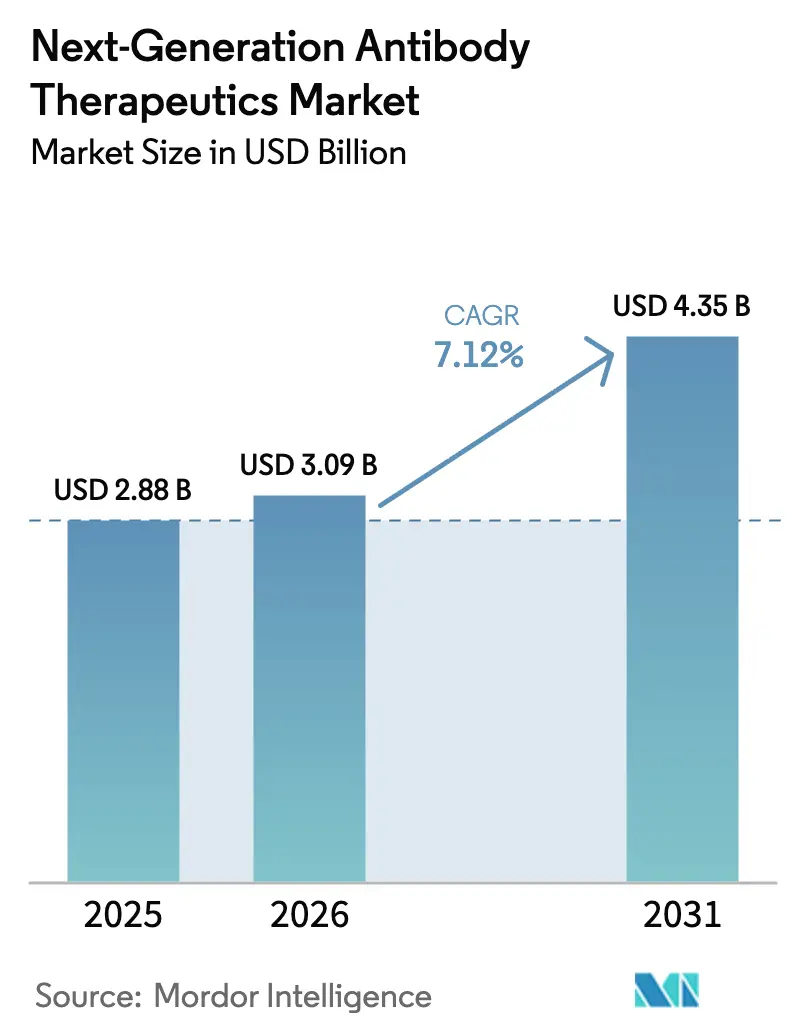
The next-generation antibody therapeutics market size in 2026 is estimated at USD 3.09 billion, growing from 2025 value of USD 2.88 billion with 2031 projections showing USD 4.35 billion, growing at 7.12% CAGR over 2026-2031. This solid mid‐single-digit trajectory signals the growing clinical and commercial influence of advanced antibody formats that deliver targeted cytotoxicity, dual-pathway immune modulation, and longer half-life dosing[1]U.S. Food & Drug Administration, “Modernizing the Development of Monoclonal Antibody Products,” fda.gov. Rapid clinical validation in solid tumors, steady gains in autoimmune applications, and increasingly supportive regulatory frameworks combine to accelerate adoption. Integration of artificial-intelligence-guided design shortens discovery cycles, while innovative formulation science propels a shift from intravenous to subcutaneous delivery in chronic regimens. These developments collectively reinforce the next-generation antibody therapeutics market as a high-value growth engine within biopharmaceuticals. North America maintains leadership on the strength of mature reimbursement systems and an extensive clinical-trial network, yet manufacturing expansions in Asia Pacific and supportive EU policies ensure sustained global competition through 2030.
Key Report Takeaways
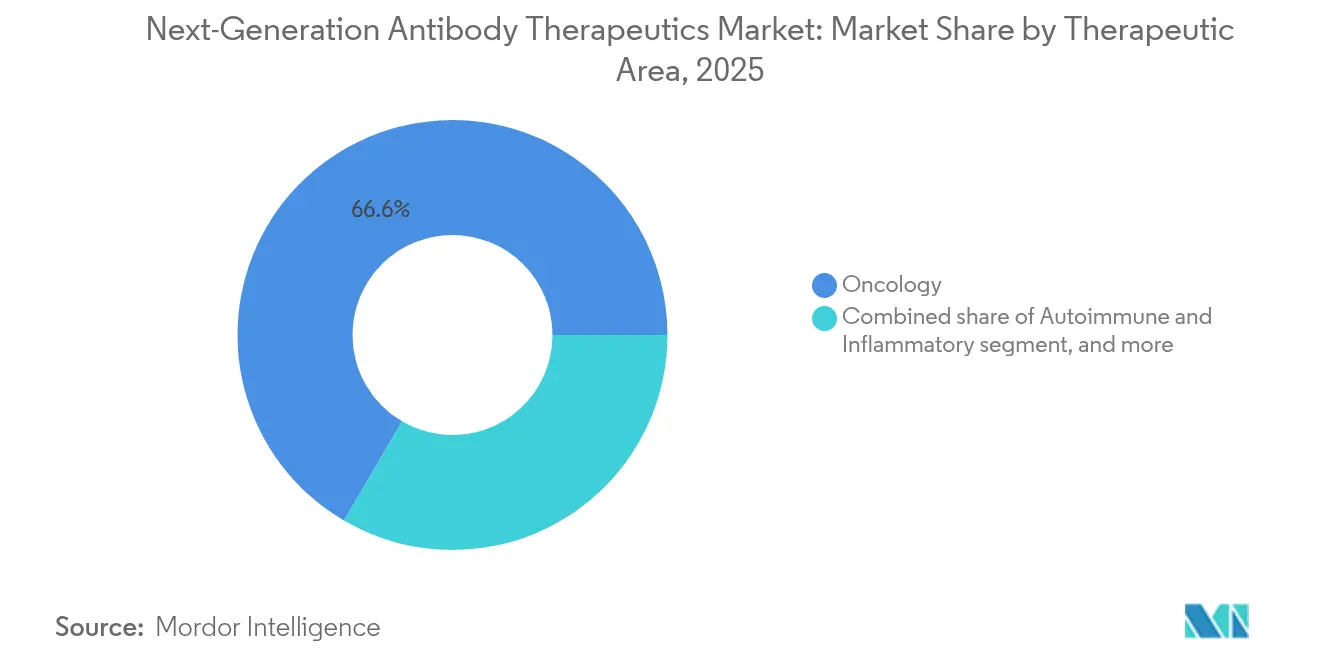
- By therapeutic area, oncology captured 66.58% of next-generation antibody therapeutics market share in 2025; non-oncology segments are forecast to grow at a 9.38% CAGR between 2026 and 2031.
- By technology, ADCs held 43.52% of the 2025 revenue pool, while bispecific and multispecific formats are advancing at an 10.92% CAGR over the forecast period.
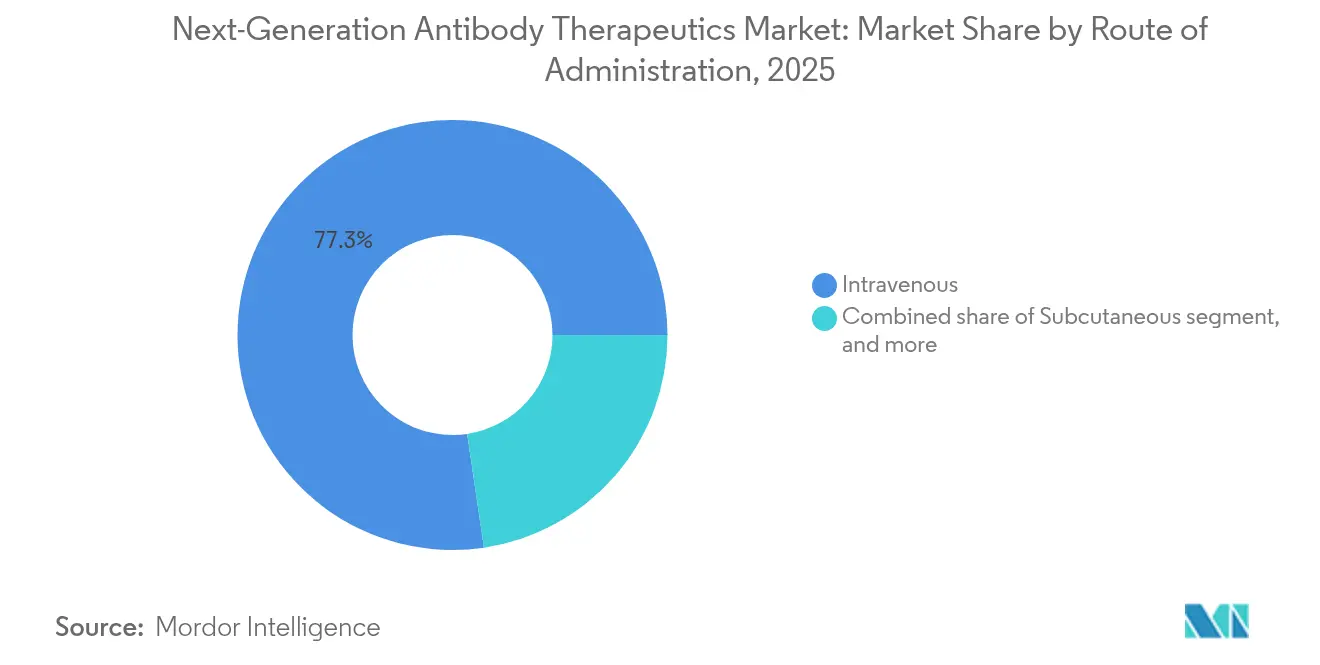
- By route of administration, subcutaneous formulations are expanding at 8.76% CAGR, challenging an intravenous base of 77.34% market share in 2025.
- By distribution channel, specialty clinics and cancer centers are growing at 8.84% CAGR but still trail hospital pharmacies’ 58.27% share in 2025.
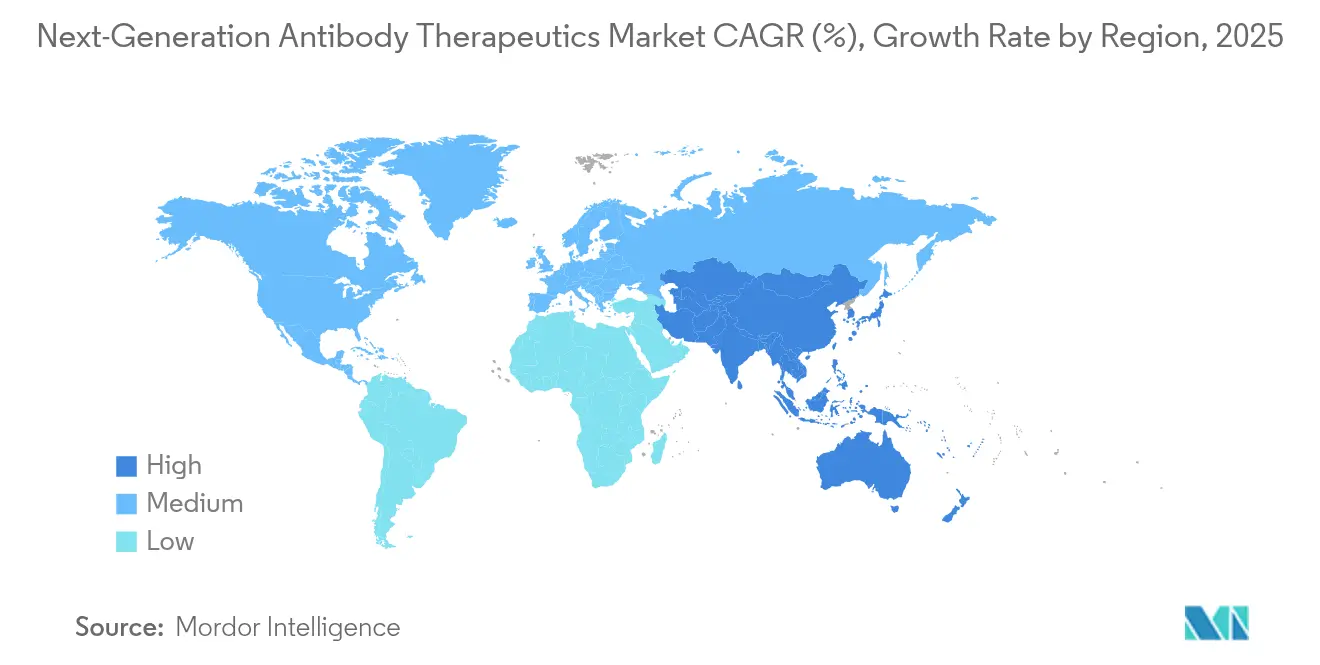
- Regionally, Asia Pacific is the fastest mover at a 10.08% CAGR, underpinned by large-scale biomanufacturing investments such as AstraZeneca’s USD 1.5 billion ADC facility in Singapore.
Note: Market size and forecast figures in this report are generated using Mordor Intelligence’s proprietary estimation framework, updated with the latest available data and insights as of 2026.
Market Trends and Insights
Drivers Impact Analysis of Next-Generation Antibody Therapeutics Market*
| Driver | % Impact on CAGR Forecast | Geographic Relevance | Impact Timeline |
|---|---|---|---|
| Rising global cancer incidence & unmet need in solid tumors | +1.8% | Global | Long term (≥ 4 years) |
| Growing prevalence of autoimmune disorders worldwide | +1.2% | Global | Long term (≥ 4 years) |
| Rapid advancements in antibody-engineering technologies (ADCs, bispecifics, Fc-engineering) | +0.9% | Global | Medium term (2–4 years) |
| Increasing venture-capital & big-pharma investments in next-gen antibody pipelines | +0.8% | North America, Europe, Asia-Pacific | Medium term (2–4 years) |
| Expansion of biomanufacturing capacity & specialized CDMO capabilities | +0.6% | North America, Asia-Pacific | Medium term (2–4 years) |
| Favorable regulatory designations (BTD, PRIME, RMAT) accelerating approvals | +0.5% | North America, Europe | Short term (≤ 2 years) |
| Source: Mordor Intelligence | |||
Rising Global Cancer Incidence & Unmet Need in Solid Tumors
Escalating global cancer incidence intensifies the call for targeted therapeutics. More than 600 ADC candidates are in active trials for solid tumors, with breast and lung indications leading enrollment. Recent regulatory nods for HER2-low breast-cancer ADCs in 2024–2025 have energized development programs for gastric and ovarian malignancies, strengthening the clinical case for the next-generation antibody therapeutics market. Community oncology practices are adopting these agents earlier in treatment algorithms, driving a redistribution of infusion resources and accelerating patient access through 2030.
Growing Prevalence of Autoimmune Disorders Worldwide
Autoimmune diseases are emerging as the fastest-expanding opportunity segment. Bispecific constructs that can dampen multiple inflammatory pathways while sparing broad immunosuppression display high response durability in Phase 2 trials for rheumatoid arthritis and inflammatory bowel disease. Self-administrable subcutaneous formulations reduce clinic visits, supporting chronic disease management and broadening the commercial horizon for the next-generation antibody therapeutics market.
Rapid Advancements in Antibody-Engineering Technologies
Novel glycoengineering, site-specific conjugation, and Fc-domain alteration enable superior potency and safety profiles. Beyond classical cytotoxic payloads, developers are integrating radioisotopes and immunomodulators, widening indications and improving therapeutic windows. AI-guided epitope selection and in-silico developability screening accelerate lead optimization, reinforcing the technology edge.
Increasing Venture Capital & Big-Pharma Investments
More than USD 50 billion has flowed into platform acquisitions and co-development deals since 2024. Pfizer, Roche, and Eli Lilly each expanded their portfolios with multi-asset next-generation antibody programs, signalling sustained capital support for pipeline scale-up.
Restraints Impact Analysis of Next-Generation Antibody Therapeutics Market*
| Restraints Impact Analysis | (~) % Impact on CAGR Forecast | Geographic Relevance | Impact Timeline |
|---|---|---|---|
| Stringent regulatory & analytical requirements for novel antibody formats | −1.5% | North America, Europe | Short term (≤ 2 years) |
| High development & manufacturing costs for complex biologics | −1.2% | Global | Long term (≥ 4 years) |
| Safety and off-target toxicity concerns with potent antibody constructs | −0.8% | Global | Medium term (2–4 years) |
| Pricing pressures & biosimilar competition post-patent expiry | −0.6% | North America, Europe, Asia-Pacific | Long term (≥ 4 years) |
| Source: Mordor Intelligence | |||
Stringent Regulatory & Analytical Requirements
Novel formats such as bispecifics and ADCs require extensive characterization of critical quality attributes. The FDA’s focus on interstitial lung disease risks in ADCs mandates additional pulmonary monitoring, delaying pivotal studies fda.gov. While the 2025 elimination of mandatory animal testing cuts some timelines, it simultaneously necessitates sophisticated in-vitro and computational assays, challenging resource-constrained developers.
High Development & Manufacturing Costs
ADC production can be 1.5-2× costlier than conventional monoclonals due to linker chemistry, high-potency payload handling, and complex analytical release. Scarcity of GMP payload manufacturing and constrained fill-finish capacity sustain elevated cost-of-goods, pushing launch prices toward the high end and inviting payer scrutiny.
*Our forecasts treat driver/restraint impacts as directional, not additive. The impact forecasts reflect baseline growth, mix effects, and variable interactions.
Next-Generation Antibody Therapeutics Market Segment Analysis
By Therapeutic Area:
Oncology Dominance Faces DiversificationOncology retained 66.58% of the next-generation antibody therapeutics market in 2025, reflecting the transformative effect of ADCs and bispecific T-cell engagers in refractory tumors. Recent approvals for HER2-low breast cancer and small-cell lung cancer entrench these modalities in first-line regimens. Novel targets such as Claudin-18.2 and c-Met broaden the patient base, sustaining oncology’s revenue lead.
Non-oncology indications are forecast to log a 9.38% CAGR, anchored by autoimmune and respiratory infectious-disease programs. Precision immune modulation via bispecific constructs offers prolonged remission without systemic toxicity, a compelling proposition for disorders requiring lifelong management.


By Technology:
ADCs Lead While Bispecifics AccelerateADCs generated 43.52% of 2025 revenue. Homogeneous conjugation techniques and radio-payload innovation are extending applicability into hematology and solid-tumor niches. The next-generation antibody therapeutics market size tied to ADCs is set to expand as radioimmunoconjugates gain traction in difficult-to-resect tumors.
Bispecific and multispecific antibodies advance at an 10.92% CAGR, validated by approvals such as tarlatamab for small-cell lung cancer. Modular platforms ease construction of dual-specific binders, accelerating pipeline diversity. Fc-engineered IgGs enhance antibody-dependent cellular cytotoxicity, offering differentiated competitive positioning.
By Route of Administration:
Intravenous Dominance Shifting to SubcutaneousIntravenous treatment held 77.34% of 2025 administrations, but subcutaneous delivery grows rapidly at 8.76% CAGR. High-concentration formulations supported by hyaluronidase facilitate 5-10 mL injections, increasing at-home dosing. The next-generation antibody therapeutics market size attributable to subcutaneous formats will climb as wearable on-body injectors gain regulatory clearance.
Localized routes remain niche yet strategic in ocular, orthopedic, and intratumoral settings. These methods maximize local drug levels, limiting systemic exposure and enabling dose-sparing in toxicity-sensitive populations.
By Distribution Channel:
Hospital Pharmacies Dominate Amid Specialty-Center GrowthHospital pharmacies accounted for 58.27% of 2025 product flow, a reflection of infusion-centric usage and side-effect monitoring needs. However, specialty oncology centers and ambulatory clinics show 8.84% CAGR, propelled by subcutaneous options and payer incentives for site-of-care shifts. Cloud-integrated pharmacovigilance systems support safe outpatient dosing.
Retail and e-pharmacies supply maintenance doses for stable patients, hinting at future diversification of distribution pathways within the next-generation antibody therapeutics market.
Geography Analysis
North America Next-Generation Antibody Therapeutics Market
North America commanded 47.56% of 2025 revenue, driven by high cancer prevalence, favorable reimbursement, and a rich concentration of biotech innovation. The U.S. leads on expedited pathways and advanced manufacturing tax credits that mitigate capital outlay for new plants. The 2025 regulatory shift away from animal testing is expected to shave months off pre-clinical timelines, sustaining the regional lead fda.gov.
APAC Next-Generation Antibody Therapeutics Market
Asia Pacific delivers the fastest growth at 10.08% CAGR. China’s high-profile biotech subsidies and Singapore’s best-in-class manufacturing incentives draw multinationals to establish regional supply hubs, anchoring the next-generation antibody therapeutics market there. Japan and South Korea leverage mature regulatory frameworks to speed conditional approvals for life-saving biologics. Expanded patient access programs and rising middle-class healthcare spending further boost uptake.
Europe Next-Generation Antibody Therapeutics Market
Europe maintains strong scientific infrastructure and reimbursement systems yet contends with rigorous price-value assessments. Recent EMA procedural reforms shorten clock-stop period for priority medicines, encouraging earlier filings. National health systems prioritize therapies with robust survival benefits, compelling developers to generate real-world evidence packages at launch. Germany, France, and the Nordics demonstrate the highest per-capita usage of next-generation antibody therapeutics.

Regulatory Landscape
Regulation for next-generation antibody therapeutics is shaped by heightened expectations for nonclinical justification, immunogenicity risk management, and product-specific CMC control strategies for complex modalities such as ADCs and bispecific or multispecific antibodies. In December 2025, the US FDA issued the draft guidance Monoclonal Antibodies: Streamlined Nonclinical Safety Studies (Docket FDA-2025-D-4634) to reduce animal testing for monospecific antibodies; the public comment period ended February 2, 2026, and industry groups and companies asked the FDA to broaden the scope to cover multispecific antibodies and ADCs. In Europe, the EMA maintains risk-based immunogenicity assessment guidelines for biotechnology-derived therapeutic proteins, using a regulatory approach that emphasizes modality-specific assays and tailored clinical monitoring plans.
Competitive Landscape
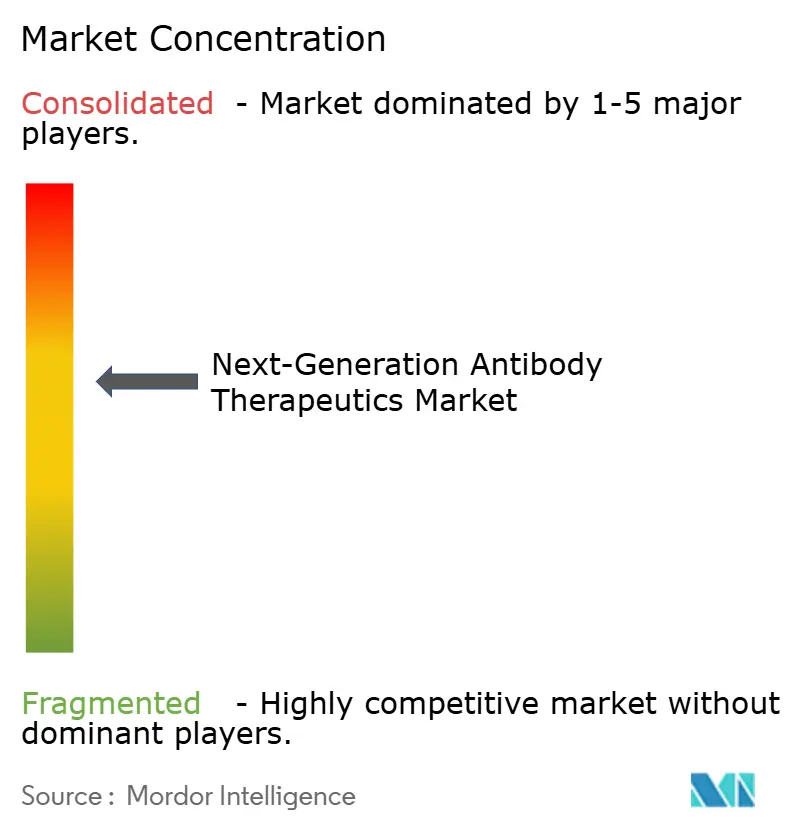
Industry concentration is moderate. Roche, AstraZeneca, and Pfizer sit atop revenue rankings, combining deep-pipeline breadth with in-house manufacturing. Roche’s Genentech campus integrates discovery through fill-finish, enabling rapid scale-up. AstraZeneca’s Singapore ADC plant delivers vertical integration and supply resilience[2]GeneOnline, “AstraZeneca to Invest USD 1.5 Billion in Singapore ADC Facility,” geneonline.com . Pfizer’s in-house radio-payload line underscores its technology diversification.
Strategic partnerships proliferate. Eli Lilly collaborates with BigHat Biosciences for AI-optimized antibodies, speeding affinity maturation cycles[3]Patsnap Synapse, “Eli Lilly and BigHat Biosciences Announce Collaboration,” synapse.patsnap.com. Roche teams with Oxford Biotherapeutics on next-wave conjugation chemistry, while Novartis’ purchase of Anthos Therapeutics secures abelacimab, a cardiovascular monoclonal antibody with blockbuster aspirations.
Specialized CDMOs such as Lonza and Samsung Biologics invest heavily in high-potency payload suites and aseptic fill-finish. Control of linker IP and payload supply positions these vendors as pivotal gatekeepers for small innovators seeking rapid clinical supply.
White-space opportunity remains in neurological and fibrotic indications, where blood-brain barrier crossing and deep-tissue penetration pose challenges. Advances in fragment-based delivery and receptor-mediated transcytosis could unlock these domains, creating fresh competitive fronts for the next-generation antibody therapeutics market.
Next-Generation Antibody Therapeutics Industry Leaders
AstraZeneca Plc.
Bristol-Myers Squibb Company
F. Hoffmann-La Roche Ltd.
Pfizer, Inc.
Seagen Inc.
- *Disclaimer: Major Players sorted in no particular order
Next-Generation Antibody Therapeutics Market Companies Covered in this Report
- Amgen
- AstraZeneca
- Bayer
- Biogen
- Bristol-Myers Squibb
- Roche
- GlaxoSmithKline
- Pfizer
- Seagen
- Xencor
- ImmunoGen
- Kyowa Kirin
- Genmab
- Regeneron Pharmaceuticals
- Abbvie
- Gilead Sciences
- MacroGenics Inc.
- ADC Therapeutics
- Zymeworks Inc.
- Sanofi
- Merck
Read Analysis of Next-Generation Antibody Therapeutics Companies

Market Opportunities and Future Outlook
Market opportunities center on modular, platform-style manufacturing for ADCs that can accommodate different antibody-linker-payload combinations, as companies move beyond fixed recipe models to manage portfolio diversity. Integrated CMC platforms such as WuXi Biologics WuXiBody and WuXia are positioned to shorten CMC and launch timelines for complex biologics, while manufacturing capacity expansions target up to 30 tons of biologics production annually by 2029. On the therapeutics side, late-stage ADC and bispecific programs involving Pfizer, Bristol Myers Squibb, and AstraZeneca shape competitive positioning, and Asia-Pacific manufacturing investments, including AstraZeneca’s USD 1.5 billion ADC facility in Singapore, support regional expansion through the forecast period.
Recent Industry Developments in Next-Generation Antibody Therapeutics Market
- July 2026: AstraZeneca signed a deal to acquire global rights for Zegfrovy (sunvozertinib) from Dizal Pharmaceutical, enabling an EGFR-targeted NSCLC program to advance. The transaction expands AstraZeneca's oncology portfolio and supports supply chain access. It also reflects the company's focus on broadening next-generation EGFR targeted therapies and diversifying its pipeline.
- July 2026: Novartis entered an agreement to acquire Myricx Bio to advance next-generation ADC payloads. The acquisition expands Novartis' ADC payload capabilities and broadens discovery for next-generation antibody drug conjugates. The announced deal could influence 2026-2031 market dynamics by accelerating efforts toward more potent and versatile payload platforms.
- May 2026: Bristol Myers Squibb announced interim Phase 2 data for pumitamig (PD-L1xVEGF-A bispecific) in NSCLC at ASCO. The update supports a bispecific strategy in lung cancer and informs competitive positioning against other next-generation ADC and bispecific antibody programs. The data reinforce its focus on dual-target antibody approaches in solid tumors and may affect near-term development priorities.


Next-Generation Antibody Therapeutics Market Report Scope and Research Methodology
Market Definition and Coverage
This market covers revenue generated from next-generation antibody therapeutics used for treatment, counted at the commercial sales level across major geographies, and expressed in USD for the study years.
Scope exclusions: Basic research tools and lab-only reagents that are not sold or prescribed as therapeutic products are excluded.
Segments Covered in This Report
- By Therapeutic Area
- Oncology
- Autoimmune & Inflammatory
- Other Therapeutic Areas
- By Technology
- Antibody-Drug Conjugates (ADCs)
- Bispecific & Multispecific Antibodies
- Fc-Engineered & Glyco-Engineered IgGs
- Antibody Fragments & Antibody-Like Proteins
- Engineered Full-Length mAbs (IgG4, IgG1? Variants)
- Biosimilar Next-Gen Antibody Products
- By Route of Administration
- Intravenous
- Subcutaneous
- Localized Administration (Intratumoral, Intravitreal)
- By Distribution Channel
- Hospital Pharmacies
- Specialty Clinics & Cancer Centers
- Retail & Online Pharmacies
- Geography
- North America
- United States
- Canada
- Mexico
- Europe
- Germany
- United Kingdom
- France
- Italy
- Spain
- Rest of Europe
- Asia-Pacific
- China
- Japan
- India
- Australia
- South Korea
- Rest of Asia-Pacific
- Middle East & Africa
- GCC
- South Africa
- Rest of Middle East & Africa
- South America
- Brazil
- Argentina
- Rest of South America
- North America
Data Sources, Market Sizing, and Validation
Desk Research
Desk research was used to set the boundaries of what counts as next-generation antibody therapeutics, and to build a clean starting point for epidemiology, approvals, and broad pricing context. We leaned on non-paywalled sources such as FDA drug databases, EMA public assessment reports, ClinicalTrials.gov, WHO cancer and disease statistics, and OECD health data to confirm patient pools and the direction of therapy adoption.
To ground the commercial side, we reviewed company annual reports, investor presentations, earnings call transcripts, and reputable press coverage on launches and label expansions. We also used paid subscriptions for company financial intelligence, news and financials, and patent databases, mainly to cross-check timelines and to avoid missing major portfolio changes. The sources listed here are illustrative only, and many other public and paid references were used for data collection, validation, and clarification.
Primary Interviews and Surveys
Primary work was done through expert interviews and structured surveys with a mix of manufacturers, distributors, clinicians, hospital pharmacy stakeholders, and researchers who follow antibody modalities in practice. These interviews were used to confirm which antibody formats are being counted, how pricing is evolving by indication and line of therapy, and which regions are showing faster uptake. This helped tighten assumptions from desk research before finalization.
Distribution of primary research fieldwork respondents
| Company type | Respondent position | Region |
|---|---|---|
| Top tier: 34% | CXOs: 14% | APAC: 40% |
| Mid tier: 52% | Functional/Unit leaders: 37% | EMEA: 34% |
| Smaller Players: 14% | Managers: 49% | Americas: 26% |
Market-Sizing & Forecasting
Sizing started with a top-down demand build that links treated patient pools to therapy adoption, then to value using modality-appropriate average selling price logic, which we checked against observable approval and usage signals. To keep it practical, we focused on incidence and prevalence by key indications, the share of eligible patients moving to targeted biologics, therapy line progression, route-of-administration mix, and the timing of new approvals and label expansions.
After the top-down totals were built, we used selective bottom-up approximations to test reasonableness, including sampled product revenue roll-ups from public filings, channel checks on uptake speed, and ASP x volume cross-checks where volume proxies were available. When public pricing visibility was limited in certain markets, ranges were anchored to expert guidance and then constrained with nearby analogs in the antibody therapy space.
For forecasting, we used scenario analysis supported by trend-based smoothing on key drivers, then pressure-tested the outputs using primary feedback on pipeline conversion expectations and launch ramp patterns. Growth paths were adjusted when assumptions on pricing erosion, competition timing, or reimbursement access did not match what stakeholders reported from the field.
Data Validation & Update Cycle
Validation relied on consistent triangulation across the model, desk signals, and interview feedback, so outliers could be spotted early rather than after the full build. We compared model outputs against independent markers such as the pace of regulatory approvals, trial activity shifts, and disclosed revenue trajectories, then reworked any area where the implied adoption curve looked unrealistic.
Before sign-off, the model and narrative are reviewed in multiple steps by analysts, with variance checks at regional and therapeutic levels to prevent double counting and scope creep. Reports are refreshed annually, and interim updates are made when material events occur, such as major approvals, safety actions, or pricing policy changes. Right before delivery, a final pass is completed so clients receive the most current view available.
Mordor Intelligence's Next Generation Antibody Therapeutics Market Size Compared With Other Published Estimates
Published market numbers for next-generation antibody therapeutics can vary because each publisher draws the boundary in a slightly different way, and because base year selection and conversion timing are not always aligned. Differences become more visible when pricing is modeled differently across indications, and when launch ramps are assumed to be fast without being checked against real adoption signals.
A refresh-led gap often shows up when currency conversion dates and updated ASP expectations are not synchronized with recent approvals and label expansions, which is why our annual refresh rules and variance checks are applied tightly in Mordor Intelligence.
Benchmark comparison
| Source | Market Size | Gaps in Research Methodology |
|---|---|---|
| Mordor Intelligence | USD 3.09 B (2026) | |
| Industry Newsletter A | USD 16.54 B (2025) | This estimate appears to treat the market as a broader antibody drug universe and uses a different base year, which can pull in adjacent antibody classes and inflate totals versus a modality-focused definition. |
| Regional Consultancy B | USD 10.50 B (2023) | The scope likely includes a wider set of antibody therapies and may apply aggressive uptake and pricing assumptions across regions without separating next-generation modalities from conventional antibodies. |
The spread mainly comes from what gets counted as next-generation versus general antibody drugs, and from how price and timing assumptions are refreshed year to year. By keeping the scope tied to defined next-generation modalities and by checking ASP and adoption timing against observable regulatory and demand signals, the resulting number stays traceable to clear steps that can be repeated.


Key Questions Answered in the Report
What is the forecast size of the next-generation antibody therapeutics market by 2031?
The next-generation antibody therapeutics market size is projected at USD 4.35 billion by 2031.
Which technology currently dominates the market?
Antibody-drug conjugates account for 43.52% of 2025 revenue and remain the leading technology segment.
Why are subcutaneous formulations gaining popularity?
Subcutaneous dosing supports at-home administration, reduces infusion-center burden, and is growing at a 8.76% CAGR.
Which region offers the highest growth potential?
Asia Pacific leads with a 10.08% CAGR, bolstered by large-scale biomanufacturing investments and expanding clinical-trial activity.
How do regulatory reforms affect development timelines?
The FDA’s 2025 removal of mandatory animal testing is expected to shorten U.S. pre-clinical phases, accelerating first-in-human entry.
What primary challenge constrains wider adoption?
Elevated manufacturing complexity and cost keep launch prices high, inviting payer scrutiny and potentially limiting access.
Page last updated on:


 Your data is secure and never sold or shared.


