
Market Overview
| Study Period | 2020 - 2031 |
|---|---|
| Forecast Data Period | 2026 - 2031 |
| Historical Data Period | 2020 - 2024 |
| Market Size (2026) | USD 53.65 Billion |
| Market Size (2031) | USD 123.36 Billion |
| Growth Rate (2026 - 2031) | 18.12 % |
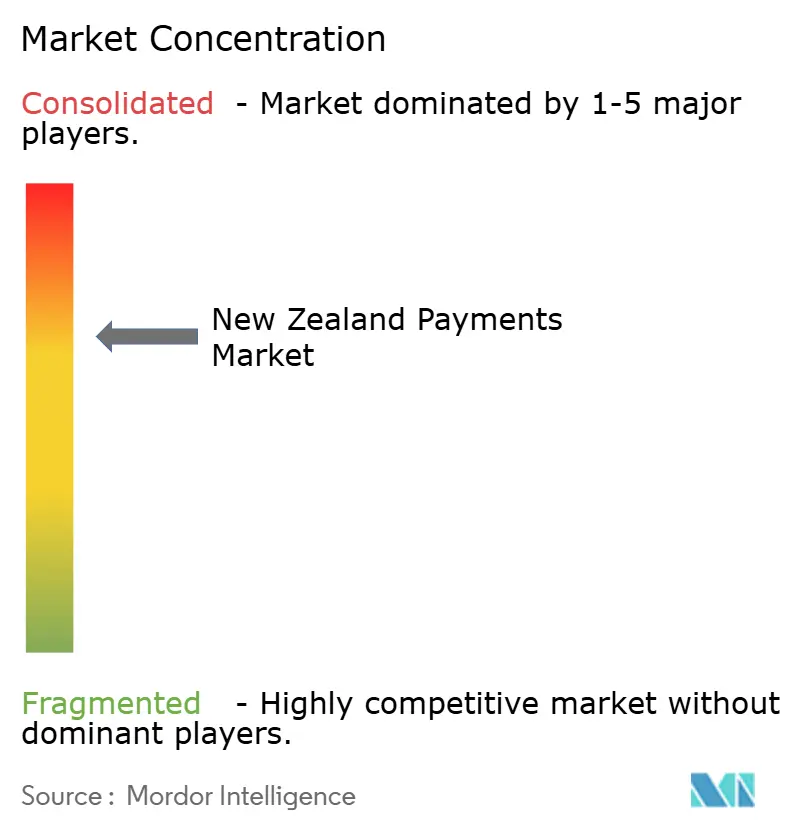
| Market Concentration | Medium |
Major Players *Disclaimer: Major Players sorted in no particular order Image © Mordor Intelligence. Reuse requires attribution under CC BY 4.0. | |
New Zealand Payments Market Analysis by Mordor Intelligence
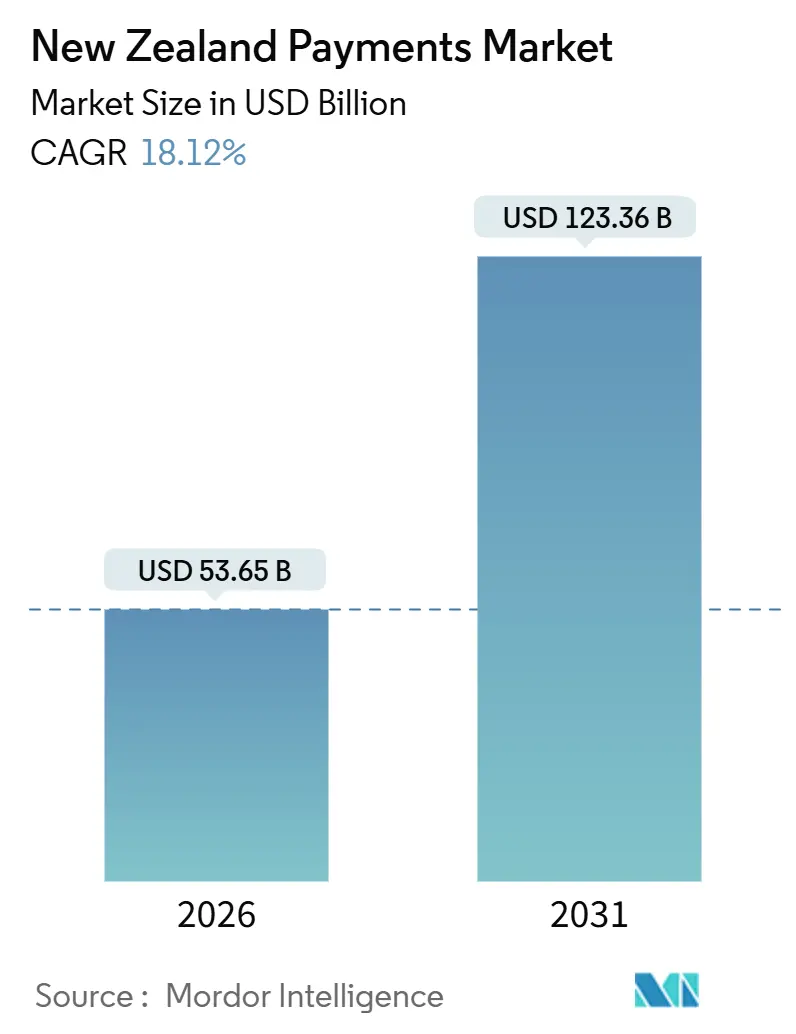
The New Zealand payments market size stands at USD 53.65 billion in 2026 and is projected to reach USD 123.36 billion by 2031, reflecting an 18.12% CAGR. Lower interchange fees, rapid real-time infrastructure deployment, and sustained contactless enthusiasm are steering volume from cash and batch settlement toward digital rails. Incumbent banks lean on open-banking APIs to shield deposits from wallet providers, while global processors court micro-merchants with software-only acceptance that trims hardware costs. Cross-border specialists use transparent foreign-exchange pricing to win exporters dissatisfied with bank spreads, and buy-now-pay-later platforms remain resilient despite stricter credit checks. The New Zealand payments market is therefore shaped by regulatory nudges that compress pricing yet stimulate usage, demographic cohorts native to mobile commerce, and infrastructure moves that compress settlement times from overnight to real time.
Key Report Takeaways
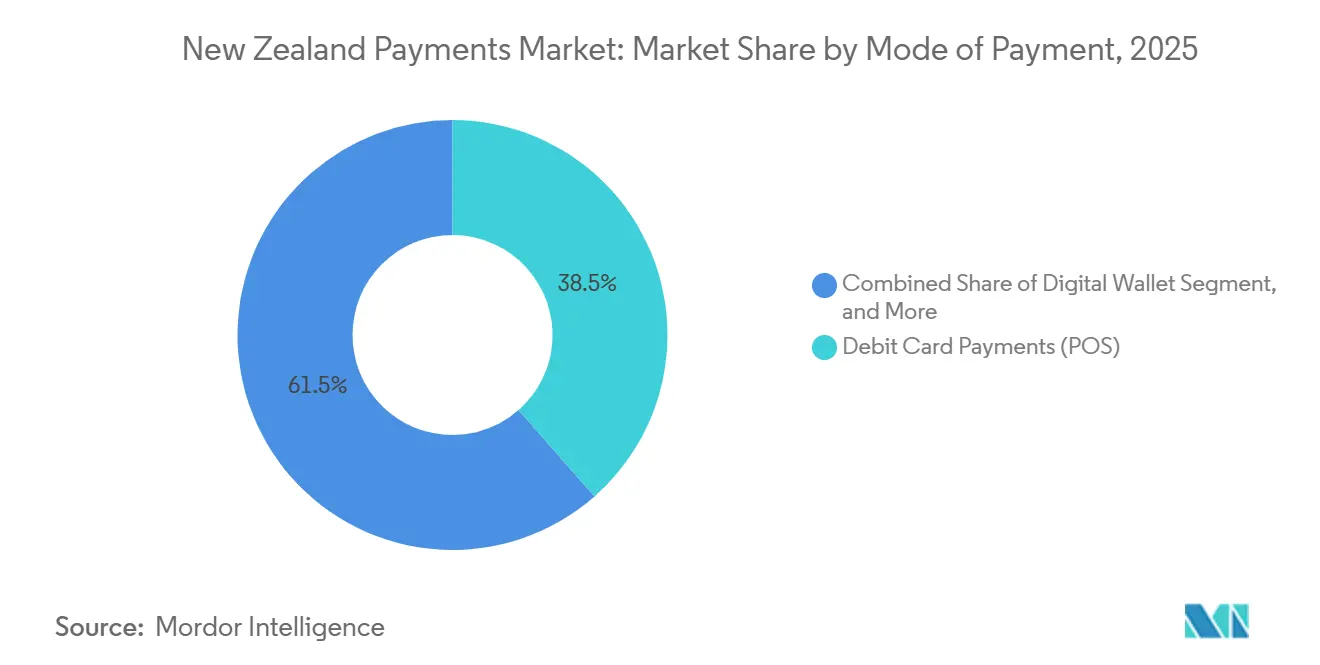
- By mode of payment, debit card transactions held 38.52% of the New Zealand payments market share in 2025. Digital wallets posted the fastest expansion at a 19.62% CAGR through 2031.
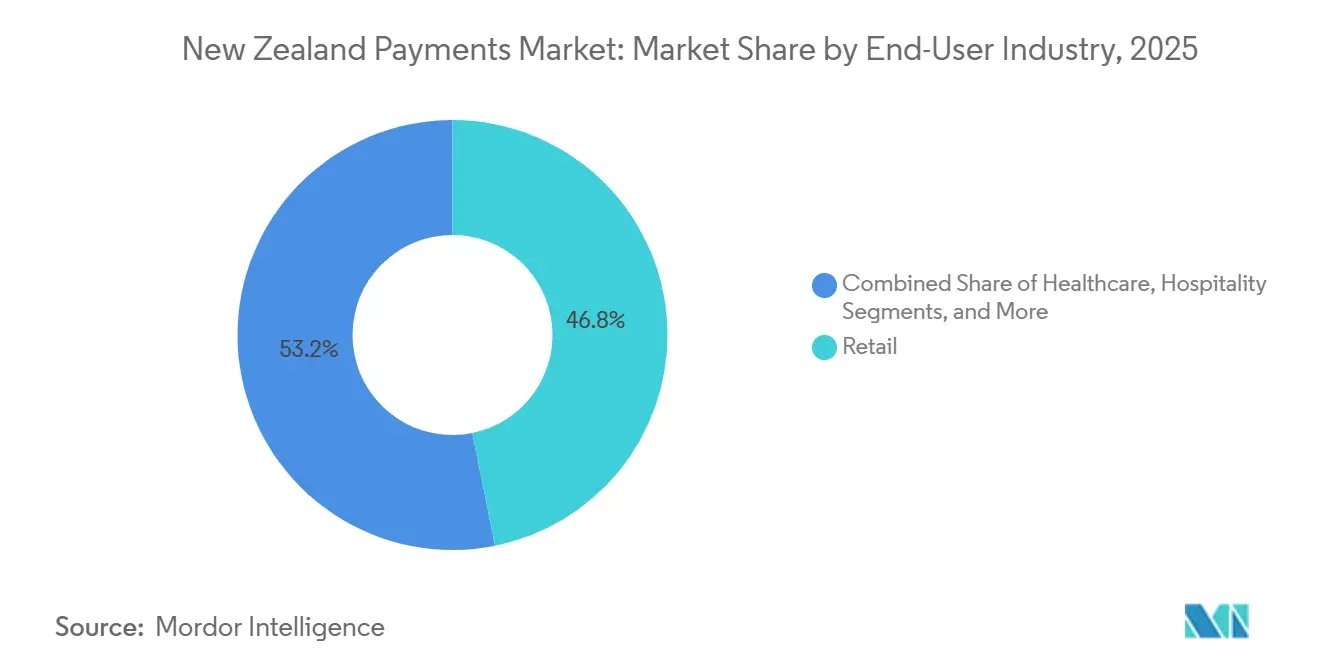
- By end-user industry, retail accounted for 46.83% of the New Zealand payments market size in 2025. Hospitality is tracking a 19.74% CAGR to 2031.
Note: Market size and forecast figures in this report are generated using Mordor Intelligence’s proprietary estimation framework, updated with the latest available data and insights as of January 2026.
New Zealand Payments Market Trends and Insights
Drivers Impact Analysis*
| Driver | (~) % Impact on CAGR Forecast | Geographic Relevance | Impact Timeline |
|---|---|---|---|
| Accelerated contactless-card limits boosting tap-and-go usage | +3.2% | National, especially Auckland, Wellington, Christchurch | Short term (≤ 2 years) |
| Rapid uptake of real-time payments infrastructure by domestic banks | +4.1% | National | Medium term (2-4 years) |
| Surge in buy-now-pay-later adoption among Millennials and Gen Z | +2.8% | Urban centers nationwide | Medium term (2-4 years) |
| Cross-border e-commerce growth fueling FX payment services | +2.3% | Export-oriented SMEs in Canterbury and Otago | Medium term (2-4 years) |
| Māori and Pasifika digital-inclusion initiatives unlocking underserved merchants | +1.6% | North Island communities, South Auckland, Porirua | Long term (≥ 4 years) |
| Carbon-neutral payment offerings gaining merchant preference | +1.1% | Early adoption in Wellington and Auckland CBD | Long term (≥ 4 years) |
| Source: Mordor Intelligence | |||
Accelerated Contactless-Card Limits Boosting Tap-and-Go Usage
Permanent retention of the NZD 200 tap limit introduced during the pandemic has entrenched near-universal contactless behavior, with 72% of residents tapping at least weekly.[1] Apple’s Tap to Pay on iPhone, live since November 2024, extends acceptance to sole traders unwilling to rent terminals.[2] Worldline’s Tap on Mobile counters this disruption by transforming Android phones into EFTPOS devices. Competition has trimmed blended merchant discount rates below 1% in grocery and fuel, reinforcing card acceptance rather than cannibalizing it. The behavioral lock-in of tap-and-go therefore sustains transaction growth even as interchange revenue compresses.
Rapid Uptake of Real-Time Payments Infrastructure by Domestic Banks
The Reserve Bank’s November 2025 decision to fund a national instant-payment rail will eliminate NZD 100 million (USD 60 million) in annual float and reconciliation costs by 2027. BNZ previewed the benefits with Payap, a QR-based account-to-account option settling in seconds at a 0.39% merchant fee. Payment Initiation API v2.3, enabled in May 2025, supports recurring debits that shift utilities and subscriptions off card rails.[3] As real-time rails mature, Visa and Mastercard face declining domestic interchange pools, while banks seek ancillary revenue from data analytics and fraud services. The resulting competitive realignment accelerates the digital shift in the New Zealand payments market.
Surge in Buy-Now-Pay-Later Adoption Among Millennials and Gen Z
Despite mandatory credit checks imposed from September 2024, buy-now-pay-later outstandings reached NZD 2.7 billion (USD 1.63 billion) in 2026, expanding at 16.7% CAGR. Klarna’s 2024 acquisition of Laybuy consolidated 500,000 local accounts under a single underwriting engine. OneChoice’s 2025 research found 63% of consumers attribute impulse spending to cashless plans, yet merchants still enjoy 20% uplift in conversion when installments appear at checkout. Higher compliance barriers weed out under-capitalized entrants, cementing a triopoly and stabilizing default rates. The segment’s stickiness underscores consumer appetite for short-term credit alternatives in the New Zealand payments market.
Cross-Border E-Commerce Growth Fueling FX Payment Services
Wise quantified NZD 667 million (USD 400.2 million) in hidden FX spreads borne by New Zealand SMEs each year. Airwallex and Revolut responded with multi-currency accounts that allow exporters to receive USD, EUR, or GBP without forced conversions. Corpay’s August 2025 partnership with New Zealand Football showcased demand for transparent FX even among non-profits. Publishing real-time mid-market rates has become a competitive signal, pushing banks to disclose spreads or risk outflows. As cross-border volume climbs, FX transparency will remain an incremental growth lever for the New Zealand payments market.
Restraints Impact Analysis*
| Restraint | (~) % Impact on CAGR Forecast | Geographic Relevance | Impact Timeline |
|---|---|---|---|
| High interchange fees deterring small merchants | -2.4% | National, especially rural and low-margin retail | Short term (≤ 2 years) |
| Stringent AML/CFT compliance costs for fintechs | -1.8% | National, heavier burden on startups | Medium term (2-4 years) |
| Limited rural broadband coverage impeding QR and app payments | -1.3% | Northland, East Coast, South Island interior | Medium term (2-4 years) |
| Rising consumer data-sovereignty concerns | -1.1% | Privacy-conscious urban segments | Short term (≤ 2 years) |
| Source: Mordor Intelligence | |||
High Interchange Fees Deterring Small Merchants
Although the July 2025 cap pushed domestic credit interchange down to 0.30%, total acceptance costs for micro-merchants still reach 1.5%-2.5% once acquirer and scheme fees are added. Cafés in Queenstown and bookshops in Dunedin operate on sub-5% margins and view these fees as a revenue tax. A proposed 2025 surcharge ban, intended to save consumers NZD 45-65 million (USD 27-39 million) annually, prevents merchants from passing costs onward, nudging some toward cash-only signage. Account-to-account options like Payap offer cheaper rails, yet consumer unfamiliarity with QR workflows slows migration. Persistently high blended fees therefore restrain electronic penetration in the tail of the New Zealand payments market.
Stringent AML/CFT Compliance Costs for Fintechs
Phased AML and CFT rules introduced between 2023 and 2025 lifted onboarding costs to NZD 15-40 per customer, a level that erodes unit economics for high-volume, low-value payment apps. Laybuy’s 2024 receivership was partly blamed on compliance overheads that outpaced revenue. Credit check mandates for buy-now-pay-later further raised cost structures. Well-capitalized players absorb these expenses, but startups either pivot to B2B niches or exit, trimming competitive diversity in the New Zealand payments industry. The compliance drag slows innovation by diverting resources from product development to regulatory tooling.
*Our forecasts treat driver/restraint impacts as directional, not additive. The impact forecasts reflect baseline growth, mix effects, and variable interactions.
Segment Analysis
By Mode of Payment: Open Banking Chips Away at Card Dominance
Debit cards generated 38.52% of total 2025 volume, underscoring a cultural bias toward immediate settlement and decades of Reserve Bank advocacy for low-cost rails. Digital wallets, growing at a 19.62% CAGR, gained momentum after Apple’s Tap to Pay on iPhone enabled small traders to accept near-field transactions without hardware outlay. Credit cards face flattening spend, as the interchange cap trims issuer economics and merchants steer patrons to cheaper alternatives. Early adopters of BNZ’s Payap illustrate the future such as a QR scan triggers instant account-to-account settlement for a 0.39% fee, compared with the 1.5% merchant discount rate typical on credit lines.
The New Zealand payments market size for account-to-account transactions is expected to expand quickly once the national instant rail goes live, closing the convenience gap with cards. Cash continues to decline in single digits each year, confined to rural pockets where broadband gaps limit QR reliability. Open-banking payments reached 15% of eligible customers in early 2025, and Westpac’s fee-free POLi campaign aims to accelerate merchant integration. As consumer familiarity grows, the New Zealand payments market will likely transition to a three-pillar structure with cards for rewards, wallets for online ease, and open-banking rails for price-sensitive merchants.

By End-User Industry: Hospitality Overtakes in Growth
Retail retained 46.83% of 2025 value, but hospitality logged a 19.74% CAGR that now outpaces every other vertical. Tourist inflows and a shift to mobile ordering lifted hospitality card spending to NZD 14.8 billion (USD 8.88 billion) for the year ended March 2025. Tap to Pay on iPhone allows staff to settle bills tableside, increasing table turnover and tip capture. Healthcare, fueled by a 10-year digital plan, is digitizing co-payments and prescription fees, demanding PCI-compliant, audit-ready rails.
Entertainment merchants harness Payment Initiation API v2.3’s recurring-debit support to streamline subscriptions, while government entities embrace Peppol e-invoicing to cut manual reconciliations. The New Zealand payments market size linked to utility and education flows grows steadily as agencies enforce digital engagement mandates. Providers able to tailor vertical-specific features, tip pooling for restaurants, multi-currency invoicing for exporters, or HIPAA-grade encryption for telehealth, gain an edge in the diversified New Zealand payments industry.
Geography Analysis
Urban centers dominate digital adoption. Auckland, Wellington, and Christchurch generate the bulk of wallet and contactless volume, aided by dense broadband coverage and affluent demographics. In contrast, Northland, the East Coast, and large portions of the South Island still rely on patchy connectivity that impedes QR reliability. Government data show one in five residents lacks foundational digital skills, a figure higher in rural districts. Without targeted training, the rollout of real-time payments could entrench, rather than bridge, the digital divide.
Māori and Pasifika communities face compounded barriers of credit access and digital literacy. Studies from September 2024 found that households without basic transaction accounts are less likely to participate in government e-transfer programs. BNZ’s NZD 0.6 million (USD 0.36 million) grant for skills training offers a template but lacks national reach. Payment providers can spur inclusion by embedding voice prompts, pictograms, and SMS receipts to lower cognitive load.
Export-oriented Canterbury and Otago favor platforms publishing live mid-market FX rates. Wise’s advocacy for transparent pricing and Airwallex’s API settlement resonate with wineries, dairy exporters, and tech outsourcers wary of hidden spreads. Corpay’s football partnership highlights that even sporting bodies are professionalizing treasury flows to capture basis-point savings. The regional picture therefore blends urban fintech concentration with rural cash persistence, demanding nuanced go-to-market strategies across the New Zealand payments market.
Regulatory Landscape
New Zealand’s retail payments are governed by the Retail Payment System Act 2022, with the Commerce Commission actively regulating scheme rules and fees. After setting domestic interchange caps in July 2025 (including a 0.30% domestic credit cap referenced in market dynamics), the Commission extended tighter controls to foreign-issued cards via the Mastercard and Visa Interchange Fee Network Standard 2026, effective 1 May 2026, and continued consultation through a June 2026 draft amended standard.
Open banking moved further into a regulated operating model under the Customer and Product Data Act 2025 (in force from 1 December 2025 for the initial banking scope), while the Commerce Commission’s 5 March 2026 open-banking update letter signaled a transition away from sub-optimal access methods, with banks asked to begin disabling those pathways from June 2026 and to shift most use cases to bank APIs by end-2026. In parallel, digital trust infrastructure progressed through the Digital Identity Services Trust Framework Amendment Rules 2026-1 coming into force on 29 June 2026, strengthening identity-assurance foundations relevant to onboarding and fraud controls for payment providers.
Value Chain Analysis
The New Zealand payments value chain begins with payers and merchants using cards, digital wallets, and account-to-account (A2A) methods, supported by issuers (banks and non-bank program managers), acquirers, gateways/processors, and fraud and identity vendors. Scheme-based card transactions route through Visa and Mastercard rails, while domestic interbank clearing relies on Payments NZ administered systems such as the Bulk Electronic Clearing System (BECS) and Settlement Before Interchange (SBI), with settlement occurring through regulated financial market infrastructure under Reserve Bank of New Zealand (RBNZ) oversight.
Standards and governance bodies are increasingly central to interoperability and competition. Payments NZ’s API Centre sets implementation standards for open banking, while the Customer and Product Data Act 2025 and its Standards (effective 1 December 2025) formalize data-sharing obligations and technical requirements for designated banking data holders. Industry fraud-reduction infrastructure also feeds the chain, illustrated by the Confirmation of Payee ecosystem delivered via obconnect under the New Zealand Banking Association, with banks including ANZ, ASB, BNZ, and Westpac participating, and rapid bank onboarding reported through 2025, which supports safer account-to-account and payment initiation flows.
Competitive Landscape
Legacy banks still hold current accounts and EFTPOS rails, but global processors encroach on merchant relationships. Worldline’s 27 billion annual transactions hinge on a terminal rental model now challenged by software-only acceptance. Stripe bundles treasury, stablecoin, and global payout features into a single API, reducing reliance on correspondent networks. Visa’s Scan to Pay QR launch aims to capture offline-to-online flows, particularly among Asia-Pacific tourists spending in New Zealand.
BNZ’s Payap exemplifies defensive innovation, charging a sub-0.5% fee that undercuts card networks. Akahu offers payment initiation that bypasses schemes entirely, while Dosh migrates issuance to Pismo to gain speed and feature parity. Regulatory oversight remains intense as the Commerce Commission retains the power to cap fees and require access to essential infrastructure, limiting any player's ability to monopolize.
White-space opportunities include merchants with small baskets that cannot absorb 2% fees, rural operators seeking low-bandwidth solutions, and exporters needing real-time FX. The moderate fragmentation and steady consolidation around compliance-able incumbents shape a dynamic yet balanced New Zealand payments market.
New Zealand Payments Industry Leaders
-
Worldline New Zealand Limited
-
Fidelity National Information Services, Inc.
-
Visa Inc.
-
Mastercard Incorporated
-
American Express Company
- *Disclaimer: Major Players sorted in no particular order
Market Opportunities and Future Outlook
Lower acceptance-cost pathways and richer bank-to-bank capabilities create near-term whitespace around A2A checkout, recurring payments, and micro-merchant acceptance. BNZ’s Payap (QR-based A2A with a 0.39% merchant fee) highlights a concrete path for merchants who struggle with all-in card acceptance costs that still reach 1.5%-2.5% for smaller operators even after interchange caps. Regulated open banking going live on 1 December 2025 under the Customer and Product Data Act 2025, with nine third-party providers already live alongside ANZ, ASB, BNZ, Westpac, and Kiwibank, increases the pool of deployable payment initiation propositions for utilities, subscriptions, and ecommerce.
Ecommerce and cross-border flows support opportunities in wallets, FX transparency, and fraud controls. Digital wallets represented 29% of ecommerce transaction value in 2025, reinforcing demand for frictionless mobile checkout and software-based acceptance such as Tap to Pay on iPhone. Export-oriented SMEs provide a second evidence-backed pocket: Wise has quantified NZD 667 million in hidden FX spreads borne by New Zealand SMEs each year, underpinning demand for multi-currency accounts and transparent conversion by providers such as Airwallex and Revolut. On risk and trust, Payments NZ’s ongoing payments modernization roadmap work, including a digital identity opportunity assessment, aligns with 2026 trust-framework rule updates and supports solution development in onboarding, Confirmation of Payee, and scam-resistant payee verification as more volume moves to real-time and API-initiated rails.
Recent Industry Developments
- May 2026: Worldline divested its New Zealand payment activities to Cuscal Limited. The deal marks a change in ownership for a scaled in-store payments platform and reshapes acquiring and merchant services competition in New Zealand.
- April 2026: Visa launched its Visa Agentic Ready program in New Zealand, naming ANZ NZ, ASB Bank, Bank of New Zealand, and Kiwibank as initial partners. The program formalizes standards and controls for agent-initiated commerce and extends the payments stack beyond traditional app and browser checkout.
- November 2024: Apple launched Tap to Pay on iPhone in New Zealand, enabling merchants to accept contactless payments using an iPhone without additional hardware. This widened software-only acceptance for sole traders and micro-merchants and intensified competition with traditional terminal-rental models.
Research Methodology Framework and Report Scope
Market Definition and Coverage
For this study, the market covers the value of payment transactions in New Zealand across point of sale and online checkout, split by payment modes such as cards, account-to-account transfers, digital wallets, and cash-based options where applicable.
Scope exclusions: We do not count lending, insurance, or pure banking balance sheet products, and we also avoid double counting the same purchase across multiple payment steps (authorization, settlement, and reconciliation).
Segmentation Overview
- By Mode of Payment
- Point of Sale
- Debit Card Payments
- Credit Card Payments
- Account-to-Account (A2A) Payments
- Digital Wallet
- Cash
- Other Point-of-Sale Payment Mode
- Online Sale
- Debit Card Payments
- Credit Card Payments
- Account-to-Account (A2A) Payments
- Digital Wallet
- Cash-on-Delivery
- Other Online Sales Payment Mode
- Point of Sale
- By End-User Industry
- Retail
- Entertainment
- Hospitality
- Healthcare
- Other End-User Industries
Data Sources, Market Sizing, and Validation
Desk Research
Desk research helped us set the starting structure for the model, especially around how payment rails and instruments are classified in New Zealand and how usage trends are reported. We relied on public sources such as Reserve Bank of New Zealand statistics, Statistics New Zealand releases, New Zealand Government and regulator publications, and relevant international references such as BIS payment statistics and OECD digital economy indicators.
To connect those signals to what the market pays for and uses, we also reviewed company annual reports, investor decks, product disclosures, and reputable business press that discusses merchant acceptance, fee changes, and rollout timelines. Where needed, paid subscriptions for company financials and news were used to normalize disclosures and keep timelines consistent. The sources listed here are illustrative, and many other public references were also used for data collection, cross-checks, and clarification.
Primary Interviews and Surveys
Interviews and surveys with payment providers, banks, merchants, technology specialists, and managers in New Zealand help test channel mix, online and contactless adoption, average transaction values, fees, and unrecorded activity. We compare unusual responses with published New Zealand series, use the findings to address gaps, and triangulate assumptions used in the final analysis.
Distribution of primary research fieldwork respondents
| Company type | Respondent position |
|---|---|
| Top tier: 28% | CXOs: 15% |
| Mid tier: 47% | Functional/Unit leaders: 30% |
| Smaller Players: 25% | Managers: 55% |
Market-Sizing & Forecasting
The sizing logic starts from a top-down build where national payments activity is reconstructed by channel, first separating point of sale from online checkout, and then splitting value across payment modes that are visible in official reporting and industry disclosures. Those totals are then corroborated with selective bottom-up approximations, including sampled merchant category checks, observed adoption by acceptance type, and reasonableness tests using typical ticket sizes and transaction frequency.
Inputs that mattered most included card and non-card transaction growth, shifts in contactless and wallet usage, the pace of e-commerce share gains, interchange and merchant-service-fee related pricing pressure, and the rollout maturity of real-time or account-to-account payment options. When a data point was not directly available for a niche mode, we filled gaps using adjacent instrument shares and interview-based mix ranges, and then adjusted so the final picture still fits known totals.
For forecasting, scenario analysis was used, since the market is influenced by a few visible change factors that can move faster or slower depending on regulation and merchant adoption. The scenarios were tied to consensus ranges from primary respondents for adoption speed, channel mix changes, and pricing compression, and then translated into yearly values with simple curve-based progression to avoid unrealistic jumps.
Data Validation & Update Cycle
Validation is done through multiple checks, where model outputs are compared with independent signals such as channel mix indicators, instrument share trends, and published payment statistics that reflect overall activity. Outliers are reviewed at the assumption level, and when a movement cannot be explained by known drivers, we revisit the input series and re-check the logic with follow-up calls.
Before sign-off, the work is reviewed in steps so totals, splits, and growth rates align with the story told by public data and field feedback. Reports are refreshed annually, and interim updates are made when material events occur, such as a regulatory fee change or a major shift in payment acceptance. Right before delivery, we run a final update pass to ensure the latest public releases are reflected in the numbers.
Mordor Intelligence's Newzealand Payments Market Size Compared Against Other Published Estimates
Published market sizes for New Zealand payments often do not match because the scope can shift in small but meaningful ways, and the underlying transaction definitions are not always stated clearly. Differences typically come from what is treated as a payment transaction value, how POS versus online is handled, and whether cash-related modes are included consistently.
The main gap comes from mixing up payment value with revenue-like measures and from counting online commerce broadly without separating instrument-level splits, where Mordor Intelligence treats the market as transaction value across POS and online and then allocates it by payment mode using checkout mix signals and validation from merchant-side interviews.
Benchmark comparison
| Source | Market Size | Gaps in Research Methodology |
|---|---|---|
| Mordor Intelligence | USD 53.65 B (2026) | |
| Industry Association A | USD 49.20 B (2026) | Uses a narrower instrument lens that emphasizes card-led value and may under-allocate account-to-account and wallet-led checkout value, which can depress the total when channel mix is changing. |
| Trade Journal B | USD 58.80 B (2026) | Applies aggressive online growth and a higher average ticket assumption, and it can also include broader e-commerce spend that is not always aligned to payment instrument splits at checkout. |
The spread in the table is mainly explained by what is counted as transaction value versus a narrower subset, and by how quickly online and newer payment modes are assumed to expand. Our approach keeps the total traceable to channel totals and instrument mix checks, so the result can be reproduced and stress-tested when assumptions change.
Key Questions Answered in the Report
How large will electronic payments reach in New Zealand by 2031?
The New Zealand payments market is forecast to reach USD 123.36 billion by 2031, more than doubling the 2026 value.
Which segment is growing fastest within consumer payments?
Digital wallets lead with a 19.62% CAGR through 2031, driven by software-only acceptance and mobile-native consumers.
Why are interchange fees still a barrier despite regulatory caps?
Caps cut scheme fees, yet acquirer margins and terminal rental keep all-in costs near 2% for micro-merchants, limiting acceptance.
What impact will the real-time rail have on businesses?
Instant settlement is projected to save USD 60 million in float costs by 2027 and accelerate working-capital cycles.
Who benefits from transparent FX pricing?
Export-oriented SMEs in Canterbury and Otago save on hidden spreads by using platforms such as Wise, Airwallex, and Revolut.