
Market Overview
| Study Period | 2021 - 2031 |
|---|---|
| Forecast Data Period | 2026 - 2031 |
| Base Year Market Size (2025) | USD 13.72 Billion |
| Market Size (2026) | USD 14.64 Billion |
| Market Size (2031) | USD 20.27 Billion |
| Growth Rate (2026 - 2031) | 6.72 % |
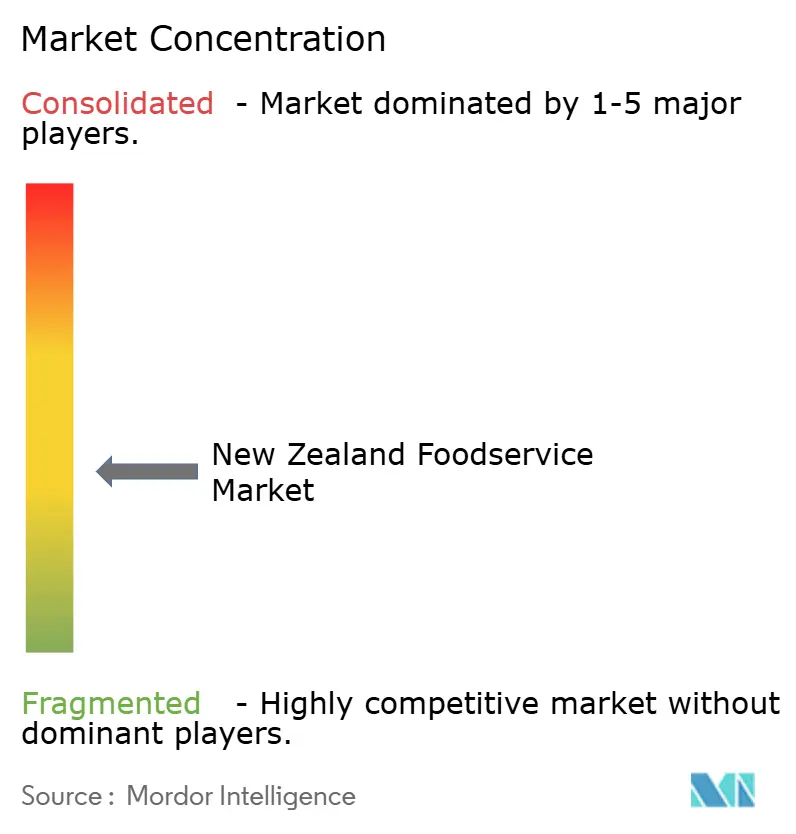
| Market Concentration | Medium |
Major Players *Disclaimer: Major Players sorted in no particular order Image © Mordor Intelligence. Reuse requires attribution under CC BY 4.0. | |
New Zealand Foodservice Market Analysis by Mordor Intelligence
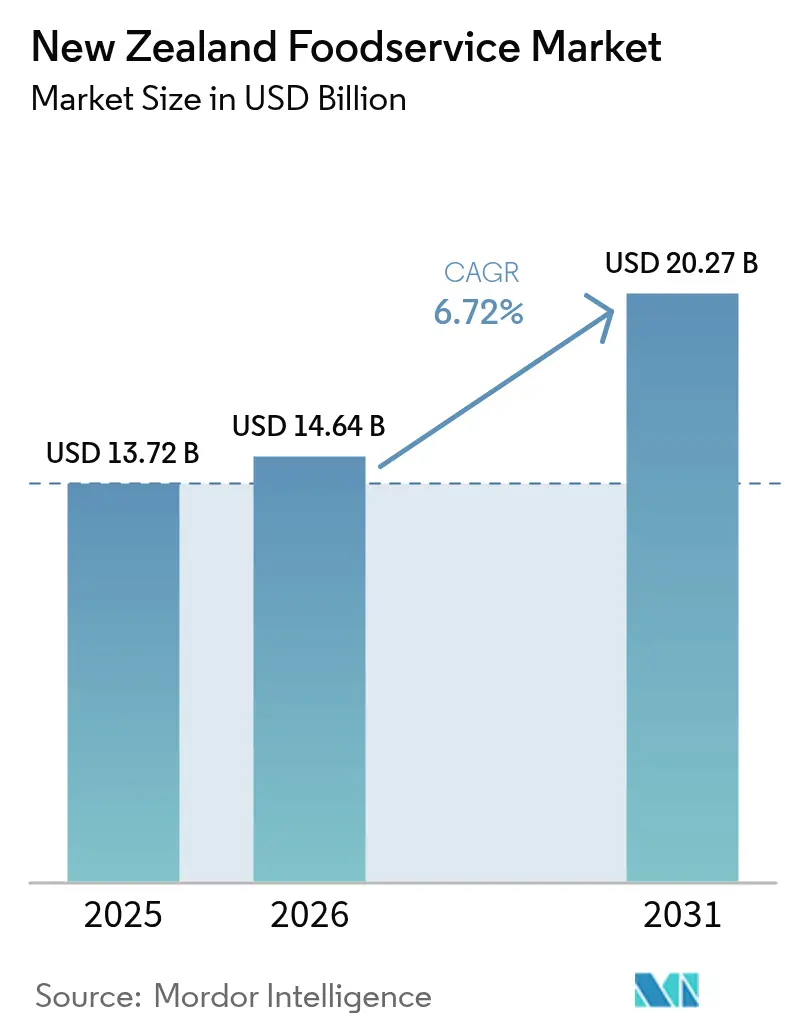
The New Zealand foodservice market size is projected to expand from USD 13.72 billion in 2025 and USD 14.64 billion in 2026 to USD 20.27 billion by 2031, registering a CAGR of 6.72% between 2026 to 2031. Demand is recovering on the back of resurgent tourism, a widening embrace of digital ordering, and consumers prioritizing convenience even as household budgets tighten. Chains are scaling faster than independents by leveraging franchise capital, data-driven menus, and supply-chain efficiencies, yet two-thirds of outlets remain owner-operated, preserving a vibrant entrepreneurial scene. Cloud kitchens continue to draw investment as operators seek lower fixed costs and hyper-local delivery reach. At the same time, experiential formats such as full-service restaurants benefit from pent-up social dining occasions, pointing to a bifurcated path where both low-touch and high-touch concepts coexist. Rising wage expectations, volatile food prices, and strict food-safety rules temper margins, encouraging automation pilots and collaborative purchasing among smaller operators.
Key Report Takeaways
- By foodservice type, full-service restaurants led with 37.91% revenue share in 2025, while cloud kitchens are forecast to expand at an 8.34% CAGR through 2031.
- By outlet, independent operators accounted for 67.93% of the New Zealand foodservice market share in 2025, whereas chained outlets are growing at a 7.65% CAGR to 2031.
- By location, standalone sites captured 80.77% of outlets in 2025; leisure venues are projected to grow at an 8.27% CAGR through 2031.
- By cuisine, North American concepts held 41.10% share in 2025, but Asian cuisine is advancing at an 8.79% CAGR to 2031.
Note: Market size and forecast figures in this report are generated using Mordor Intelligence’s proprietary estimation framework, updated with the latest available data and insights as of 2026.
Market Trends and Insights
Drivers Impact Analysis of New Zealand Foodservice Market*
| Driver | (~) % Impact on CAGR Forecast | Geographic Relevance | Impact Timeline |
|---|---|---|---|
| Growth in the tourism and hospitality market | +1.8% | National, concentrated in Auckland, Queenstown, Rotorua | Medium term (2-4 years) |
| Increasing consumer demand for convenience and dining out | +1.5% | National, urban centers leading | Short term (≤ 2 years) |
| Expansion of delivery services and digital ordering platforms | +1.2% | National, with rural penetration accelerating | Short term (≤ 2 years) |
| Transition to plant-based and health-focused menu options | +0.9% | National, Auckland and Wellington early adopters | Medium term (2-4 years) |
| Adoption of technology in restaurant operations | +0.7% | National, chains ahead of independents | Long term (≥ 4 years) |
| Emphasis on sustainability and local sourcing practices | +0.6% | National, compliance-driven in urban areas | Long term (≥ 4 years) |
| Source: Mordor Intelligence | |||
Growth in the tourism and hospitality market
Growth in tourism and hospitality is a significant factor driving demand within the foodservice market, as rising international arrivals directly increase footfall across hotels, cafés, quick-service restaurants, and casual dining outlets. Statistics New Zealand reported that overseas visitor arrivals reached 347,600 in November 2025, boosting occupancy rates and meal occasions in accommodation-linked foodservice formats [1]. This influx has elevated demand for premium breakfast options, grab-and-go meals, and experiential dining, particularly in key cities such as Auckland, Queenstown, and Christchurch. Hospitality operators are increasingly focusing on local sourcing, seasonal menus, and regional flavors to attract tourist spending and enhance destination experiences. Brands like BurgerFuel leverage high-traffic urban and airport locations to cater to international visitors seeking familiar yet locally adapted offerings. Similarly, café chains such as Coffee Club New Zealand capitalize on tourist-driven footfall in transport hubs and tourist precincts to drive sales of beverages and light meals. Hotels and resorts contribute by offering high-margin buffet concepts, room service, and curated dining experiences that extend visitor dwell time and spending. This interconnected growth across accommodation, travel retail, and dining formats strengthens overall foodservice activity, while inbound tourism recovery continues to support premiumization, menu innovation, and outlet expansion.
Increasing consumer demand for convenience and dining out
Consumer demand for convenience and dining out continues to drive growth in the foodservice market, supported by evolving lifestyles, extended working hours, and an increasing preference for ready-to-eat meals. According to the Restaurant Association of New Zealand (2024), households reported an average weekly expenditure of USD 162 on dining out, highlighting the shift of eating outside the home from an occasional indulgence to a routine behavior [2]. This trend fuels demand across quick-service restaurants, cafés, and casual dining formats that emphasize speed, affordability, and consistent quality. The adoption of digital ordering, takeaway, and delivery platforms further accelerates this shift by simplifying access to foodservice options. Brands such as Hell Pizza capitalize on this trend with strong delivery penetration and menu offerings designed for convenience-driven consumption, while café chains like Columbus Coffee benefit from high-frequency breakfast and snack occasions aligned with on-the-go lifestyles. The interplay of time constraints and rising disposable incomes supports repeat visits and higher transaction volumes, encouraging menu simplification and operational efficiency across outlets. These dynamics collectively position convenience-focused dining out as a sustained structural growth driver in the foodservice market.
Expansion of delivery services and digital ordering platforms
The growth of delivery services and digital ordering platforms is reshaping the foodservice industry in New Zealand by extending restaurant reach beyond physical locations and increasing order frequency through at-home consumption. In 2024, Uber Eats expanded to 12 new locations across Aotearoa, demonstrating confidence in sustained demand and advancements in last-mile infrastructure. This expansion enables both independent outlets and chains to access suburban and regional consumers without significant investment in new stores. Similarly, DoorDash continued its rollout across secondary cities in 2025, including Te Puke, Tokoroa, Whakatane, Hawera, Feilding, Levin, Masterton, Ashburton, Oamaru, and Wanaka, intensifying competition and encouraging multi-platform ordering behavior. These platforms also support menu digitization, targeted promotions, and data-driven demand forecasting, enhancing operational efficiency for restaurants. Brands such as St Pierre’s Sushi have leveraged these developments to achieve higher lunchtime penetration and offer bundled delivery formats aligned with convenience-driven consumption. Furthermore, the integration of loyalty programs and app-based discounts reinforces repeat ordering behavior. This evolving digital ecosystem aligns consumer expectations for convenience with restaurant scalability, fundamentally transforming how foodservice demand is generated and fulfilled across the country.
Transition to plant-based and health-focused menu options
The transition to plant-based and health-focused menu options is driven by increasing wellness awareness, dietary diversification, and multicultural consumption patterns. Statistics New Zealand (2024) highlights the country’s diverse population mix, including European/Other (65.9%), Asian (20.1%), Māori (17.4%), Pacific (9%), Indian (7%), and Chinese (6%) communities, which supports broader acceptance of vegetarian, vegan, flexitarian, and lighter global cuisines [3]. This demographic diversity encourages restaurants to integrate plant-forward dishes, dairy alternatives, and clean-label ingredients into mainstream menus rather than limiting them to niche offerings. Additionally, the demand for functional foods, allergen-friendly options, and nutrient-dense meals is reshaping offerings across cafés and casual dining establishments. Brands such as Lord of the Fries New Zealand leverage fully plant-based menus within fast-casual formats to attract younger, urban consumers, while Wise Boys Burgers appeals to ethical eaters and flexitarians with vegan comfort food. These strategies address consumer expectations for taste and convenience while promoting inclusivity. The convergence of wellness priorities and cultural diversity is structurally expanding the penetration of plant-based options across the foodservice market in New Zealand.
Restraints Impact Analysis of New Zealand Foodservice Market*
| Restraint | (~) % Impact on CAGR Forecast | Geographic Relevance | Impact Timeline |
|---|---|---|---|
| Compliance with stringent food safety regulations | -0.5% | National, enforcement stricter in urban centers | Long term (≥ 4 years) |
| Volatility in supply chains and rising food inflation | -1.2% | National, rural areas face longer lead times | Short term (≤ 2 years) |
| High commercial rents in prime business locations | -0.8% | Auckland, Wellington, Christchurch CBD and premium retail zones | Medium term (2-4 years) |
| Labor shortages are posing challenges to growth | -1.0% | National, acute in tourism-dependent regions (Queenstown, Rotorua) | Short term (≤ 2 years) |
| Source: Mordor Intelligence | |||
Compliance with stringent food safety regulations
Stringent food safety regulations present a significant challenge for the foodservice industry in New Zealand, increasing operational complexity and compliance costs across restaurant formats. The regulatory framework has intensified with the introduction of mandatory allergen labeling protocols, effective February 25, 2024, which require menu audits, recipe standardization, and staff retraining. These requirements place a heavier burden on independent cafés and small operators with limited compliance infrastructure, slowing menu innovation and rollout timelines. Larger chains are better positioned to manage these demands, but still face increased documentation and verification costs across outlets. For example, McDonald’s New Zealand, as of November 2025, has invested in centralized allergen management systems to ensure consistency and regulatory compliance across its national menus. However, even established operators must frequently update digital and in-store disclosures to remain compliant. This compliance burden extends time-to-market for new products, raises back-end operational costs, and creates significant entry barriers for new entrants. Collectively, these factors limit agility and constrain margin expansion across the industry.
Volatility in supply chains and rising food inflation
Supply chain volatility and rising food inflation present significant challenges by increasing procurement uncertainty and compressing operator margins. Disruptions in imported ingredients, packaging materials, and freight logistics elevate input costs and undermine price stability for restaurants and foodservice distributors. These pressures force operators to either absorb cost increases or transfer them to consumers, potentially affecting demand in value-sensitive segments. Strategies such as menu rationalization and portion resizing are increasingly employed to manage cost fluctuations while preserving perceived value. Smaller independent outlets are particularly at risk due to limited supplier diversification and weaker bargaining power. In response, larger brands like Restaurant Brands New Zealand (KFC, Taco Bell) implement centralized sourcing, long-term supplier contracts, and menu engineering to safeguard margins. However, even scaled chains encounter pricing delays and operational strain during commodity price fluctuations, complicating forecasting, inventory planning, and promotional strategies. Collectively, rising food inflation and unstable supply chains constrain profitability and strategic flexibility across the foodservice market.
*Our forecasts treat driver/restraint impacts as directional, not additive. The impact forecasts reflect baseline growth, mix effects, and variable interactions.
New Zealand Foodservice Market Segment Analysis
By Foodservice Type:
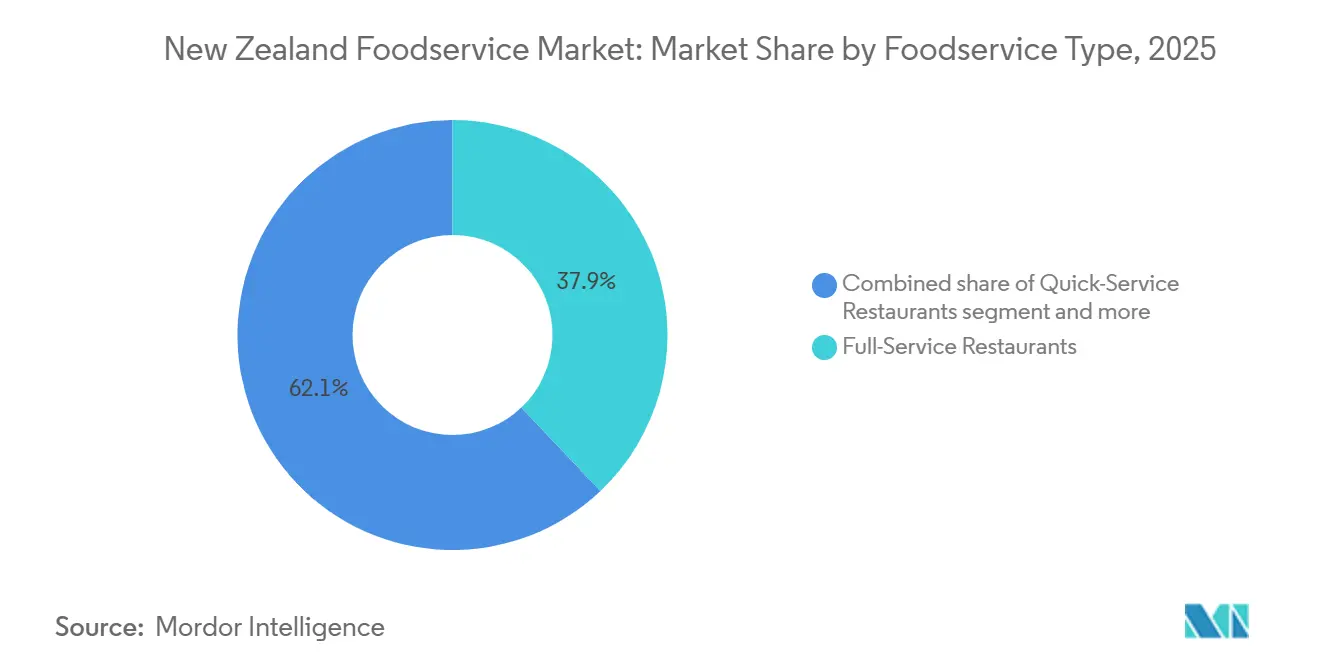
Cloud Kitchens Outpace Traditional FormatsFull-service restaurants are expected to account for 37.91% of the foodservice market share in 2025, supported by experiential dining, table service, and alcohol-led occasions that drive higher per-check averages and extended customer dwell times. These establishments benefit from the recovery of tourism and the growing preference for social dining, which sustains demand for premium menus and curated in-store experiences. To remain competitive against digitally native operators, many are retrofitting kitchens to meet off-premise demand. For example, SkyCity Restaurants Auckland leverages destination dining and beverage-led revenue streams while expanding takeaway and delivery-compatible menu options. This shift underscores the evolution of experiential dining beyond physical premises. As delivery demand increases, full-service formats are integrating cloud-style workflows to strengthen their omnichannel presence while maintaining high-margin dine-in occasions.
Cloud kitchens, with a projected CAGR of 8.34% through 2031, represent the fastest-growing foodservice format due to their asset-light models, rapid brand testing capabilities, and delivery-first infrastructure. These formats benefit from platform-driven demand and lower real estate costs but lack the experiential elements that build brand loyalty. Quick-service restaurants, such as Domino’s New Zealand, utilize drive-thru services and strong brand recognition but face margin pressures from third-party delivery commissions. Independently operated cafés and bars continue to encounter challenges related to labor intensity and limited scalability. In response, some cloud kitchen operators are testing dine-in pop-ups to enhance brand recognition and explore physical formats. These trends highlight a convergence between traditional and virtual foodservice models rather than a complete shift in the market.

By Outlet:
Chains Gain Ground Through Franchise AccelerationIndependent outlets are expected to hold a 67.93% market share by 2025, reflecting the entrepreneurial culture and consumer demand for authentic, locally inspired dining experiences. These operators excel in customizing menus to regional preferences, exploring niche cuisines, and delivering personalized service that fosters customer loyalty. However, smaller operators face challenges such as scaling operations, ensuring consistent quality, and expanding marketing reach. Fidel’s Café in Wellington serves as an example of how independent businesses leverage local identity and uniqueness to attract repeat customers while maintaining strong community ties. To remain competitive, independent outlets must increasingly adopt digital ordering and delivery solutions to address evolving consumer expectations and the growing presence of chains.
Chained outlets are projected to grow at a compound annual growth rate (CAGR) of 7.65% through 2031, driven by franchise models that reduce capital investment and operational risks while enabling rapid market expansion. Franchising supports scalability by enhancing brand recognition, standardizing processes, and securing supplier agreements. Quick-service brands like Hell Pizza New Zealand demonstrate the effectiveness of this approach, combining national reach with local partnerships to ensure menu consistency and delivery efficiency. While chains focus on high-traffic urban and suburban areas, independents retain their niche and neighborhood presence, fostering a balanced foodservice ecosystem where innovation and accessibility coexist.
By Location:
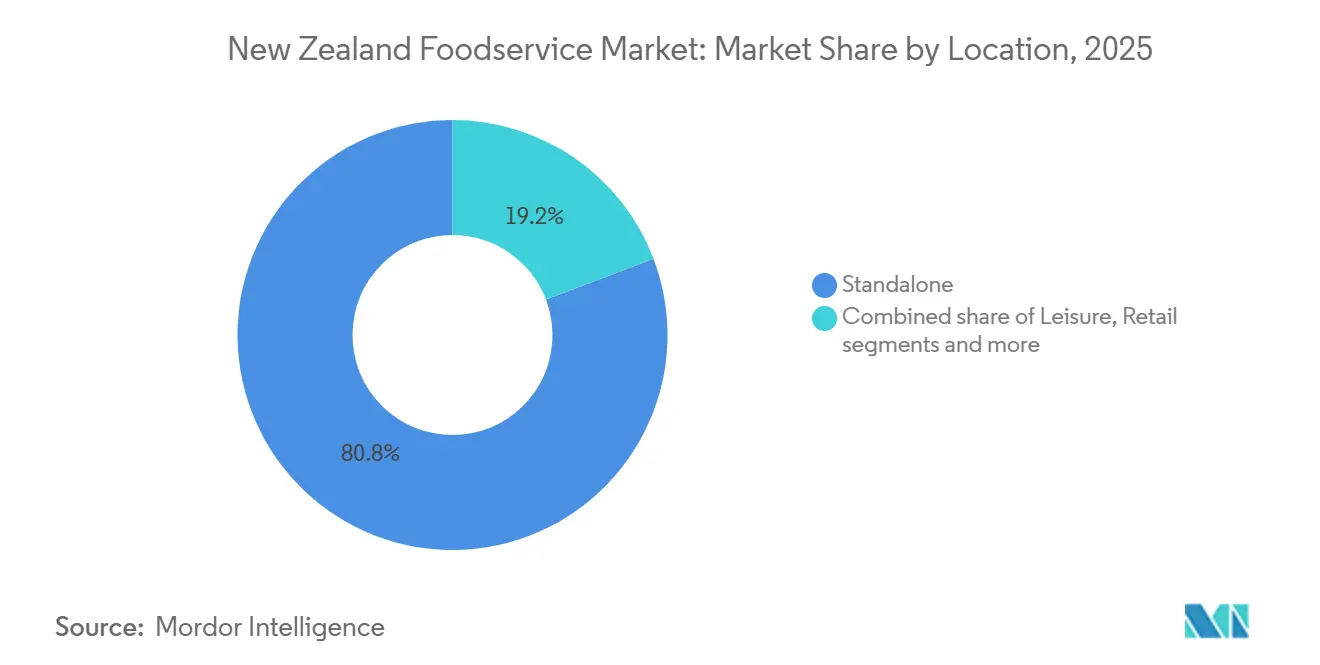
Leisure Venues Emerge as High-Margin ChannelsStandalone outlets continue to play a significant role in the foodservice industry, projected to account for 80.77% of locations by 2025. These outlets benefit from cost efficiencies such as lower rent, convenient parking, and operational flexibility. Their format allows operators to innovate with menu offerings, expand delivery or drive-thru services, and cater to local and commuter traffic without the constraints of embedded commercial spaces. Brands like BurgerFuel leverage standalone sites to provide both dine-in and takeaway options while integrating delivery-only kitchens to enhance revenue streams. The rise of hybrid models underscores the importance of diversifying income sources to remain competitive, while sustainability initiatives, including certifications and eco-friendly practices, are becoming critical for differentiation.
Leisure venues, including shopping malls, sports stadiums, and entertainment complexes, are emerging as high-margin channels, with an anticipated CAGR of 8.27% through 2031. These venues benefit from steady foot traffic and extended operating hours. Retail outlets in malls capitalize on impulse purchases but face challenges such as rent escalations tied to turnover clauses. Travel hubs like Auckland Airport generate higher transaction values due to limited alternatives and time constraints. Operators in these venues are also addressing sustainability requirements, balancing compliance costs with opportunities for brand differentiation, as highlighted by the Ministry for Primary Industries’ environmental report. Together, these trends reflect strategic shifts in the foodservice landscape.
By Cuisine Type:
Asian Flavors Ride Demographic TailwindsIn 2025, North American cuisine held a 41.10% market share, led by brands such as McDonald's, KFC, Burger King, and Domino's. These companies deliver familiar comfort foods through efficient drive-thrus, app-based ordering, and value menus that resonate with diverse demographics in urban and suburban areas. Their emphasis on speed and consistency ensures that busy families, office workers, and tourists can rely on portable options like burgers, fried chicken, and pizzas without deviations in flavor or service quality. The scale of these brands supports aggressive promotions and loyalty programs, driving repeat visits, while shared supply chains help maintain competitive costs despite rising ingredient prices. These outlets often serve as key anchors in shopping centers and highways, indirectly supporting other cuisines by attracting foot traffic to mixed-use precincts. Their operational efficiency sets a benchmark for emerging segments aiming to establish a foothold in the market.
Asian cuisine is projected to grow at a compound annual growth rate (CAGR) of 8.79% through 2031, the fastest among all cuisine types. This growth is fueled by demographic shifts, with Stats NZ forecasting the Asian population to rise from 19% in 2023 to 33% by 2048. Demand for authentic ramen houses, sushi bars, and curry restaurants is increasing, with operators like Noodle Canteen adapting spice levels and portion sizes to local preferences while introducing fusion dishes. High-density areas such as Auckland and Christchurch are particularly conducive to scalable Asian dining concepts. Moreover, compliance with the Ministry for Primary Industries' Food Act 2014 enhances consumer trust through allergen labeling, enabling gluten-free and nut-free claims. By aligning population growth, regulatory compliance, and menu innovation, Asian cuisine is positioned for sustained high growth.
Geography Analysis
Significant regional differences characterize New Zealand's foodservice market, influenced by population density, tourism activity, and infrastructure investments. Auckland, with 1.8 million residents in 2024 and the nation’s busiest airport, is projected to lead national foodservice revenue in 2025. This leadership is driven by corporate dining, international tourism, and a diverse population supporting a variety of cuisines, including Asian, European, and Middle Eastern (Stats NZ). Restaurant Brands New Zealand’s KFC division, with half its outlets in Auckland, benefits from high foot traffic, dense delivery networks, and urban convenience. Additionally, Auckland’s scale supports premium, experience-focused offerings that integrate dine-in, takeaway, and delivery models to meet diverse consumer needs.
Infrastructure and redevelopment play a pivotal role in shaping foodservice dynamics in Wellington and Christchurch. Wellington’s market is anchored by government institutions and professional services, creating demand for lunch-centric cafés and full-service restaurants. The city’s predictable traffic patterns and repeat visitation favor smaller, high-frequency operators. Meanwhile, Christchurch faces challenges such as rising rents in prime retail areas, a lingering effect of the 2011 earthquake. However, the opening of the One New Zealand Stadium in April 2026, with over 200 annual events and 3,200 premium hospitality seats, is expected to create a high-margin, event-driven channel, benefiting operators capable of scaling for demand spikes.
Tourism-focused regions like Queenstown generate higher per-occasion spending from international visitors but face seasonal volatility between winter ski and summer low periods, complicating cash flow management. Regional towns such as Rotorua, Taupo, and Napier rely on domestic tourism and retiree populations, supporting independent cafés and family-style restaurants while limiting chain expansion opportunities. Delivery platforms like DoorDash expanded into rural towns, including Tokoroa, Oamaru, and Wānaka, during 2024–2025 to capture incremental volume. However, lower order density in these areas increases per-delivery costs and compresses margins, emphasizing the need for location-specific strategies across New Zealand’s foodservice ecosystem.
Regulatory Landscape
Foodservice operators in New Zealand are primarily governed by the Ministry for Primary Industries (MPI) under the Food Act 2014 and its risk-based compliance system. Most businesses are required to operate under either a Food Control Plan or National Programme requirements, alongside local council verification. Food composition and labelling align with the Australia New Zealand food regulatory system through Food Standards Australia New Zealand (FSANZ) and the Australia New Zealand Food Standards Code, while operators still need to meet MPI-administered domestic hygiene and safety obligations.
Recent regulatory updates have reinforced both compliance depth and cost recovery. MPI updated National Programme guidance in December 2025, including strengthened expectations around water quality, allergen labelling, and mock recall procedures. In July 2025, MPI began phasing in a Domestic Food Business Levy (NZD 57.50 to NZD 115 per site annually) alongside a Food Importer Levy. In June 2026, MPI published updated requirements for High Regulatory Interest (HRI) food imports and importer registration protocols, which increases the importance of importer assurance documentation and traceability for operators relying on imported inputs.
Competitive Landscape
The New Zealand foodservice market demonstrates moderate fragmentation, with independent operators outnumbering chains by a ratio of 2-to-1. However, chains capture a larger share of revenue due to their scale efficiencies, standardized operations, and strong brand recognition. This dynamic enables large players to dominate high-traffic urban areas, delivery platforms, and travel locations, while independent operators maintain strength in neighborhood dining and niche cuisines. Chains benefit from centralized procurement, marketing scale, and menu engineering, which help sustain margins despite rising costs. For instance, McDonald’s Corporation leverages drive-thru infrastructure and omnichannel ordering systems to convert foot traffic into high transaction volumes. This combination of outlet-level fragmentation and revenue concentration among scaled operators creates a hybrid competitive structure rather than a monopolized market.
Restaurant Brands New Zealand Ltd plays a significant role in the market by operating brands such as KFC, Pizza Hut, Taco Bell, and Carl’s Jr. The company employs a multi-brand strategy to optimize real estate use and supply chain efficiencies. This approach enables cross-brand learnings in areas such as delivery, value menus, and franchise development, reinforcing its dominance in the quick-service restaurant (QSR) segment. Similarly, Domino’s leverages digital-first ordering systems and a dense store network to enhance speed, consistency, and consumption frequency. These chains outperform independent operators in suburban and delivery-heavy areas, where convenience and price sensitivity are critical. However, independents remain competitive through menu innovation, community engagement, and experiential differentiation, sustaining moderate market concentration rather than consolidation-driven dominance.
BurgerFuel strengthens its market position through a premium fast-casual approach and strong local brand equity, appealing to urban consumers seeking unique burger offerings beyond global QSR formats. Starbucks capitalizes on international brand recognition and standardized café experiences to attract customers in commuter hubs, malls, and travel locations. Both global and domestic chains benefit from loyalty programs, consistent store designs, and digital integration, enabling them to drive repeat consumption more effectively than most independent operators. Despite this, independent cafés and restaurants continue to outnumber chains and play a vital role in shaping local dining culture, particularly in suburban and regional markets. This dual structure fosters competitive tension between the efficiency of scaled operators and the authenticity of independent establishments, leaving New Zealand’s foodservice market structurally fragmented but commercially skewed toward branded operators.
New Zealand Foodservice Industry Leaders
-
Restaurant Brands NZ Ltd
-
McDonald’s Corporation
-
Domino’s Pizza Inc
-
BurgerFuel Group Ltd
-
Starbucks Corporation
- *Disclaimer: Major Players sorted in no particular order
New Zealand Foodservice Market Companies Covered in this Report
- Restaurant Brands New Zealand Limited.
- McDonald's Corporation
- BurgerFuel Group Ltd
- Domino's Pizza, Inc.
- Starbucks Corporation
- Subway (Doctor's Associates Inc.)
- Inspire Brands Inc.
- Burger Wisconsin
- Columbus Coffee
- Hell Pizza
- The Coffee Club New Zealand
- Burger King NZ (Antares Restaurant Grp)
- Wendy's Hamburgers NZ
- St Pierre's Sushi
- Pita Pit New Zealand
- Mexicali Fresh
- Duck Donuts
- Mad Mex Fresh Mexican Grill
- The Kitchen Collective
- Coffee Culture
Market Opportunities and Future Outlook
Digital-first foodservice models continue to create room for operators to expand beyond high-rent CBD footprints while maintaining compliance and food quality. Delivery platform expansion into additional New Zealand locations and secondary towns supports multi-site virtual brands and cloud-kitchen style production. At the same time, the Ministry for Primary Industries updated guidance on allergen labelling and National Programme controls, which increases demand for standardized recipes, menu governance, and integrated ordering-to-label workflows that can reduce compliance friction across outlets.
Supply availability and product innovation opportunities are also shaped by upstream investment feeding foodservice menus. In April 2026, Fonterra commenced construction of a NZD 35 million pastry butter sheet expansion at its Edgecumbe site, and in June 2026 Olam Food Ingredients completed a new spray dryer installation in Tokoroa, with processing scheduled to begin in August 2026. This adds capacity relevant to bakery, dessert, beverage, and ingredient-heavy menus. On the policy side, the New Zealand Government opened an expression-of-interest process in March 2026 for a 12-month digital labelling trial for pre-packaged imported foods, while in June 2026 it reported food and fibre export revenue forecast at a record NZD 64.3 billion for the year ending 30 June 2026, reinforcing the role of New Zealand-produced ingredients in premium and tourist-facing menu propositions.
Recent Industry Developments in New Zealand Foodservice Market
- May 2026: BurgerFuel Group Ltd released its preliminary full-year results for the year ended 31 March 2026, highlighting New Zealand system-wide sales of NZD 108 million and outlining continued investment in growth initiatives. The update also referenced strengthening direct digital capability via an internal online ordering platform, supporting customer data ownership and reducing reliance on third-party marketplaces.
- March 2025: Duck Donuts entered a master franchise agreement to expand into New Zealand with franchise partners Martin and Anita van der Velden. The deal signaled continued inbound interest from US cafe and QSR concepts, adding competitive pressure in coffee and sweet-baked categories where menu novelty and brand storytelling influence foot traffic.
- April 2024: Soul Origin opened its third New Zealand restaurant at Auckland International Airport, expanding its footprint in a high-traffic travel hub. The move underscored the attractiveness of captive, convenience-led locations for brands positioned around quick service and healthier grab-and-go food.
New Zealand Foodservice Market Report Scope and Research Methodology
Market Definition and Coverage
For this study, the New Zealand foodservice market covers the value of meals and beverages prepared for out-of-home consumption, including dine-in, takeaway, and delivery across commercial foodservice outlets in the country.
Scope exclusions: Home-cooked meals and grocery retail food sales are excluded unless the purchase is clearly a prepared, ready-to-eat offering sold through a foodservice-style counter.
Segments Covered in This Report
- By Foodservice Type
- Full-Service Restaurants
- Quick-Service Restaurants
- Cloud Kitchens
- Cafés and Bars
- By Outlet
- Chained Outlets
- Independent Outlets
- By Location
- Standalone
- Leisure
- Retail
- Lodging
- Travel
- By Cuisine Type
- Asian
- European
- Latin American
- Middle Eastern
- North American
- Other Cuisines
Data Sources, Market Sizing, and Validation
Desk Research
Desk research was used to build the base structure of the market and to align the demand signals with real-world operating conditions in New Zealand. We referenced public sources such as Statistics New Zealand releases on household spend and industry output, Ministry for Primary Industries updates that influence food safety compliance costs, and Tourism New Zealand indicators that track visitor flows and seasonality.
To keep assumptions grounded, additional desk inputs were taken from sources such as New Zealand Customs and trade statistics for key food and beverage inflows, Reserve Bank of New Zealand inflation and interest rate context, and peer-reviewed nutrition and hospitality studies that explain eating-out behavior. Company annual reports, investor materials, and reputable press coverage helped confirm outlet expansion plans and pricing moves, while approved paid subscriptions were used selectively for company financials and patent trend checks. These examples are not exhaustive, and many other public and paid sources were also reviewed for collection, cross-checking, and clarification.
Primary Interviews and Surveys
We use interviews and surveys with New Zealand foodservice operators, channel specialists, suppliers, and finance or operations leaders. Responses help verify sales mix, average checks, outlet productivity, delivery use, menu-price changes, and assumptions where public series are incomplete. Findings are compared with desk data, and material differences are rechecked before the model is finalized.
Distribution of primary research fieldwork respondents
| Company type | Respondent position |
|---|---|
| Top tier: 29% | CXOs: 15% |
| Mid tier: 46% | Functional/Unit leaders: 30% |
| Smaller Players: 25% | Managers: 55% |
Market-Sizing & Forecasting
Sizing was built using a top-down demand reconstruction where national eating-out expenditure signals are translated into foodservice revenue after adjusting for channel mix and tax-inclusive selling practices. Where the data trail becomes less direct, results are then corroborated with selective bottom-up approximations such as sampled outlet counts by format, average ticket size, and transaction frequency checks from interviews.
Inputs that materially shape the model include changes in international visitor arrivals, real household disposable income trends, menu price inflation, delivery and takeaway penetration, and outlet growth in key foodservice formats. When the main clause is needed, it comes from aligning these indicators to observed seasonality patterns and known peak periods, and then narrowing the totals to revenue that is clearly attributable to foodservice operators.
For forecasting, we used scenario analysis supported by simple regression relationships between demand drivers (tourism and income) and spend per capita, which were refined through what operators said about footfall, staffing constraints, and price pass-through. Gaps in the secondary trail were handled by applying conservative range assumptions for emerging formats (like delivery-first outlets) and then stress-testing them against the overall spend pool so the totals stayed realistic.
Data Validation & Update Cycle
Validation is done through triangulation across independent signals, followed by variance checks at each step where spend, pricing, and channel splits can drift. We compare totals against macro measures like consumer spend direction and tourism activity, and then review outliers such as sudden jumps in average ticket size or unusually fast outlet growth.
Before sign-off, the model goes through multi-step analyst reviews, and we re-contact selected respondents when assumptions move outside a reasonable band. Reports are refreshed annually, and interim updates are triggered when material events occur, such as sharp inflation shifts, regulatory changes, or demand shocks. Right before delivery, a final pass is completed so clients receive the latest updated view.
Mordor Intelligence's Newzealand Foodservice Market Size Measured Against Other Published Estimates
Published market sizes for New Zealand foodservice can look far apart because each publisher draws the market edge differently, and they also pick different base years and inflation treatment. Differences often come from what is counted as foodservice revenue, which selling channels are included, and how delivery-first operators are treated.
The main gap comes from whether institutional and corporate catering, as well as broader HRI sales proxies, are blended into the number, where Mordor Intelligence counts only consumer-facing foodservice formats and ties the value to out-of-home meal occasions, ticket sizes, and channel mix checks rather than wider hospitality turnover.
Benchmark comparison
| Source | Market Size | Gaps in Research Methodology |
|---|---|---|
| Mordor Intelligence | USD 13.72 B (2025) | |
| Government Briefing A | USD 9.82 B (2024) | This figure is presented as food service sales and is tied to an HRI style view, which can mix broader hospitality and channel constructs and may not map cleanly to consumer foodservice revenue only. It also reflects a different year and can embed a different inflation and currency timing than a forward base year. |
| Global Publisher B | USD 9.00 B (2024) | The estimate uses a smaller 2024 base and a different forecast window, and it is not always clear how delivery-only outlets and independent operators are captured versus chained outlets. Differences in tax handling and average price progression assumptions can also compress the total versus a spend-pool aligned model. |
The spread across the three numbers is mostly explained by scope and timing, and then by how pricing and channel mix are pushed through the forecast. Our approach stays traceable because each step is linked to observable demand drivers, and adjustments are only made when they are supported by interview validation and cross-check metrics.
Key Questions Answered in the Report
How large will the New Zealand foodservice market be by 2031?
It is forecast to reach USD 20.27 billion by 2031 on a 6.72% CAGR trajectory.
Which segment is growing quickest within the sector?
Cloud kitchens lead with an 8.34% CAGR expected through 2031 as operators chase low-capital, delivery-first models.
Why are leisure venues attracting foodservice operators?
New stadiums and malls offer captive foot traffic and higher margins, prompting an 8.27% CAGR for leisure-located outlets.
What role do delivery platforms play in rural New Zealand?
Providers such as DoorDash expanded into towns like Tokoroa and Wānaka, albeit at higher per-delivery costs due to sparse order density.