
Market Overview
| Study Period | 2020 - 2031 |
|---|---|
| Forecast Data Period | 2026 - 2031 |
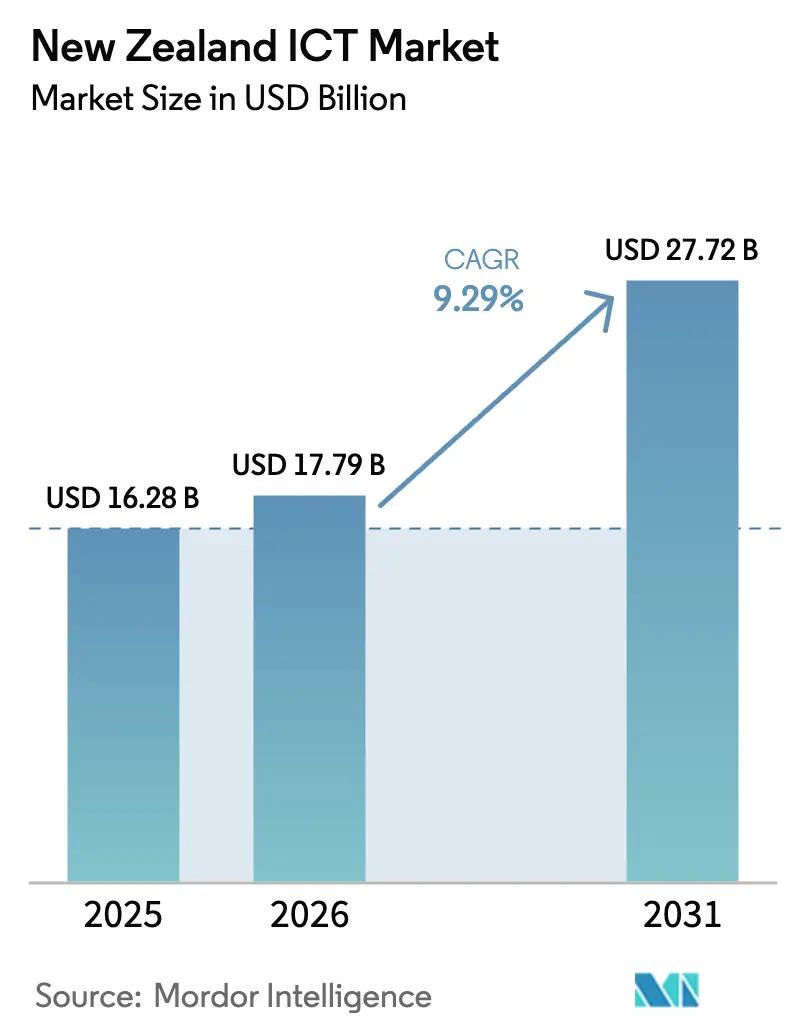
| Base Year Market Size (2025) | USD 16.28 Billion |
| Market Size (2026) | USD 17.79 Billion |
| Market Size (2031) | USD 27.72 Billion |
| Growth Rate (2026 - 2031) | 9.29 % |
| Market Concentration | Medium |
Major Players *Disclaimer: Major Players sorted in no particular order Image © Mordor Intelligence. Reuse requires attribution under CC BY 4.0. | |
New Zealand ICT Market Analysis by Mordor Intelligence
The New Zealand ICT market size is expected to grow from USD 16.28 billion in 2025 to USD 17.79 billion in 2026 and is forecast to reach USD 27.72 billion by 2031 at 9.29% CAGR over 2026-2031. Continuous public-sector digitization, rapid cloud-region rollouts and accelerating enterprise demand for artificial intelligence are the primary engines behind this expansion. Large-scale infrastructure investments by Microsoft, AWS and Google have materially lowered latency and data-residency concerns, spurring organizations to migrate complex workloads. Enterprises are simultaneously adopting renewable-powered data-center capacity to satisfy environmental targets, while Māori data-sovereignty requirements encourage hybrid deployment models that keep sensitive datasets onshore. Skills shortages and escalating cyber threats temper the growth outlook, yet sustained government funding for e-government, digital health and rural connectivity keeps the New Zealand ICT market firmly on an upward trajectory.[1]
Key Report Takeaways
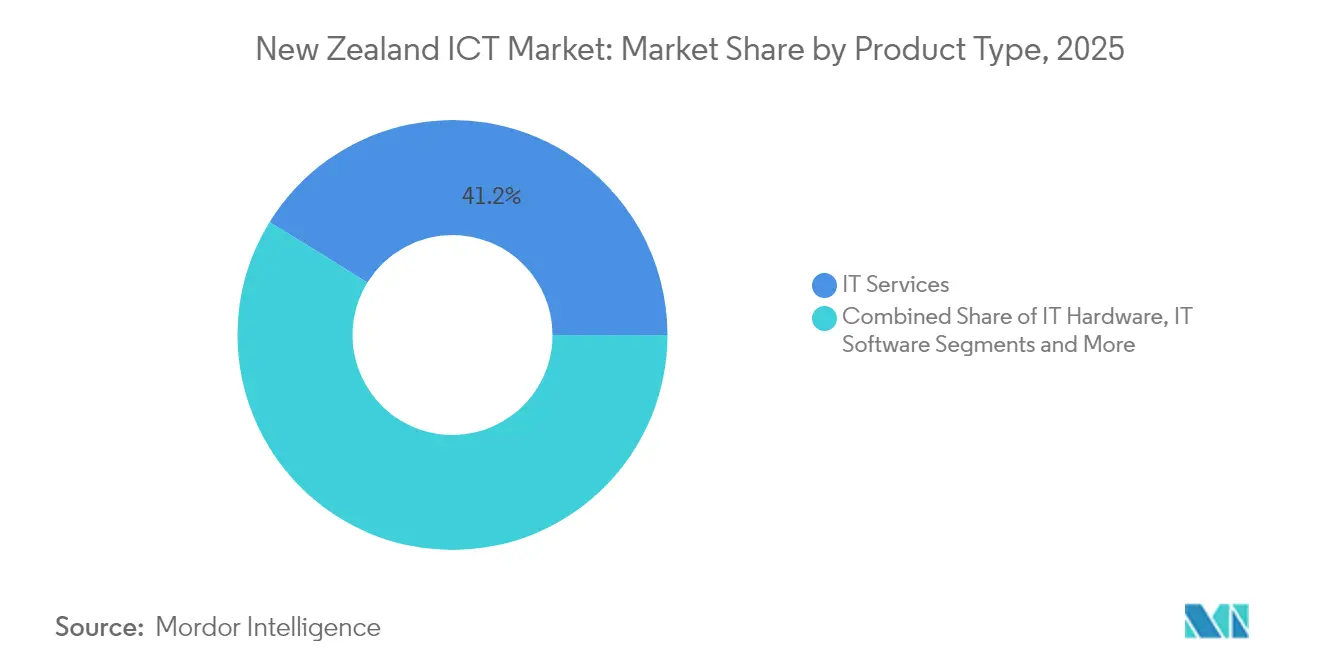
- By product type, IT Services led with 41.19% revenue share in 2025, whereas IT Security is on track for the fastest 9.55% CAGR through 2031.
- By enterprise size, Large Enterprises captured 61.94% of the New Zealand ICT market share in 2025; SMEs are expanding at a 10.05% CAGR through 2031.
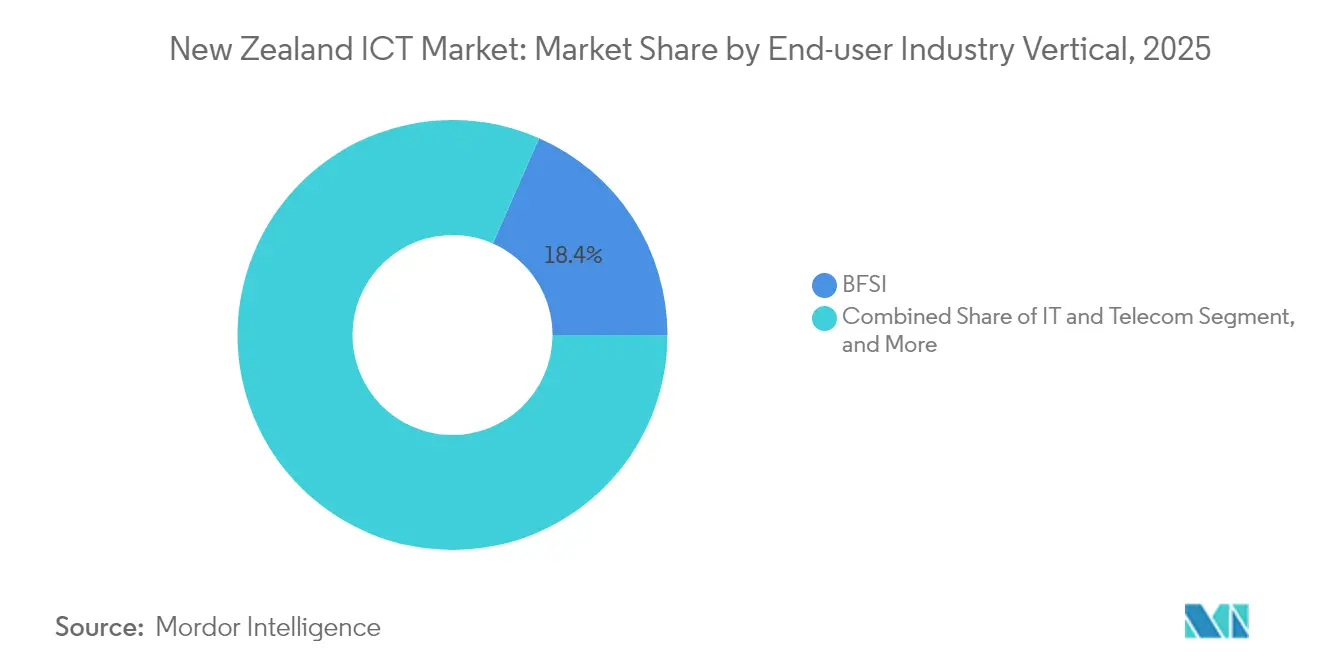
- By end-user industry, BFSI accounted for 18.40% of 2025 revenue, yet healthcare and life sciences are advancing at a 10.55% CAGR through 2031.
Note: Market size and forecast figures in this report are generated using Mordor Intelligence’s proprietary estimation framework, updated with the latest available data and insights as of 2026.
New Zealand ICT Market Trends and Insights
Drivers Impact Analysis*
| Driver | (~) % Impact on CAGR Forecast | Geographic Relevance | Impact Timeline |
|---|---|---|---|
| Robust growth of technology exports | +1.8% | National – Auckland and Wellington clusters | Medium term (2-4 years) |
| Hyperscale cloud-region investments | +2.1% | National – primary DCs in Auckland | Short term (≤ 2 years) |
| Government spending on e-health and e-gov | +1.5% | National – early rollouts in urban centers | Medium term (2-4 years) |
| Rapid adoption of AI-ML solutions | +1.9% | National – BFSI and manufacturing leaders | Short term (≤ 2 years) |
| Renewable-powered data centers | +1.2% | National – renewables-rich regions | Long term (≥ 4 years) |
| Māori data-sovereignty initiatives | +0.9% | National – government and research sectors | Medium term (2-4 years) |
| Source: Mordor Intelligence | |||
Government Investments Drive Digital Infrastructure Modernization
Public-sector digital programs continue to steer capital toward cloud, cybersecurity and digital-health platforms. The Ministry of Business, Innovation and Employment allocated NZD 50 million (USD 29.23 million) over four years to reinforce national cyber-defense and to modernize e-government services. Simpler vendor-qualification pathways now allow SME tech providers faster entry into public contracts, boosting competitive intensity across the New Zealand ICT market.[2] In parallel, Treaty of Waitangi-aligned procurement policies stimulate demand for culturally appropriate technology solutions, differentiating this landscape from other developed economies. Government endorsements also catalyze private investment: Te Tumu Paeroa’s role as anchor tenant for Microsoft’s local cloud region validated hyperscale commitments and encouraged further data-center builds.[3]
Hyperscale Cloud Investments Accelerate Enterprise Adoption
Combined deployments by Microsoft, AWS and Google are redefining infrastructure baselines, enabling enterprises to decommission legacy on-premise hardware. Local availability zones slash latency, satisfy privacy legislation and support the New Zealand ICT market’s migration to software-as-a-service. Satellite connectivity via AWS Project Kuiper expands broadband reach to rural enterprises, promoting inclusive cloud uptake. Submarine-cable partnerships such as Google-Vocus reinforce trans-Tasman bandwidth, ensuring that the virtuous cycle of adoption and reinvestment continues.
AI-ML Adoption Transforms Sector Operations
Enterprises are mainstreaming artificial intelligence, moving from experimental pilots to production-grade deployments that deliver measurable returns. Spark New Zealand and Infosys co-developed AI tools for network optimization and customer-service automation, while the operator’s IoT platform surpassed 2 million connected devices, driving 53.3% high-tech revenue growth. Financial institutions rely on machine learning for fraud detection; manufacturers adopt predictive-maintenance algorithms to minimize downtime; and the gaming sector leverages AI to personalize player experiences, underpinning its NZD 548 million (USD 320.38 million) export ambition. Government guidelines on responsible AI cap compliance risk and shape vendor choice, reinforcing best-practice standards across the New Zealand ICT market.
Renewable Energy Integration Attracts ESG-Focused Workloads
Eco-conscious enterprises prefer colocating workloads in data centers powered by clean energy. Spark New Zealand signed a 10-year power-purchase agreement for 63 MW of solar output that will cover roughly 60% of its electricity needs from 2025, while One New Zealand pledged 100% renewable supply. NEXTDC and T4 Group market green-data-center footprints to international clients pursuing scope-3 emissions cuts. These commitments bolster New Zealand’s appeal as an ESG-compliant digital hub and enrich the New Zealand ICT market with premium, sustainability-aligned demand.
Restraints Impact Analysis*
| Restraint | (~) % Impact on CAGR Forecast | Geographic Relevance | Impact Timeline |
|---|---|---|---|
| Skills gap for ICT professionals | −1.4% | National – acute in Auckland and Wellington | Short term (≤ 2 years) |
| Escalating cybersecurity threats | −1.1% | National – heavier burden on SMEs | Short term (≤ 2 years) |
| Power-grid capacity constraints | −0.8% | Regional – Auckland and Canterbury | Medium term (2-4 years) |
| Complex public-procurement cycles | −0.6% | National – gradual improvement | Medium term (2-4 years) |
| Source: Mordor Intelligence | |||
ICT Skills Shortage Constrains Expansion
Persistent shortages in cloud-architecture, cybersecurity and AI engineering talent limit the pace at which enterprises can implement new platforms. Kordia’s 2025 security survey showed 67% of firms had not conducted penetration testing in the previous year, revealing both capability and resourcing gaps. Spark responded by launching Te Awe, an internal academy for AI and data-analytics upskilling, illustrating how large employers must build talent pipelines in-house. Government migration pathways intend to ease pressures, yet domestic training remains critical for the New Zealand ICT market to sustain projected growth.
Cybersecurity Threats Escalate Compliance Requirements
Financial losses from cybercrime climbed to NZD 6.8 million (USD 3.97 million) in Q4 2024, a 91% year-on-year spike, with 17 major incidents surpassing NZD 100,000 (USD 58,477.) each. Cyber-insurance underwriting tightened, leading to higher premiums and stricter prerequisites such as multi-factor authentication and annual red-teaming. For SMEs, the added cost diverts funds from innovation to compliance tools, curbing their uptake of advanced solutions within the New Zealand ICT market.
*Our forecasts treat driver/restraint impacts as directional, not additive. The impact forecasts reflect baseline growth, mix effects, and variable interactions.
Segment Analysis
By Product Type: Services Hold Commanding Lead as Security Demand Surges
IT Services captured a dominant 41.19% of 2025 revenue, mirroring corporate preference for managed solutions during economic uncertainty. Elevated demand for network modernization, cloud migration and application maintenance keeps managed-service contracts stable, although margin pressure intensifies from competitive bidding and public-sector austerity. IT Security, while smaller, registers a brisk 9.55% CAGR as board-level awareness of cyber risk compels proactive spending; the segment’s momentum translates into the fastest expansion across the New Zealand ICT market. In contrast, IT Hardware shipments decelerate because enterprises extend refresh cycles and embrace software-defined infrastructure, although peripheral demand persists for hybrid-work deployments.
Heightened regulatory expectations including mandatory breach notifications and privacy-impact assessments elevate security’s strategic importance, embedding cyber controls into every sourcing conversation. Spark’s security unit now exceeds 150 full-time specialists, exemplifying how service providers embed specialized practices to meet this demand. Meanwhile, AI-enabled monitoring blurs the traditional lines between infrastructure, software and security, spawning integrated platform offerings that set new performance benchmarks within the New Zealand ICT industry.

By Enterprise Size: SMEs Deliver Faster Growth Momentum
Large Enterprises maintained 61.94% control of 2025 spending owing to established IT budgets, cross-border digital ambitions and ongoing data-center investments. However, SMEs outpace them at a 10.05% CAGR to 2031 as cloud subscriptions, SaaS models and streamlined public-procurement frameworks democratize access to sophisticated tools. The revised All-of-Government marketplace reduces administrative burden for small suppliers, enabling them to compete for contracts historically awarded to incumbents. Subsidized rural broadband and simplified tax depreciation on ICT assets further enhance SME purchasing power.
For large organizations, near-term headwinds include public-sector budget freezes and private-sector cost controls that delay transformational projects. Spark’s IT-services revenue fell 14.9% in FY 2024 after customers postponed modernization programs. Yet capital-heavy initiatives such as AI super-clusters and green data-centers remain largely a large-enterprise domain, sustaining volume across the broader New Zealand ICT market.
By End-user Industry: Healthcare Rises as Post-Pandemic Priorities Endure
BFSI organizations topped spending with 18.40% of 2025 revenue, driven by core-bank upgrades, digital wallets and regulatory mandates. Nevertheless, healthcare and life sciences record the highest 10.55% CAGR amid telemedicine rollouts, electronic medical-record consolidation and AI-assisted diagnostic tools. Public funding for rural telehealth accelerates demand for secure connectivity, while private providers integrate wearable-device analytics into chronic-care programs, deepening technology dependence.
Manufacturing capitalizes on IoT sensors and predictive maintenance to boost efficiency, aligning with Industry 4.0 objectives. In entertainment, the gaming and esports sub-segment leverages cloud-rendering and AI-driven personalization to target NZD 1 billion (USD 0.58 billion) in export revenue. Energy utilities deploy smart-grid telemetry, and retail chains integrate omnichannel logistics to reduce delivery times. Collectively these verticals diversify revenue sources and reinforce resilience within the New Zealand ICT market.
Geography Analysis
Auckland and Wellington anchor demand, fueled by proximity to hyperscale data centers, dense fiber networks and headquarters of leading corporates and government ministries. The two cities account for most high-value contracts, yet regional centers increasingly benefit from ultrafast broadband and rural-connectivity schemes. Chorus’s 2025 free-speed upgrade, for instance, elevated 700,000 households from 50/10 Mbps to 100/20 Mbps service tiers, closing the digital-inclusion gap.
Christchurch’s rebuilt infrastructure, post-earthquake, incorporates resilient fiber rings and modern data hubs, attracting disaster-recovery-as-a-service deployments. Hamilton and Tauranga see rising demand from agritech ventures leveraging IoT for precision farming. On the South Island, power-rich regions such as Otago draw interest for renewable-backed edge facilities. Nevertheless, grid-capacity constraints in Auckland and Canterbury create planning uncertainty for new hyperscale builds, highlighting the need for accelerated transmission upgrades.
Cross-Tasman subsea cable expansions lower latency between Auckland and Sydney to sub-23 milliseconds, positioning New Zealand as a redundancy node within Asia-Pacific traffic routes. Local privacy statutes, including the Privacy Act 2020, and Māori data-governance principles compel enterprises to store and process sensitive workloads in-country, boosting domestic service uptake. Consequently the New Zealand ICT market leverages geographic isolation as a trust advantage while deploying global interconnectivity to serve outward-facing digital exporters.
Regulatory Landscape
New Zealand ICT regulation is shaped by cross-government digitisation policy and sector-specific telecommunications oversight. In February 2026, the Government Chief Digital Officer set out a Digital Target State for government, paired with the Public Service Commission's 2026 Digital Reset Plan. Together, these frameworks formalise common platforms and shared capabilities that affect how agencies procure cloud, data and AI services. MBIE continues to set ICT policy direction, while the Privacy Act 2020 and mandatory breach-notification expectations keep data handling, security-by-design and privacy impact assessments central to ICT delivery.
On connectivity and competition settings, the Ministry for Regulation published the Telecommunications Sector Regulatory Review in March 2026 with 22 recommendations to modernise the framework. The Commerce Commission's 2026 telecommunications work program includes processes examining legacy services such as PSTN and Mobile Termination Access Service, which could change wholesale and interconnection obligations through 2026. The Telecommunications Amendment Bill 2025 also introduces compliance and governance changes, including dispute resolution scheme membership requirements for larger providers (revenue above NZD 50 million), affecting telecom operators and service providers active in the New Zealand ICT market.
Value Chain Analysis
The New Zealand ICT value chain begins with network and compute infrastructure, where fibre and fixed access are anchored by Chorus and other local fibre companies. Connectivity delivered by operators and wholesalers such as Spark New Zealand and Vocus New Zealand is then followed by onshore cloud and data-centre capacity supported by hyperscalers and domestic providers. Hardware, networking equipment and edge devices move through distributors and systems integrators before entering enterprise and public-sector environments, where application stacks, platforms and managed services are implemented.
Midstream, systems integrators, MSPs and consulting firms package cloud migration, application modernisation, security operations and data/AI services into recurring contracts. Procurement for public agencies is often routed through government panels and marketplaces. In 2026 public-sector digital planning, the government digital supply chain is increasingly organised around shared platforms, including a Digital Public Infrastructure layer and an AI platform services construct that standardises how identity, data sharing and AI capabilities are consumed across agencies. Downstream, demand for managed services and compliance-first solutions comes from end users in government, BFSI, healthcare, utilities and SMEs, with rollout and field services from network build and cabling specialists, such as Advanced Communications, supporting last-mile delivery and enterprise site enablement.
Competitive Landscape
Market concentration sits at a moderate level: traditional telecom incumbents Spark New Zealand, One New Zealand and Chorus control backbone infrastructure, but hyperscalers and a long tail of specialist MSPs intensify rivalry. Spark’s margins compressed in FY 2025 as aggressive business-mobile pricing and public-sector austerity pressured earnings. In response, the operator divested select tower assets to fund data-center expansion and signed a 5G-standalone pact with Nokia to unlock edge-compute use cases.
International clouds differentiate through localized compliance, such as Microsoft’s inclusion of Te Tumu Paeroa as anchor tenant to demonstrate Treaty alignment. Domestic challengers like Team IM and Datacom deliver sovereign-cloud services, targeting public agencies sensitive to offshore data flows. Meanwhile, niche providers exploit gaps in AI consulting, zero-trust security and managed Kubernetes, prompting a wave of partnership-driven go-to-market strategies.
ESG credentials now factor heavily into contract awards: NEXTDC’s renewables-powered Auckland facility competes head-to-head with Spark’s green-energy pledge, compelling incumbents to publish detailed sustainability roadmaps. Overall, price-based competition in legacy connectivity coexists with value-based differentiation in managed services, AI and compliance-first offerings, reshaping the revenue mix within the New Zealand ICT market.
New Zealand ICT Industry Leaders
-
IBM New Zealand Ltd
-
Amazon New Zealand Pty Ltd
-
Microsoft New Zealand Limited
-
Spark New Zealand Limited
-
Datacom Group Limited
- *Disclaimer: Major Players sorted in no particular order

Market Opportunities and Future Outlook
One major opportunity area is government-wide platforming of common digital capabilities, which widens demand for vendors able to integrate secure identity, data exchange, cloud hosting and AI governance into repeatable service patterns. The Government Chief Digital Officer's February 2026 Digital Target State and the 2026 Digital Reset Plan explicitly push shared delivery models, including a Digital Public Infrastructure layer and work toward an All-of-Government AI reference architecture by FY27/28. As a result, there is room for systems integrators, managed security service providers and cloud partners to productise delivery into reusable components across agencies rather than relying on one-off bespoke implementations.
Regulatory reform activity also creates supplier opportunities tied to compliance, migration and network modernisation. The Telecommunications Sector Regulatory Review published in March 2026 cites net benefits of NZD 35-45 million over the next decade, and the Commerce Commission's 2026 work program keeps reviews of legacy services active, prompting operators and enterprise customers to rationalise older voice and interconnection dependencies. In parallel, the government's quantified push for digitisation productivity, with stated NZD 3.7-5.9 billion in ten-year cost savings tied to Digital Target State implementation, reinforces spending on cloud transformation, application rationalisation, cybersecurity controls and service automation. Vendors that can demonstrate Treaty-aligned delivery and data-residency options that support Maori data-sovereignty requirements have clearer access to this spend.
Recent Industry Developments
- June 2026: Microsoft New Zealand deepened strategic partnership with Commvault to offer cyber resilience technologies as a native ISV service within Microsoft Azure, enabling integrated procurement through Microsoft Marketplace. The arrangement strengthens Azure based offerings and procurement processes for NZ enterprises, boosting AI and cyber solutions adoption.
- June 2026: IBM New Zealand reported annual profit before income tax of NZD 28.4 million for the year ended 31 December 2025. The result signals local capability consolidation and cost management, with potential influence on public-cloud and data management services strategy.
- April 2026: Microsoft New Zealand Westpac NZ began rolling out Microsoft Dynamics 365 Contact Centre as a Service platform to support customer service with real time AI driven banking profile information. The deployment demonstrates enterprise scale AI enabled customer service transformation and marketplace integration.
Research Methodology Framework and Report Scope
Market Definition and Coverage
This market covers total spending in New Zealand on information and communication technology products and services used by businesses and the public sector, including hardware, software, IT services, connectivity, and security, measured in USD for the study period.
Scope exclusions: Consumer electronics purchased mainly for personal use, and non-ICT utilities construction that is not directly tied to ICT equipment and services, are not counted.
Segmentation Overview
- By Product Type
- IT Hardware
- Computer Hardware
- Networking Equipment
- Peripherals
- IT Software
- IT Services
- IT Consulting and Implementation
- IT Outsourcing (ITO)
- Business Process Outsourcing (BPO)
- Managed Security Services
- Cloud and Platform Services
- IT Infrastructure
- IT Security/Cybersecurity
- Communication Services
- IT Hardware
- By Enterprise Size
- Small and Medium-sized Enterprises
- Large Enterprises
- By End-user Industry Vertical
- Government and Public Administration
- BFSI
- IT and Telecom
- Energy and Utilities
- Retail, E-commerce, and Logistics
- Manufacturing and Industry 4.0
- Healthcare and Life Sciences
- Oil and Gas
- Other Verticals
Data Sources, Market Sizing, and Validation
Desk Research
Desk inputs were used to set the country context and to anchor realistic demand signals before modeling. We reviewed public statistics and policy documents that describe the size and direction of digital activity, such as Statistics New Zealand ICT supply releases, Reserve Bank of New Zealand macro series, and Ministry of Business, Innovation and Employment digital and labor updates.
To keep assumptions grounded, we also relied on sources such as New Zealand Customs trade statistics for ICT-related goods, OECD and ITU indicators for connectivity and adoption, and World Bank macro series for deflators and currency context. Company annual reports, investor presentations, and credible press coverage were then used to pin down the timing of major projects.
Where public disclosures were uneven, we used paid subscriptions only for standardized company financials, patent lookups, and tracking shipment or contract announcements. The above desk sources are illustrative only, and many additional public documents and datasets were also used for clarification and cross-checking.
Primary Interviews and Surveys
Primary validation came from expert interviews and structured surveys across telecom operators, IT service providers, cloud and security specialists, distributors, and enterprise buyers in key verticals like government, BFSI, healthcare, and retail. We used these discussions to confirm what is typically bundled versus sold separately in New Zealand, test price progression assumptions, and check how quickly cloud migration, security spend, and connectivity upgrades are shifting across regions.
Distribution of primary research fieldwork respondents
| Company type | Respondent position |
|---|---|
| Top tier: 27% | CXOs: 14% |
| Mid tier: 58% | Functional/Unit leaders: 33% |
| Smaller Players: 15% | Managers: 53% |
Market-Sizing & Forecasting
Sizing starts from a top-down build that reconstructs New Zealand ICT spend using national indicators, sector IT intensity, and service adoption patterns, and then it is cross-checked through selective bottom-up approximations. In practice, we pressure-test totals using supplier and channel checks, sampled average selling price (ASP) times volumes for common line items, and revenue-share splits informed by interviews. Where the two views disagree beyond a reasonable band, we adjust the model accordingly.
The model is driven by a small set of repeatable inputs that can be traced each year, such as enterprise cloud adoption and migration pace, telecom service revenue direction (including mobile and fixed), cybersecurity spend priority shifts, IT services outsourcing intensity, and the installed base refresh cycle for core hardware. New Zealand-specific signals, like public-sector digitization timing and data residency preferences that influence onshore deployments, were applied as qualitative correctives after being tested with experts.
For forecasting, scenario analysis is used so growth paths remain realistic under different macro and budget conditions. Scenario weights are then aligned to what interviewees expect for 12 to 24 month procurement cycles. Gaps in bottom-up checks are handled by using conservative proxy ranges from comparable buyer groups, followed by re-validation in interviews so estimates do not drift based on desk assumptions alone.
Data Validation & Update Cycle
Outputs were validated through triangulation across public indicators, interview feedback, and internal consistency checks across the value chain. We reviewed year-to-year jumps, segment share drift, and currency effects, and then flagged anomalies for a second analyst review before sign-off.
The study is refreshed on an annual cycle, and interim updates are made when material events occur, such as large network investments, regulatory changes, or major pricing shifts. Before delivery, a fresh pass is completed so the published view reflects the latest available releases and newly confirmed primary inputs.
Mordor Intelligence's New Zealand Ict Market Size Measured Against Other Published Estimates
It is normal for published market values for New Zealand ICT to differ because each publisher sets its own definition of what counts as ICT, which year is treated as the base, and how currency and inflation are handled. Differences also come from whether a figure reflects only tech industry sales, or the wider spending pool that includes communications services and multi-year contracts.
Some public figures emphasize a broader national ICT value that blends telecom services with technology spending and may apply a single growth rate forward. Mordor Intelligence counts ICT as a combined demand pool across hardware, software, IT services, infrastructure, security, and communication services. The method also keeps overlaps controlled by checking bundling, renewal timing, and New Zealand-specific pricing and adoption inputs during primary validation.
Benchmark comparison
| Source | Market Size | Gaps in Research Methodology |
|---|---|---|
| Mordor Intelligence | USD 16.28 B (2025) | |
| Government Trade Guide A | USD 19.80 B (2024) | Often presented as a single headline country value with limited detail on included components, base-year alignment, and how telecom services and technology sub-spends are separated, which can lift the total versus a controlled overlap model. |
| Official Statistics Release B | USD 8.85 B (2023) | Tracks sales of published software and IT services from surveyed businesses and does not aim to represent the full ICT spend pool, so communications services and several hardware and infrastructure categories are not captured in the same total. |
The spread in the table mostly comes from scope and what the number is meant to represent, either a wide ICT headline, a narrower tech-industry sales measure, or a demand-side spend view. By keeping the inputs tied to adoption, contract timing, and bundling checks that can be repeated each refresh, the final estimate stays transparent and easier to reconcile with adjacent public signals.
Key Questions Answered in the Report
What is the projected value of the New Zealand ICT market by 2031?
The market is forecast to reach USD 27.72 billion by 2031, expanding at a 9.29% CAGR.
Which segment will grow fastest through 2031?
IT Security leads with a 9.55% CAGR as firms prioritize cyber-resilience.
How are Maori data-sovereignty principles impacting technology procurement?
They drive adoption of hybrid and sovereign-cloud architectures that keep sensitive data onshore.
Why are hybrid cloud models gaining popularity?
Enterprises balance regulatory data-residency with public-cloud flexibility, pushing hybrid strategies to a 10.42% CAGR.
What skills shortage most affects the sector?
Shortages in cloud architects, AI engineers and cybersecurity professionals constrain implementation timelines.
How significant are renewable-energy commitments for data-center investments?
Green-energy deals, like Spark’s 63 MW solar PPA, are now decisive factors for ESG-minded customers selecting local facilities.