
Market Overview
| Study Period | 2020 - 2031 |
|---|---|
| Forecast Data Period | 2026 - 2031 |
| Base Year Market Size (2025) | USD 5.01 Billion |
| Market Size (2026) | USD 5.24 Billion |
| Market Size (2031) | USD 6.81 Billion |
| Growth Rate (2026 - 2031) | 5.40 % |
| Market Concentration | Medium |
Major Players *Disclaimer: Major Players sorted in no particular order Image © Mordor Intelligence. Reuse requires attribution under CC BY 4.0. | |
New Zealand Facility Management Market Analysis by Mordor Intelligence
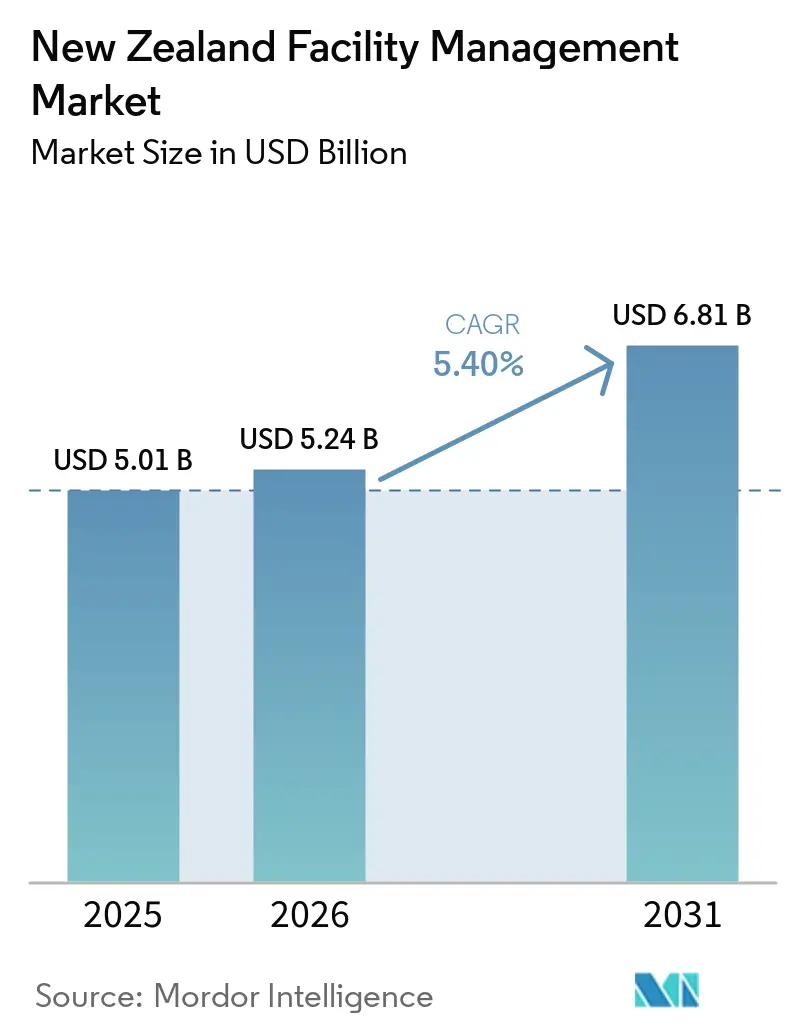
The New Zealand Facility Management Market size is expected to grow from USD 5.01 billion in 2025 to USD 5.24 billion in 2026 and is forecast to reach USD 6.81 billion by 2031 at 5.40% CAGR over 2026-2031. The measured growth reflects a maturing environment where regulatory compliance, seismic resilience, and digital transformation outweigh pure expansion. Hard services dominate demand, supported by the Building (Earthquake-prone Buildings) Amendment Act 2016, while soft services record the fastest growth as employers outsource non-core functions amid a persistent skills shortage. Outsourced contracts now cover almost two-thirds of the value, and integrated arrangements are replacing single-service deals. Commercial facilities lead spending due to hyperscale data-center builds, whereas institutional and public infrastructure show the strongest growth as Wellington, Auckland, and regional authorities seek better asset stewardship. Escalating insurance premiums, constrained labor availability, and inflationary cost pressures temper momentum yet simultaneously accelerate the adoption of technology-enabled, outcome-based models that promise measurable savings and compliance assurance.
Key Report Takeaways
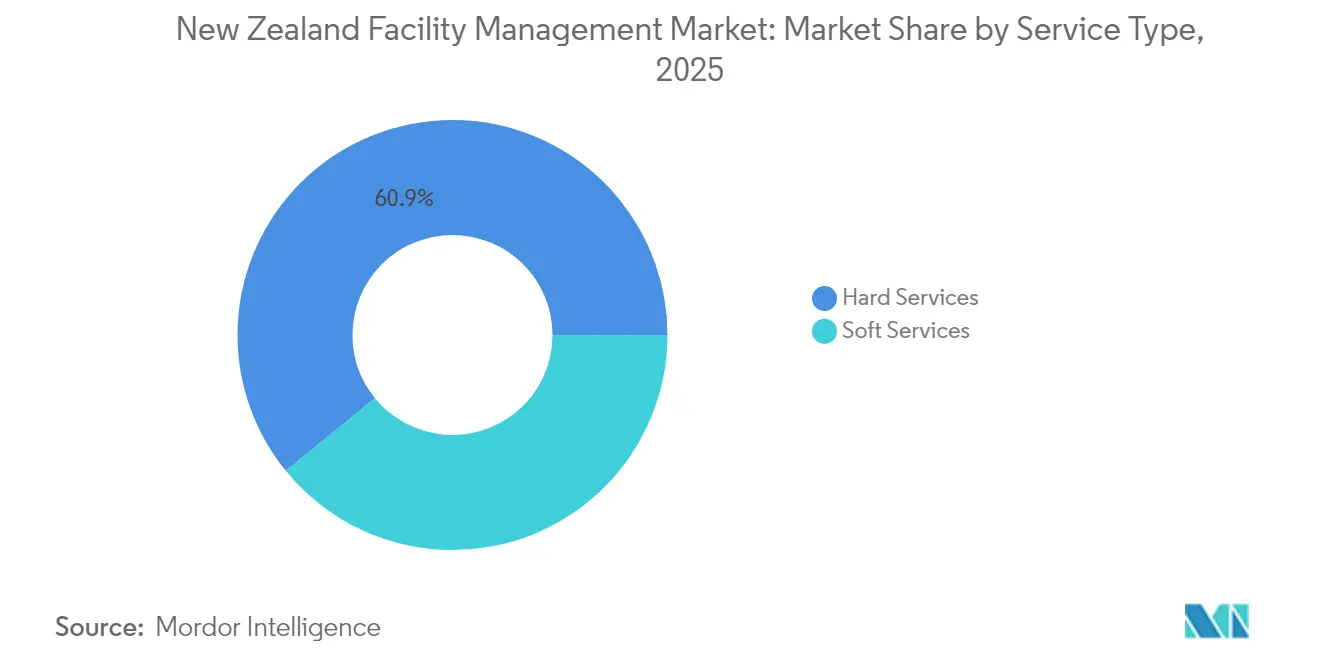
- By service type, hard services held 60.88% of New Zealand's facility management market share in 2025, while soft services are forecast to expand at a 7.08% CAGR to 2031.
- By offering type, outsourced delivery commanded 63.55% share of New Zealand facility management market size in 2025 and is projected to grow at a 6.63% CAGR between 2026-2031.
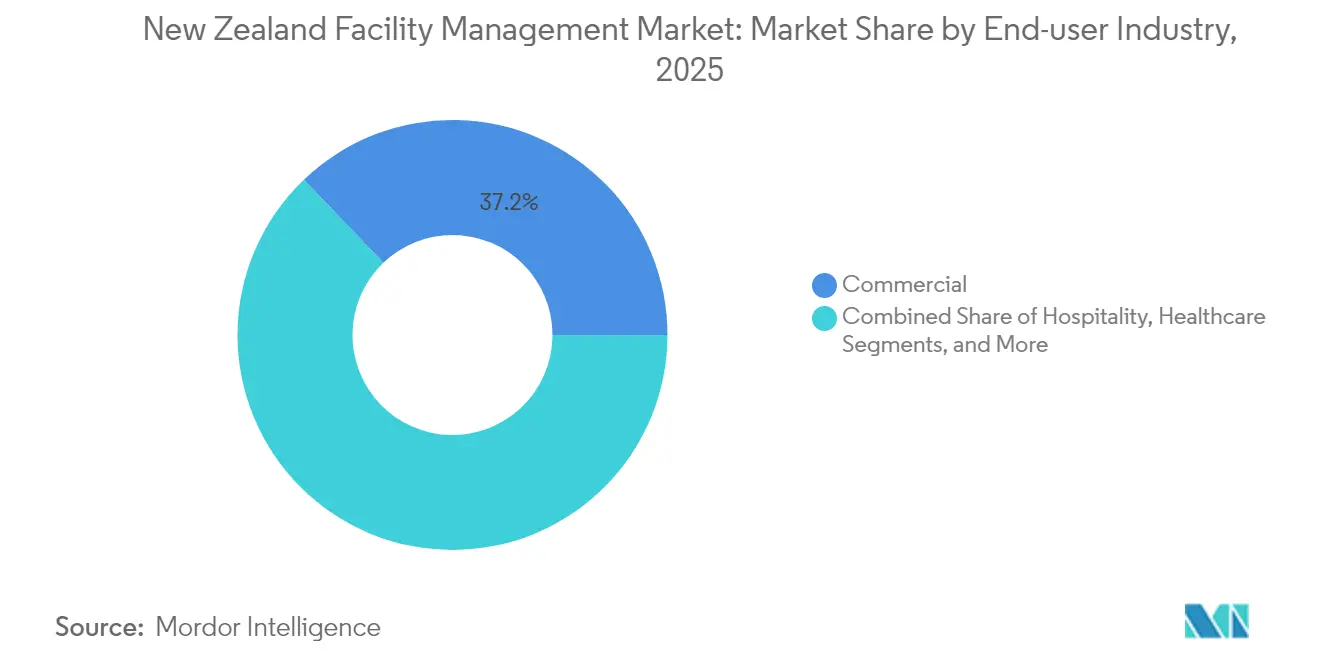
- By end-user industry, commercial facilities captured 37.15% of New Zealand's facility management market share in 2025; institutional and public infrastructure is advancing at a 6.84% CAGR through 2031.
Note: Market size and forecast figures in this report are generated using Mordor Intelligence’s proprietary estimation framework, updated with the latest available data and insights as of 2026.
New Zealand Facility Management Market Trends and Insights
Drivers Impact Analysis*
| Driver | (~) % Impact on CAGR Forecast | Geographic Relevance | Impact Timeline |
|---|---|---|---|
| Current occupancy rates | +0.3% | Auckland, Wellington, Christchurch CBDs | Short term (≤ 2 years) |
| Workforce indicators – labour participation | +0.4% | National, concentrated in major metros | Medium term (2-4 years) |
| Urbanization and population growth | +0.5% | Auckland, Hamilton, Tauranga corridors | Long term (≥ 4 years) |
| Infrastructure investment priorities | +0.6% | National focus on transport and utilities | Medium term (2-4 years) |
| Seismic strengthening mandates | +0.7% | High-risk zones (Wellington, Canterbury) | Long term (≥ 4 years) |
| Data-center expansion | +0.8% | Auckland, Wellington, Christchurch, Invercargill | Short term (≤ 2 years) |
| Source: Mordor Intelligence | |||
Current occupancy rates
Hybrid work policies and rising commercial rents push organizations to optimize floorplates, sustaining demand for energy, cleaning, and security services that flex with headcount. Premium Auckland offices such as Fanshawe Street command USD 530 per m², more than double Hamilton averages, prompting multi-site firms to rebalance space portfolios while maintaining uniform service standards. [1] Flexible-workspace operators are consolidating; CBRE’s USD 400 million purchase of Industrious integrates workplace experience with traditional facility offerings. Providers able to match service levels to real-time occupancy and document savings win multi-year outcome-based contracts. IoT-enabled occupancy sensors underpin automated lighting, HVAC, and cleaning rotations, cutting utility and labor hours by double-digit percentages. Over the next two years, occupancy-led optimization is expected to add around 0.3 percentage points to overall market CAGR as more leases shift to variable-cost models.
Workforce indicators – labour participation
A chronic talent deficit touches 40% of New Zealand employers, with trade skills hardest to fill. Construction alone needs 50,000-60,000 extra workers over five years. Average entry-level trade wages have reached USD 30 per hour in Queenstown, inflating the cost base for hard and soft service contracts. To cope, leading vendors deploy cloud-based CMMS and predictive analytics that eliminate 30-50% of routine interventions. [2] MaintainX users such as Ahlstrom slashed mean-time-to-repair by 90%, evidencing tangible ROI. Automation uptake and remote diagnostics are expected to raise service productivity, offset wage inflation, and add 0.4 percentage points to CAGR through 2028.
Urbanization and population growth
Net migration has returned to pre-pandemic highs and concentrates along the Auckland-Hamilton-Tauranga corridor, spurring commercial builds and municipal infrastructure upgrades. Urban sprawl increases the serviced floor area plus ancillary requirements for waste, landscaping, and security. Growth corridors demand resilient utilities; local councils specify minimum green-star ratings that drive higher-value facilities contracts. Over the long term, population inflows are forecast to contribute 0.5 percentage points to market CAGR, particularly benefiting bundled and integrated FM providers capable of regional scale.
Infrastructure investment priorities
The draft National Infrastructure Plan calls for stronger asset management to maximize returns on public spending. Central and local government own roughly 40% of national infrastructure, representing a steady pipeline of road, rail, water, and social-asset maintenance. Auckland Transport alone spends more than USD 250 million annually on road upkeep. Hyperscale data centers built by Microsoft, AWS, and Amazon, totalling USD 8.5 billion, require 24/7 facilities oversight and stringent uptime guarantees. These programs are expected to add 0.6 percentage points to the overall CAGR during the medium term.
Restraints Impact Analysis*
| Restraint | (~) % Impact on CAGR Forecast | Geographic Relevance | Impact Timeline |
|---|---|---|---|
| Rising operational costs | –0.4% | National, higher in major metros | Short term (≤ 2 years) |
| Skilled labour shortages | –0.6% | National, acute in trades | Medium term (2-4 years) |
| Escalating compliance costs | –0.3% | National, stricter in urban areas | Long term (≥ 4 years) |
| High insurance premiums and natural-disaster risk | –0.5% | Coastal and high seismic areas | Medium term (2-4 years) |
| Source: Mordor Intelligence | |||
Rising operational costs
Construction-cost inflation eased to 1.1% YoY in 2024 after peaking at 10.4% in 2022. Nonetheless, insurance premiums surged 23-76% post-Cyclone Gabrielle, with the Treasury considering a 72% levy hike adding USD 400 annually to policies. Energy tariffs and carbon fees compound the squeeze; commercial buildings generate 3.6 million tons of waste each year and face tighter emissions reporting. Vendors respond with smart-metering, LED retrofits, and waste-to-resource programs that promise double-digit savings, yet near-term profitability remains pressured, trimming about 0.4 percentage points from CAGR.
Skilled labour shortages
Vacancies in HVAC, electrical, and automation trades force overtime rates and reliance on subcontractors, undermining margins. Only 10% of firms run robust apprenticeship schemes, and retirements outpace entrants, widening the competency gap. Instances such as security guards doubling as cleaners at rural hospitals illustrate the strain. Digital twins, AR-assisted maintenance, and centralized help desks alleviate some scarcity, but the constraint still subtracts 0.6 percentage points from growth until training pipelines recover.
*Our forecasts treat driver/restraint impacts as directional, not additive. The impact forecasts reflect baseline growth, mix effects, and variable interactions.
Segment Analysis
By Service Type: Hard Services Drive Seismic Compliance
Hard services claimed 60.88% share of the New Zealand facility management market size in 2025, underpinned by mandatory structural assessments, MEP upgrades, and fire-safety retrofits across thousands of assets. Engineering consultancies partner with integrated FM firms to deliver turnkey seismic projects, capturing recurring monitoring fees once upgrades finish. Data-center openings intensify demand for mission-critical HVAC maintenance, switchgear testing, and redundancy planning. OEM-backed service contracts guarantee uptime metrics that command premium pricing. Asset-management analytics using AI schedule capital replacements, extend lifecycle, and reduce asset-failure incidents. This predictability grants hard-service providers stable cash flows through 2031.
Soft services, while smaller, grow at 7.08% CAGR as organizations externalize cleaning, security, catering, mailroom, and reception tasks. Wage escalation accelerates automation: cobotic floor-scrubbers, AI-powered rostering, and smart-locker mail solutions proliferate. Healthcare and data-center clients specify higher hygiene and security standards, lifting average contract value. ESG reporting pushes vendors to switch to low-tox chemicals and electrified equipment, differentiating bids. Technology integrators like ESP (rebranding to BraveGen) inject carbon-tracking into cleaning workflows, demonstrating quantitative savings and winning multi-site portfolios. As a result, bundled soft-service contracts increasingly roll into integrated FM deals for holistic value.

By Offering Type: Outsourcing Accelerates Integration
Outsourced delivery held 63.55% of New Zealand's facility management market share in 2025 and maintains a 6.63% CAGR trajectory as enterprises shed non-core operations. Government ministries award long-duration performance contracts that shift risk to suppliers, mirroring Veolia’s 7-25 year template. Integrated FM, the fastest sub-model, knits hard and soft services plus energy advisory into single SLAs backed by digital dashboards. Healthcare boards, universities, and data-center operators favor the arrangement for single-throat accountability and KPI transparency. Cloud-based IWMS platforms enable near-real-time tracking of work orders, compliance, and sustainability metrics.
In-house management still accounts for 36.45% of value, but erodes as skills shortages and technology capex deter boards from retaining full internal teams. Hybrid models emerge: strategic FM oversight remains internal, yet high-specialty activities, chiller overhauls, fire-system testing, facade access, are outsourced. Single service and bundled FM options serve clients unwilling to cede full control but requiring selective expertise, creating a stepping-stone toward integrated deals. Downer’s PPP track record shows bundled FM can lift margins when paired with digital optimization, evidenced by its 34% earnings jump in 2024.
By End-user Industry: Commercial Leads Digital Transformation
Commercial facilities commanded 37.15% of the New Zealand facility management market size in 2025, propelled by hyperscale cloud campuses and omnichannel retail distribution. Microsoft, AWS, and Amazon collectively invest USD 8.5 billion in server farms that expect 99.999% uptime and precise environmental controls. Retailers modernize warehouses with autonomous robots, demanding specialized floor maintenance and electrical support. Sustainability targets push mall owners to deploy smart-meter stacks and LED retrofits, generating shareable utility savings with service partners. Institutional and public infrastructure exhibits the highest 6.84% CAGR thanks to the government’s asset-management focus and aging hospitals, schools, and transport networks.
The healthcare subsector highlights staffing and hygiene complexities; controversies such as dual-role security cleaners underscore service gaps. Education boards install building-management systems for ventilation monitoring, while road-maintenance consortia integrate sensors for predictive pothole repair. Providers with integrated FM capacity and compliance track records capture these portfolios. Industrial and process plants, hospitality venues, and other sectors round out demand. Fonterra’s Darfield factory processes 4.4 million L of milk daily and contracts advanced automation support. Hotels rebound post-pandemic; Capstone expands to 22 properties, utilizing SiteMinder to optimize occupancy and housekeeping rosters. Each niche requires domain-specific know-how yet increasingly converges around digital dashboards, energy efficiency, and stringent compliance, favoring scale vendors.
Geography Analysis
Auckland dominates the New Zealand facility management market share, reflecting its status as the commercial and population hub, concentration of hyperscale data centers, and large infrastructure builds such as the City Rail Link and airport terminal expansion. Prime CBD office rents exceed USD 530 per m² and drive premium FM rates. Clients prioritize 24/7 support, smart-building solutions, and ESG disclosure. Integrated providers combine help-desk, energy management, and critical-asset maintenance to meet these sophisticated demands.
Wellington ranks second, shaped by seismic risk and a high density of government properties. Over 150 CBD structures await NBS compliance, guaranteeing steady engineering workloads. Public-sector outsourcing continues, illustrated by Te Papa’s cleaning and related services tender awarded to ISS. Vendors must navigate rigorous procurement, unionized workforces, and heightened transparency standards. Demand focuses on seismic monitoring, document management, and lifecycle planning.
Christchurch and the wider Canterbury region remain growth hotspots following post-quake reconstruction and expanding food-processing facilities. Modern building stock integrates IoT controls, requiring technicians versed in BMS analytics. Lower rent, USD 245 per m² in Hamilton as reference, makes bundled FM appealing for cost-sensitive occupants. Regional councils emphasize sustainable waste solutions and water-treatment oversight, opening niches for specialist operators.
Smaller centres such as Invercargill could punch above their weight due to a proposed USD 1 billion data center investment, which will necessitate on-call engineers and strict security regimes. Remote locations encourage cloud-based monitoring and fly-in service crews, representing an emerging use-case for digital twins and AR troubleshooting. Across all geographies, regulatory compliance, resilience, and energy efficiency form common threads, ensuring consistent demand for integrated, technology-driven FM.
Regulatory Landscape
Facility management activity in New Zealand operates under the Building Act 2004 and MBIE administered Building Code settings that govern safety, product use, and performance-based compliance. The 2025 Building Code update introduced Building Product Specifications (BPS), with First Edition Amendment 1 taking effect on 2 April 2026 and tightening how products and systems are evidenced and documented across the building lifecycle.
Energy and maintenance requirements are guided by changes to the H1 energy efficiency settings, with new editions of H1 AS1, AS2, VM1, and VM2 taking effect on 27 November 2025 and a 12-month transition running to 26 November 2026. In the public sector, central procurement guidance reinforces standardized contracting, while Health New Zealand published its National Digital Facilities Framework on 28 May 2026, setting a common approach for digital scope and interoperability across portfolios.
Value Chain Analysis
Asset owners define service outcomes and compliance needs and then source delivery through in-house teams, specialist subcontractors, or integrated facility management (IFM) primes. Upstream inputs include building materials and certified products evidenced through Building Product Specifications, OEM equipment (HVAC, fire systems, BMS), and a labor supply base constrained in specialist trades, which increases reliance on accredited contractors and standardized work-management processes.
Core delivery runs from mobilization and transition into recurring hard and soft services, supported by CMMS/IWMS platforms, IoT sensing, and BMS analytics that convert condition and occupancy data into work orders and preventative schedules. IFM providers orchestrate subcontractor networks for MEP, fire, and automation tasks, then close the loop with client reporting (performance KPIs, compliance records, and sustainability metrics). Association and industry bodies such as FMANZ influence capability uplift and contracting norms, while scale providers such as PAE New Zealand (noting its stated support for over 230,000 maintenance jobs annually) and OCS New Zealand reflect the operational backbone needed to manage multi-site portfolios with consistent service levels.
Competitive Landscape
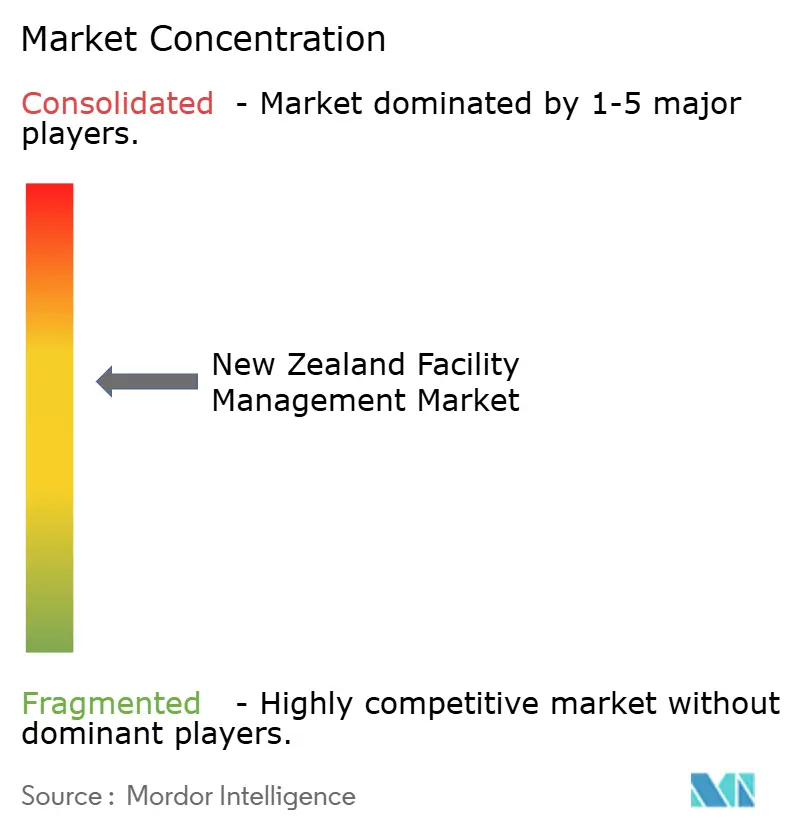
The New Zealand facility management market demonstrates moderate fragmentation. Spotless, a Downer subsidiary, leads with more than 1,000 clients and coverage across healthcare, education, and defense. [4] Parent Downer posted USD 38.5 billion work-in-hand and 34% EBITA growth in 2024, underlining the capacity to invest in digital tools and workforce training. Ventia Services Group competes strongly in infrastructure and utilities following its dual NZX/ASX listing and targeted acquisitions.
Global property giants intensify competition. CBRE’s acquisition of Industrious for USD 400 million merges flexible office operations with facilities portfolios, creating a USD 20 billion revenue platform. Cushman & Wakefield and JLL leverage international best practices, particularly in energy optimization and workplace experience analytics. Smaller domestic players focus on niche services—waste, hygiene, or regional contracts—but risk being outbid without scale technologies.
Technology serves as a key differentiator. Downer’s rollout of IBM Envizi halves ESG reporting effort and supports its 50% emissions-cut pledge. Veolia’s long-horizon performance contracts illustrate risk-transfer appetite and integrated energy-service expertise. ESP/BraveGen overlays AI on utility data to deliver carbon insights for cleaning and maintenance workflows. Consolidation is expected as firms seek breadth and digital capability; Ovation Hospitality’s purchase of Downer NZ Catering shows vertical integration in soft services.
White-space lies in outcome-based, data-rich agreements that guarantee energy, uptime, or compliance metrics. Providers that combine asset analytics, mobile workforce tech, and robust HSE governance stand to capture a disproportionate share, especially as public-sector tenders pivot to value-for-money scoring models.
New Zealand Facility Management Industry Leaders
-
OCS New Zealand
-
Spotless (Downer Company)
-
PAE New Zealand
-
Professional Property and Cleaning Services Ltd
-
Infratel Networks Limited
- *Disclaimer: Major Players sorted in no particular order
Market Opportunities and Future Outlook
Public-sector digitization and standardization create a defined whitespace for FM providers to align service delivery to common digital architectures and asset-information practices. The Digital Target State framework, published by the Government Chief Digital Officer in February 2026, and Health New Zealand's National Digital Facilities Framework on 28 May 2026 raise expectations around data governance, integration, and cybersecurity-aware operations in institutional estates, supporting structured rollouts of IWMS/CMMS, digital handover, and portfolio-level analytics.
Smart-building and automation deployments in commercial and hospitality assets create service-model opportunities where providers can bundle FM with measurable outcomes in energy, comfort, and maintenance responsiveness. Evidence from 2026 shows KNX-based smart room automation completed at InterContinental Auckland in April 2026, pointing to demand for BMS-adjacent support and remote monitoring. Multi-vendor integration patterns seen in civic builds such as Christchurch's Parakiore Recreation and Sports Centre (completed 2025), using Siemens BMS hardware with CopperTree Analytics, reinforce opportunities for digitally enabled hard services and maintenance.
Recent Industry Developments
- May 2026: Health New Zealand issued its National Digital Facilities Framework on 28 May 2026 to standardize digital scope in facilities management across the health portfolio. The framework emphasizes data governance, interoperability, and standardized documentation to support integrated facilities operations.
- April 2026: eelectron completed KNX-based smart room automation at InterContinental Auckland. The project automates climate, lighting, and shading using occupancy sensing and integrates with the building management system for centralized monitoring and control.
- February 2026: Government Chief Digital Officer published the Digital Target State framework, outlining common digital infrastructure layers across government services. The framework supports standardized data models, cybersecurity-aware operations, and interoperable digital services across portfolios.
Research Methodology Framework and Report Scope
Market Definition and Coverage
For this report, the facility management market in New Zealand is defined as the annual revenue earned from hard and soft services that keep buildings and sites operating, safe, and compliant. It includes work delivered through in-house teams as well as outsourced contracts across common end-user facilities.
Scope exclusions: We exclude pure construction and one-time capital projects that do not relate to ongoing facility operations and recurring maintenance.
Segmentation Overview
- By Service Type
- Hard Services
- Asset Management
- MEP and HVAC Services
- Fire Systems and Safety
- Other Hard FM Services
- Soft Services
- Office Support and Security
- Cleaning Services
- Catering Services
- Other Soft FM Services
- Hard Services
- By Offering Type
- In-house
- Outsourced
- Single FM
- Bundled FM
- Integrated FM
- By End-user Industry
- Commercial (IT and Telecom, Retail and Warehouses, etc.)
- Hospitality (Hotels, Eateries, Large-scale Restaurants)
- Institutional and Public Infrastructure (Govt, Education, Transportation)
- Healthcare (Public and Private Facilities)
- Industrial and Process (Manufacturing, Energy, Mining)
- Other End-user Industries (Multi-housing, Entertainment, Sports and Leisure)
Data Sources, Market Sizing, and Validation
Desk Research
Desk research helped set the market boundary and create the first pass of demand, pricing, and service mix assumptions for New Zealand. We used public and official sources such as Stats NZ (labor, business counts, and output indicators), MBIE releases (construction and business conditions), the New Zealand Government Electronic Tenders Service for outsourcing signals, and WorkSafe New Zealand guidance that influences compliance-led service needs.
To keep the sizing tied to real facilities activity, we also reviewed local council and central government asset and facilities planning documents, relevant building and fire safety requirements published by public agencies, and peer-reviewed studies on building maintenance cycles and performance. Alongside these, we checked company annual reports, investor presentations, association websites, and reputed press, and we used a paid subscription database for company financials and news to validate revenue mixes and contract visibility. This list is not exhaustive, and many other sources were reviewed to collect, validate, and clarify data points used in the model.
Primary Interviews and Surveys
Primary work was used to pressure-test the desk view, especially where contract packaging and outsourcing penetration can move totals quickly. We spoke with buyer-side facilities leads and operators across commercial offices, healthcare sites, public facilities, hospitality properties, and industrial locations, and then validated assumptions with service delivery leaders and local subject experts.
These conversations helped confirm typical service bundling patterns, in-house versus outsourced splits, and how pricing is being reset under wage, energy, and compliance cost changes, which are then applied back into the market model.
Distribution of primary research fieldwork respondents
| Company type | Respondent position |
|---|---|
| Top tier: 27% | CXOs: 12% |
| Mid tier: 54% | Functional/Unit leaders: 34% |
| Smaller Players: 19% | Managers: 54% |
Market-Sizing & Forecasting
Market sizing started with a top-down and bottom-up blend where national facility services demand is reconstructed from the active stock of non-residential buildings, the mix of end-user sites, and typical annual service intensity for hard and soft activities. Once a spend range was formed, selective bottom-up checks were used, such as sampled provider revenues, observed contract run-rates, and simple price-per-site benchmarks to keep totals realistic.
The model uses practical inputs like growth in commercial floor space and public facility usage, outsourcing penetration for single versus bundled versus integrated contracts, frequency of scheduled maintenance, labor cost movement (which drives soft services strongly), and energy and compliance-driven service add-ons. Where direct disclosure was limited, gaps were handled through conservative peer group averaging and contract type splits that were rechecked during interviews.
Forecasting relied on scenario analysis with a simple multivariate structure, so the outlook remains traceable to variables that buyers recognize. Assumptions were adjusted based on expert views on building activity, public sector spending priorities, and how fast integrated models replace single-service arrangements.
Data Validation & Update Cycle
Validation was done through multiple checks so the final values stay consistent with operating signals. We compared outputs against independent indicators like facilities-related workforce trends, visible public sector maintenance programs, and tender activity that signals how quickly outsourcing and bundling are changing.
Outliers were investigated before sign-off, including sudden price jumps, unusual service mix shifts, or growth rates that did not align with building activity. A second analyst review was completed on the core assumptions and totals, and re-contact was triggered when interview feedback conflicted with desk inputs. Reports are refreshed annually, with interim updates when material events affect wages, regulation, or major contract structures, and a final pre-delivery check is completed so clients receive the latest view.
Mordor Intelligence's New Zealand Facility Management Market Size Compared Against Other Published Estimates
Published market sizes can diverge even when they appear to describe the same facility services activity, because sources apply different inclusions and different ways of turning contracts into yearly revenue. The table previews the most common reasons behind the spread, which usually comes down to how in-house delivery is treated and how bundled agreements are counted.
Key gaps in New Zealand typically come from whether soft and hard services inside one bundle are double-counted, whether integrated contracts are treated as a full facility management spend line or split across sub-services, and whether reported values reflect recurring annual spend versus multi-year contract totals. Currency timing also plays a role, since wage resets and energy costs can move pricing quickly, and some published figures are not refreshed after major policy or labor changes.
Benchmark comparison
| Source | Market Size | Gaps in Research Methodology |
|---|---|---|
| Mordor Intelligence | USD 4.01 B (2025) | |
| Industry Association A | USD 4.70 B (2025) | Often relies on member-reported contract values and can treat bundled agreements as fully additive across service lines, which can overstate totals when hard and soft scopes are priced together. |
| Trade Journal B | USD 3.50 B (2025) | Commonly tracks outsourced contract awards and excludes in-house delivery, and multi-year deals may be annualized using simplified run-rates that miss re-pricing and scope variations. |
The table shows a clear spread for the same year, and in Mordor Intelligence's model the value includes both in-house and outsourced delivery and counts integrated, bundled, and single-service arrangements only when they represent ongoing operations and maintenance spend. With those inclusions stated upfront and checked against tenders, workforce signals, and interview feedback, the resulting market size stays easier to replicate and interpret.
Key Questions Answered in the Report
What is the current value of the New Zealand facility management market?
The New Zealand facility management market size is USD 5.24 billion in 2026.
Which service type holds the largest share?
Hard services lead with 60.88% New Zealand facility management market share in 2025.
Why are outsourced contracts growing faster than in-house management?
Organizations pursue cost certainty, regulatory compliance, and access to scarce technical talent, driving outsourced arrangements to a 6.63% CAGR through 2031.
How do seismic regulations influence demand?
The Earthquake-prone Buildings Act mandates assessments and retrofits across commercial stock, ensuring long-term demand for structural and compliance services.
Which end-user segment is expanding the quickest?
Institutional and public infrastructure shows the fastest 6.84% CAGR as government agencies prioritize asset management and maintenance efficiency.
What technologies are reshaping service delivery?
IoT sensors, predictive maintenance analytics, cloud-based CMMS, and ESG reporting platforms cut manual interventions, boost uptime, and support outcome-based contracts.