
Market Overview
| Study Period | 2020 - 2031 |
|---|---|
| Forecast Data Period | 2026 - 2031 |
| Base Year Market Size (2025) | USD 3.25 Billion |
| Market Size (2026) | USD 3.54 Billion |
| Market Size (2031) | USD 5.43 Billion |
| Growth Rate (2026 - 2031) | 8.92 % |
| Market Concentration | Medium |
Major Players *Disclaimer: Major Players sorted in no particular order Image © Mordor Intelligence. Reuse requires attribution under CC BY 4.0. | |
New Zealand E-commerce Market Analysis by Mordor Intelligence
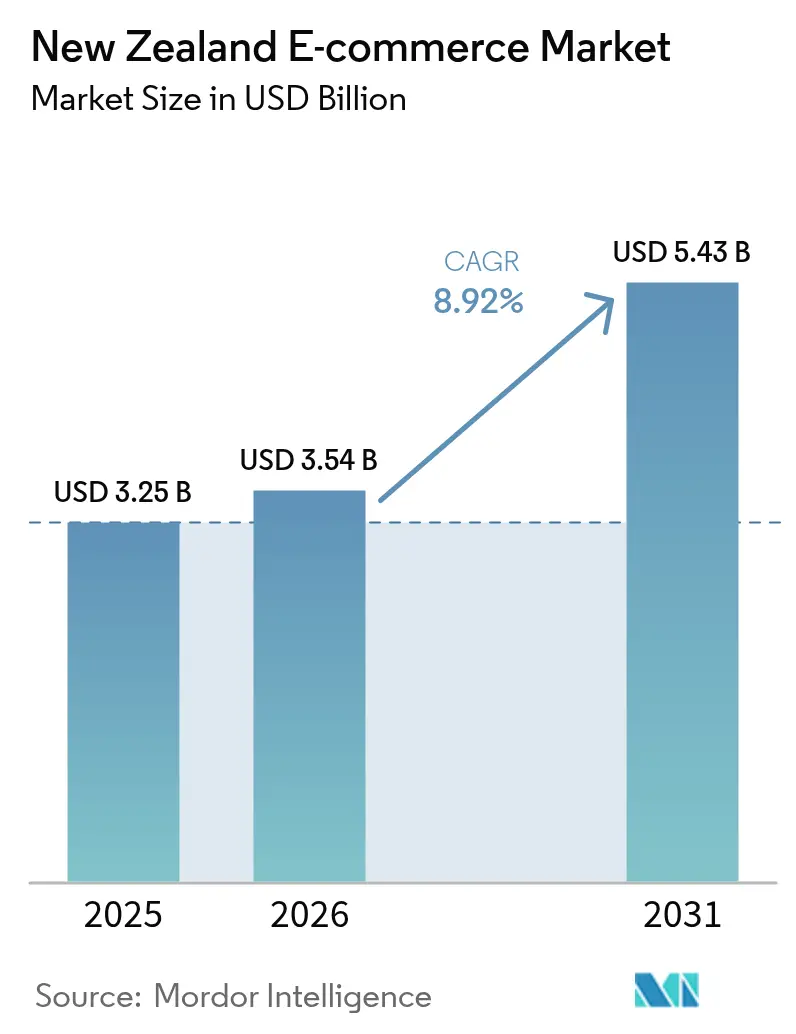
The New Zealand e-commerce market size in 2026 is estimated at USD 3.54 billion, growing from 2025 value of USD 3.25 billion with 2031 projections showing USD 5.43 billion, growing at 8.92% CAGR over 2026-2031. Growing smartphone penetration, near-universal fibre coverage, and supportive government programmes create a favourable demand environment. Cross-border parcel agreements with Australia and China cut delivery friction and widen product availability, while payment innovations such as Buy Now Pay Later (BNPL) lift basket sizes and conversion. Retailers respond with integrated omnichannel strategies that blend in-store pickup, same-day delivery, and loyalty data analytics. Intensifying competition from global marketplaces pushes local incumbents to deepen AI-driven personalisation and invest in fulfilment automation.
Key Report Takeaways
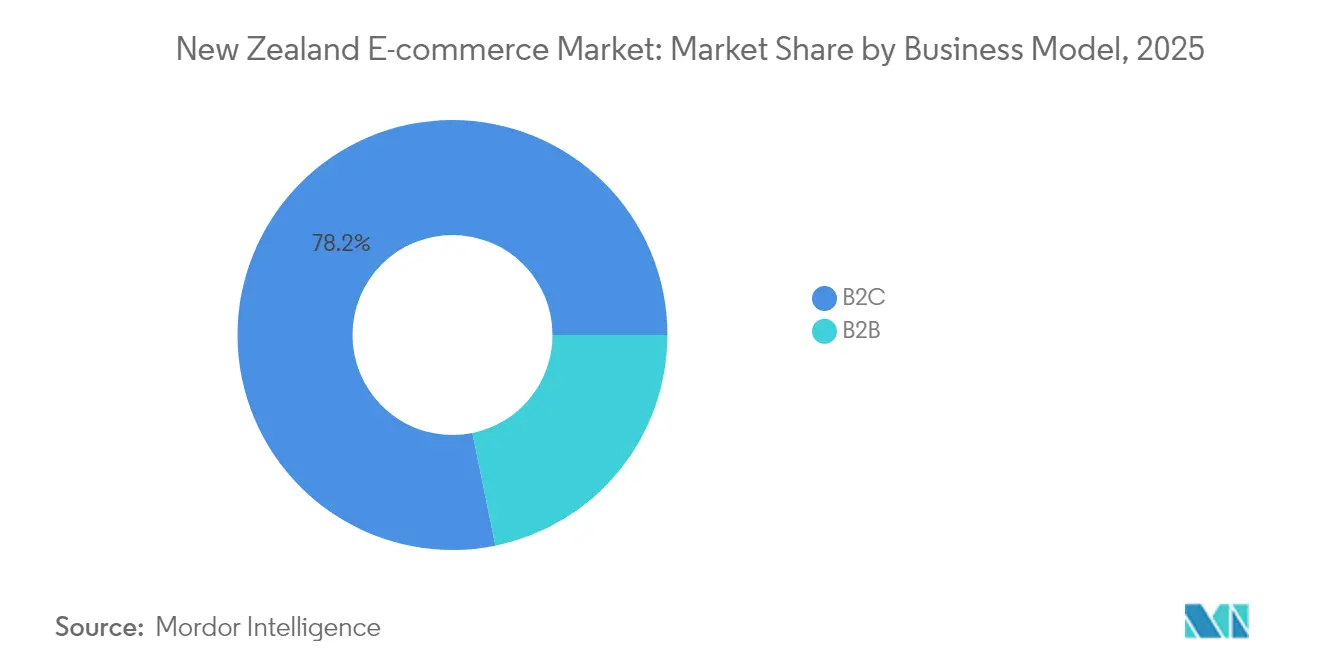
- By business model, B2C transactions led with 78.20% of the New Zealand e-commerce market share in 2025; B2B is expected to expand at an 11.25% CAGR through 2031.
- By device, smartphones accounted for 65.70% of the New Zealand e-commerce market size in 2025, and the segment is projected to grow at 10.12% CAGR to 2031.
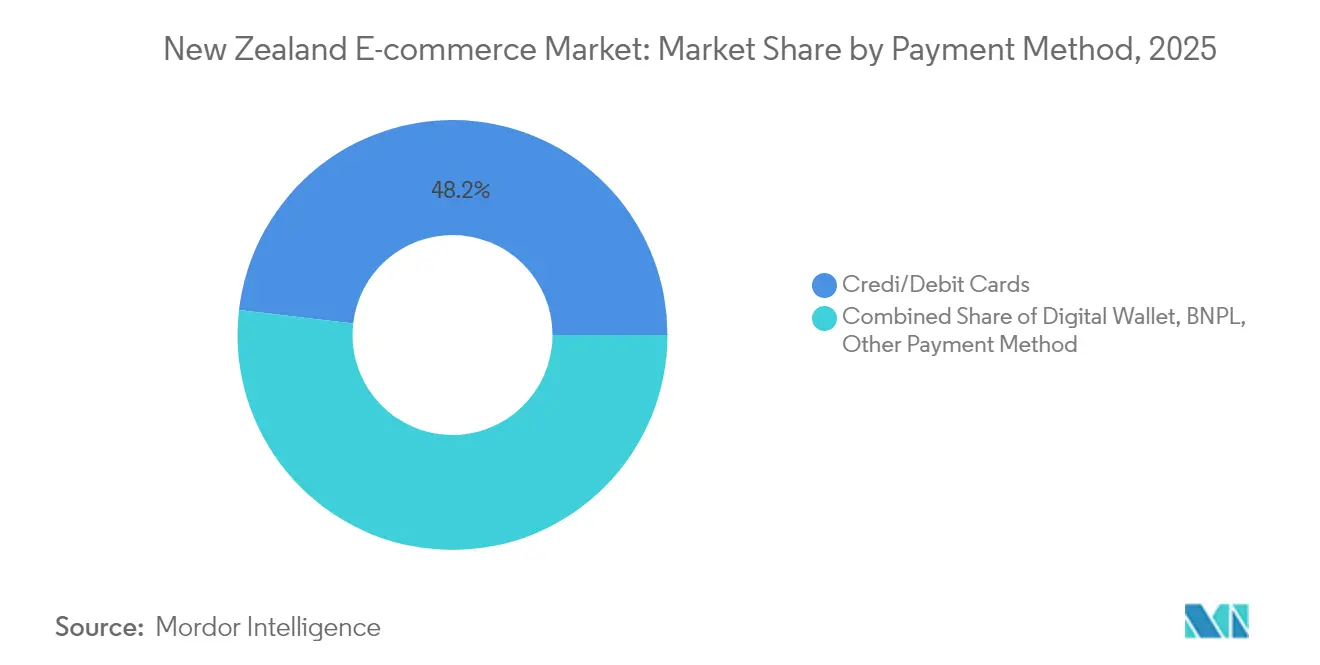
- By payment method, credit and debit cards held 48.15% share of the New Zealand e-commerce market size in 2025, while BNPL is the fastest-growing option at 14.05% CAGR.
- By B2C product category, consumer electronics commanded 17.65% of the New Zealand e-commerce market share in 2025; food & beverage is forecast to post the strongest 13.55% CAGR.
Note: Market size and forecast figures in this report are generated using Mordor Intelligence’s proprietary estimation framework, updated with the latest available data and insights as of 2026.
New Zealand E-commerce Market Trends and Insights
Drivers Impact Analysis*
| Driver | (~) % Impact on CAGR Forecast | Geographic Relevance | Impact Timeline |
|---|---|---|---|
| Growing Penetration of Mobile Commerce Driven by Rural Broadband Expansion | +1.8% | National, with strongest gains in rural South Island and West Coast regions | Medium term (2-4 years) |
| Rapid Adoption of BNPL Fueling AOV Growth among Gen Z | +2.1% | Urban centers (Auckland, Wellington, Christchurch) with spillover to regional areas | Short term (≤ 2 years) |
| Government Digital Boost Programme Accelerating SME Online Migration | +1.5% | National, concentrated in manufacturing hubs (Hamilton, Palmerston North) | Medium term (2-4 years) |
| Cross-Border Parcel Agreements Lowering Shipping Costs from AU & CN | +0.9% | National, with early gains in Auckland, Wellington, Christchurch | Long term (≥ 4 years) |
| Surge in Social Commerce Influencer Marketplace Post-COVID | +1.3% | Urban millennials and Gen Z concentrated in Auckland, Wellington | Short term (≤ 2 years) |
| Advancements in Last-Mile Delivery Robotics in Auckland | +0.6% | Auckland metropolitan area with potential expansion to Wellington | Long term (≥ 4 years) |
| Source: Mordor Intelligence | |||
Growing Penetration of Mobile Commerce Driven by Rural Broadband Expansion
Fixed wireless now supplies 20% of national broadband, overcoming terrain challenges and enabling fast mobile checkout in remote communities.[1] Fibre reaches 87% of households, and urban connection exceeds 78%, so 5G roll-outs can deliver richer media and augmented-reality catalogues.[2] Retailers gain incremental demand as previously underserved shoppers transact via social-commerce apps that embed one-click payment. Improved connectivity also reduces the digital divide, letting regional SMEs list inventories on large marketplaces at low incremental cost. The result is broader geographical demand dispersion and higher frequency of repeat purchases.
Rapid Adoption of BNPL Fueling Gen Z Spending Power
New Zealand’s BNPL user base accelerates as the Credit Contracts and Consumer Finance Act gives providers a clear compliance path that balances innovation with consumer safeguards. Gen Z shoppers embrace pay-in-four plans that remove up-front cost hurdles for electronics and fashion, lifting average order values for merchants. Retailers welcome BNPL because the fee burden is offset by higher conversion and lower cart abandonment. With cards still dominant, BNPL gains represent incremental—not cannibalised—volume, raising total retail sales. Competitive tension among providers leads to loyalty-linked instalment offers that nudge repeat usage across multiple merchants.
Government Digital Boost Programme Accelerating SME Online Migration
The NZD 40 million (USD 23.72 million) Digital Boost allocation gives regional SMEs free training modules, expert mentoring, and co-funded platform builds.[3] Participating firms report shorter sales cycles once integrated with online marketplaces, driving network effects that attract more suppliers. The programme’s outreach to Māori enterprises ensures inclusive growth, widening product diversity online. As SMEs digitise supply chains, demand rises for B2B e-procurement portals, stimulating service providers in logistics, payments, and cybersecurity. The initiative underpins the New Zealand e-commerce market by expanding the seller base and lifting professional standards.
Cross-Border Parcel Agreements Lowering Shipping Costs from AU & CN
The Closer Economic Relations pact removes most tariffs, and the Trade Single Window clears 93.9% of containers before arrival, trimming customs delays. Lower last-mile costs open gateway cities to small retailers that could not previously justify international dispatch. Concurrently, New Zealand brands exploit the same agreements to reach Australian consumers via fulfilment centres in Sydney and Melbourne, diversifying revenue streams. Logistics firms offer bundled cross-border solutions that integrate duty calculation at checkout, enhancing transparency for end consumers. Over time, cost parity between domestic and trans-Tasman shipping intensifies competition, forcing local sellers to differentiate through service and product authenticity.
Restraints Impact Analysis*
| Restraint | (~) % Impact on CAGR Forecast | Geographic Relevance | Impact Timeline |
|---|---|---|---|
| High Coastal Shipping Costs Impeding South Island Delivery | -0.8% | South Island, particularly West Coast and Southland regions | Long term (≥ 4 years) |
| Rising Online Fraud Undermining Consumer Trust despite CERT NZ Efforts | -1.2% | National, with higher impact in urban areas with greater online activity | Short term (≤ 2 years) |
| Fragmented GST Rules on Low-Value Imports for Cross-Border Sellers | -0.7% | National, affecting international e-commerce platforms and cross-border retailers | Medium term (2-4 years) |
| Warehouse Labour Shortages Extending Fulfilment Lead-Times | -0.5% | Auckland, Wellington, Christchurch distribution hubs | Medium term (2-4 years) |
| Source: Mordor Intelligence | |||
High Coastal Shipping Costs Impeding South Island Delivery
Domestic vessels absorb emissions-trading levies not imposed on global carriers, raising per-parcel costs to the South Island. Port infrastructure limits vessel size, hindering economies of scale and extending transit times. Elevated freight bills feed directly into checkout prices for West Coast consumers, muting demand relative to North Island peers. Retailers test micro-fulfilment hubs in Christchurch to shorten last-mile legs, yet inventory duplication pressures margins. Unless coastal shipping gains fuel-cost relief or capacity upgrades, the regional growth gap is likely to persist.
Rising Online Fraud Undermining Consumer Trust despite CERT NZ Efforts
Scam losses neared NZD 200 million (USD 118.62 million) in 2023, and 62% of shoppers encounter fraudulent messages monthly. Phishing remains prevalent even as banks roll out confirmation-of-payee systems and voluntary reimbursement schemes. CERT NZ issues timely alerts, but AI-powered social-engineering attacks evolve quickly, compelling merchants to invest in multi-factor authentication. Heightened anxiety slows adoption among older demographics and first-time buyers, restraining the reachable customer base in the short term. Education campaigns and secure-payment badges aim to rebuild confidence but require sustained effort.
*Our forecasts treat driver/restraint impacts as directional, not additive. The impact forecasts reflect baseline growth, mix effects, and variable interactions.
Segment Analysis
By Business Model: Digital Transformation Redefines B2B Engagement
B2C retained 78.20% of the New Zealand e-commerce market share in 2025, yet B2B volumes are forecast to climb 11.25% CAGR as procurement platforms replace email-based ordering. This divergence means the New Zealand e-commerce market size for B2B transactions could almost double by 2031 if adoption stays on course. Traditional wholesalers digitise catalogues to reach long-tail customers, expanding SKU availability at marginal cost. The Digital Boost Programme lowers barriers by subsidising storefront creation for small manufacturers, thus enriching inventory diversity online.
Enterprises integrate AI-driven demand planning and automated reordering to curtail stock-outs, reinforcing loyalty to digital channels. Cross-border sourcing gains momentum because duty-paid pricing transparency reduces procurement risk. For B2C players, continued omnichannel refinement focuses on leveraging loyalty data to optimise personalised offers. As both models converge on customer-centricity, platform providers that can serve B2C and B2B workflows through a single codebase are positioned to capture incremental revenue streams.

By Device Type: Smartphones Cement a Mobile-First Paradigm
Smartphone commerce generated 65.70% of transaction value in 2025 and is expected to expand at 10.12% CAGR, making it the central channel for the New Zealand e-commerce market. Rising 5G penetration, coupled with fibre backhaul, cuts page-load latency and enables immersive product views that improve conversion. The New Zealand e-commerce market size delivered via mobile could surpass the USD 3.2 billion mark before 2031 if the trajectory holds.
Laptop and desktop sessions remain important for configurable or high-ticket B2B purchases requiring detailed specifications, but even these interactions often conclude on a handset. Retailers optimise progressive-web-app architecture to support offline browsing in rural locations with intermittent coverage. Social-commerce integrations on Instagram and TikTok funnel discovery directly into merchant carts, shortening the path to purchase. Voice assistants and conversational commerce add incremental revenue by capturing spontaneous orders, illustrating that mobile is not merely another screen but the anchor of the entire customer journey.
By Payment Method: BNPL Reshapes Checkout Preferences
Cards retained 48.15% share of the New Zealand e-commerce market size in 2025, but BNPL transactions are rising 14.05% annually, positioning the instalment model to rival credit within the decade. The New Zealand e-commerce market share of BNPL could exceed 20% by 2031 if adoption persists. Regulatory clarity reduces insolvency risk for providers, encouraging product innovation such as subscription-based BNPL for repeat grocery orders.
Merchants experience lower abandonment rates when multiple payment rails are offered at checkout. Digital wallets grow steadily, propelled by tokenised security and smartphone biometric authentication. Looking forward, embedded finance will blur lines between payment and loyalty, letting shoppers accumulate rewards simultaneously with instalment repayments. For acquirers, interchange-fee caps announced by the Commerce Commission may compress margins but also broaden acceptance among small merchants.
By B2C Product Category: Grocery Growth Challenges Electronics Supremacy
Consumer electronics captured 17.65% of the New Zealand e-commerce market share in 2025, buoyed by rapid upgrade cycles and global brand launches. Food & beverage is the growth outlier, set to expand 13.55% CAGR as same-day delivery and cold-chain investments scale nationwide. The New Zealand e-commerce market size for online grocery could reach USD 1.05 billion by 2031 at current run-rates.
Woolworths NZ’s 14.6% first-half 2025 online sales growth validates consumer appetite for convenient, scheduled delivery slots. Meanwhile, fashion leverages influencer-led TikTok campaigns to drive impulse buys, and furniture retailers deploy AR tools that allow in-home product visualisation. Category incumbents experiment with subscription models and dynamic pricing algorithms to maximise lifetime value, recognising that frequency and basket mix vary dramatically by vertical.
Geography Analysis
Auckland anchors the New Zealand e-commerce market with its high population density, international airport, and concentration of fulfilment centres. Wellington follows, driven by public-sector procurement and a strong professional-services base that fuels B2B demand. Christchurch acts as the South Island gateway, and its technology cluster helps offset higher shipping costs through data-driven route planning efficiencies.
Regional broadband initiatives extend fibre to 87% of households and fixed-wireless to remote terrain, ensuring that the New Zealand e-commerce market size expands beyond city limits. As rural connectivity improves, niche artisanal brands from Central Otago and Hawke’s Bay list on national platforms, adding localisation depth. Cross-border trans-Tasman trade remains concentrated in Auckland due to port proximity, but Wellington’s government facilitation accelerates customs clearance.
The Closer Economic Relations agreement reduces tariffs, promoting bi-directional flows with Australia, while the NZ–EU Free Trade Agreement broadens European product availability. However, South Island shoppers still encounter delivery premiums because coastal shipping lacks scale. Micro-fulfilment pilots in Dunedin target faster last-mile service, hinting at future regional parity once cost structures improve.
Regulatory Landscape
New Zealand e-commerce activity sits under economy-wide consumer, privacy, and payments rules, with online sellers (including offshore firms selling into New Zealand) subject to enforcement under the Fair Trading Act and Consumer Guarantees Act by the Commerce Commission. In November 2025, the Commerce Commission v Bachcare judgement reinforced scrutiny of online representations and conduct, while December 2025 interchange fee reductions for regulated cards signaled continued pressure on payment acceptance costs.
The legislative pipeline adds new compliance touchpoints for digital commerce. The Customer and Product Data Bill, progressed through committee work from 2024, sets a consumer data right framework that can be designated sector-by-sector. The Retail Payment System (Ban on Merchant Surcharges) Amendment Bill advanced in 2025 to prohibit surcharges on EFTPOS, Visa, and Mastercard in-store transactions, with an indicated implementation target by May 2026. On the trade side, MFAT continues to anchor digital trade rules through the Digital Economy Partnership Agreement (DEPA), including the January 2026 announcement that discussions for Peru's accession had substantively concluded, supporting cross-border digital trade interoperability for New Zealand merchants.
Value Chain Analysis
The New Zealand e-commerce value chain spans merchants and marketplaces (customer acquisition and merchandising), payments and fraud controls, warehousing and fulfilment, linehaul and last-mile delivery, and returns handling. Common identifiers and standards such as NZBN and GS1 Global Location Numbers (GLN) support onboarding, ordering, and traceability across participants, while cross-border processing depends on coordinated border and documentation workflows that connect merchants, logistics providers, and government agencies.
Operational performance is shaped by domestic logistics capacity and the digitisation of enabling infrastructure. The government's February 2026 Digital Target State framework, led by the Government Chief Digital Officer, advances a standardized Digital Public Infrastructure layer intended to integrate capabilities such as digital identity and AI across service delivery, improving interoperability for commerce-adjacent processes (for example, business onboarding and compliance interactions). On the physical side, demand for industrial property in Auckland has been pulled by e-commerce and outsourced logistics occupiers, while freight constraints, including road quality and reliance on road and air for last-mile, and international ocean-freight volatility remain key cost and service-time variables for online retailers and 3PLs.
Competitive Landscape
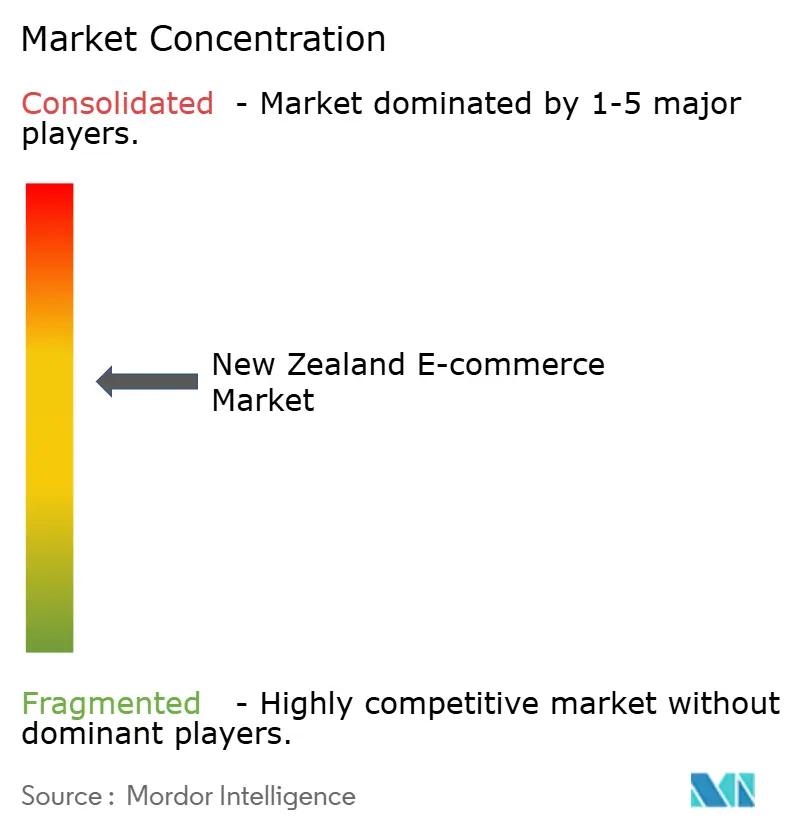
The market displays moderate fragmentation: the top domestic marketplace, Trade Me, generated NZD 369.8 million (USD 223 million) revenue in 2024, but its share has slipped as Amazon and Temu intensify discount-led campaigns. Traditional bricks-and-mortar groups pivot into omnichannel, with Briscoe Group raising online penetration to 19.69% of its NZD 791.5 million (USD 477 million) turnover in 2025.
Technology investment defines winners. Woolworths NZ uses AI route-optimisation and an Everyday Rewards data loop to deliver same-day groceries and upsell private-label products. Logistics challengers, such as Maersk’s Hamilton cold-chain facility, underpin perishable-goods expansion, while fintech entrants enable embedded BNPL at checkout. Payment cost regulation by the Commerce Commission may narrow processing fee spreads, levelling the playing field for smaller sellers.
White-space opportunity exists in rural fulfilment and specialist B2B platforms serving agriculture tech and precision manufacturing. Firms that combine last-mile innovation with sustainable packaging likely secure share as consumer climate awareness grows. Competitive intensity is forecast to heighten as cross-border sellers exploit tariff relief, compelling domestic incumbents to refine value propositions rather than rely on captive geography.
New Zealand E-commerce Industry Leaders
-
Trade Me
-
Fishpond Ltd.
-
Woolworths New Zealand Limited
-
Farmers Trading Co.
-
The Warehouse Group
- *Disclaimer: Major Players sorted in no particular order
Market Opportunities and Future Outlook
Open-banking expansion and payments modernization create near-term whitespace for higher-conversion checkout and B2B purchasing workflows. Amendments took effect on 29 May 2026 to include business banking digital channels within the open banking regime, aligning with the Government's competition agenda and giving merchants, platforms, and fintechs clearer rails for account-based payments and data-enabled credit decisioning. At the same time, the ongoing debate on payment-services regulation and the direction of merchant-surcharge restrictions suggest a market pull for cost-transparent payment acceptance and alternative rails, particularly for SMEs migrating online.
Infrastructure and fulfilment automation are moving from pilot to deployable capacity, supporting richer on-site experiences and faster fulfilment. In July 2026, TenPeaks Data Centres, the rebranded former Spark NZ data center unit, announced plans to invest NZ$3 billion to expand a portfolio of 11 facilities and more than 23MW of capacity. OVHcloud launched an Edge location in Auckland with Datacentre220, improving local low-latency compute options for e-commerce, personalization, and real-time fraud tooling. On the retail operations side, IKEA implemented New Zealand's first retail AutoStore system at its Sylvia Park store in May 2026 to enable high-density robotic picking for online and click-and-collect, pointing to opportunity for other large-format retailers and 3PLs to reduce pick-time and labor intensity as online order volumes scale.
Recent Industry Developments
- July 2026: Zip Co NZ Finance Limited announced an orderly wind down of its New Zealand operations and the cessation of its Pay in 4 product, with spend limits reducing to $0.00 effective 16 August 2026. The move tightens the BNPL competitive set for merchants and shifts checkout mix back toward remaining BNPL providers, cards, and wallets, while also raising the bar for merchant resilience through multiple payment rails.
- April 2026: Cuscal Limited announced an exclusive arrangement to acquire 100% of Paymark Limited (trading as Worldline New Zealand) for A$27 million, targeting completion by 30 June 2026. This deal consolidates a core slice of domestic payments infrastructure under a scale operator, with implications for merchant acquiring capabilities and the rollout cadence of payment innovations relevant to online checkout.
- December 2024: The Commerce Commission issued a draft decision to cap interchange fees, highlighting potential merchant savings estimated in the market context at around USD 260 million annually. Lower regulated fee levels can shift economics for online sellers by improving margin headroom for shipping subsidies, marketplace commissions, and investment in fraud controls and conversion optimization.
Research Methodology Framework and Report Scope
Market Definition and Coverage
For this methodology, the market is defined as the value of goods and services ordered and paid for online by New Zealand residents, covering purchases on local and cross-border websites and apps. Mobile orders are included, and click-and-collect is counted only when payment happens online.
Scope exclusions: This sizing excludes purely digital content downloads and peer-to-peer resale of used items.
Segmentation Overview
- By Business Model
- B2C
- B2B
- By Device Type
- Smartphone / Mobile
- Desktop and Laptop
- Other Device Types
- By Payment Method
- Credit / Debit Cards
- Digital Wallets
- BNPL
- Other Payment Method
- By B2C Product Category
- Beauty and Personal Care
- Consumer Electronics
- Fashion and Apparel
- Food and Beverages
- Furniture and Home
- Toys, DIY and Media
- Other Product Categories
Data Sources, Market Sizing, and Validation
Desk Research
We start by pulling country-level signals that show how much buying activity can reasonably sit online in New Zealand, and how that share is changing. Public sources such as Statistics New Zealand releases, the Reserve Bank of New Zealand payments statistics, and New Zealand Customs trade summaries help anchor consumer demand, import reliance, and price movements that flow into online baskets.
To keep the model grounded in what shoppers do in practice, we also review industry publications such as NZ Post Business IQ eCommerce reporting, plus listed-company annual reports, investor presentations, and reputable press coverage for major sales events and delivery constraints. In a few cases, paid subscriptions for company financials and news are used to standardize revenue disclosures and corporate actions. The desk sources listed here are illustrative only, and many other public references were reviewed for data collection, validation, and clarification.
Primary Interviews and Surveys
Our primary work focuses on validating what is counted as e-commerce GMV in practice, and stress-testing key assumptions like online payment capture and the treatment of click-and-collect. We spoke with a mix of marketplace operators, online-first retailers, logistics partners, and payments-linked experts, covering the main demand centers across New Zealand so gaps from desk findings could be closed and assumptions reconciled.
Distribution of primary research fieldwork respondents
| Company type | Respondent position |
|---|---|
| Top tier: 39% | CXOs: 15% |
| Mid tier: 45% | Functional/Unit leaders: 37% |
| Smaller Players: 16% | Managers: 48% |
Market-Sizing & Forecasting
Sizing begins from the demand pool, where online retail and service spend is reconstructed from New Zealand consumption signals and then filtered through e-commerce participation, payment-online rules, and cross-border ordering behavior. The top-down approach is supported by checks such as online share of retail, average order values, transaction frequency, and the mix shift between local and offshore merchants, then tested against what industry participants see in day-to-day trading.
We also corroborate totals with selective bottom-up approximations, such as sampled retailer GMV ranges, category-level order volume checks, and delivery capacity constraints during peak periods. Where company disclosures are incomplete, gaps are handled through conservative proxying using comparable business models and clearly stated take-rate or conversion assumptions, followed by re-checks with primary respondents. For forecasting, we run scenario analysis off a small set of drivers that can be tracked each year, including household spending trends, inflation and shipping cost pressure, cross-border parcel flows, online penetration changes, and fulfillment speed expectations, with the direction finalized through expert consensus.
Data Validation & Update Cycle
We validate outputs through step-by-step cross-checks, starting with internal consistency tests across spend, transactions, and implied average basket values, followed by review of outliers by a second analyst. When the model shows a sharp jump not supported by independent signals, for example online share changes that conflict with payments indicators, we revisit assumptions and re-contact respondents to confirm what changed.
Reports are refreshed on an annual cycle, with interim updates when a material event shifts demand, pricing, or cross-border buying patterns. Before delivery, we run a final freshness check on key inputs so clients receive an updated view aligned with the latest public releases and interview feedback.
Mordor Intelligence's New Zealand Ecommerce Market Size Compared Against Other Published Estimates
Published market values for New Zealand e-commerce can look far apart because each publisher sets its own definition for what counts as e-commerce, then applies different timing, currency, and transaction coverage rules. Differences also show up when some estimates rely more on retail-only signals, while others blend in services or cross-border orders without a consistent payment rule.
A common gap driver is scope creep into broader online spending, where offline-paid click-and-collect, used-goods resale, or purely digital downloads may be included in some figures. Another reason is how conversion is handled between NZD and USD, since using a single annual rate versus a period-average can shift the reported value, and some sources also mix a calendar-year spend number with a different base year. In this study, broader online-spend figures are separated from paid-online GMV, and Mordor Intelligence counts click-and-collect only when the checkout is completed online and keeps digital downloads outside the total.
Benchmark comparison
| Source | Market Size | Gaps in Research Methodology |
|---|---|---|
| Mordor Intelligence | USD 3.54 B (2026) | |
| Industry Data Platform A | USD 3.94 B (2025) | Uses an online retail revenue framing and can differ on whether services and paid-online rules are applied consistently, and the year alignment (2025 vs 2026) can widen the gap when growth is positive. |
| Parcel and Payments Report B | USD 3.72 B (2024) | Reported as shopper online spending in NZD and not as USD GMV, so the implied USD value depends on the exchange rate timing and can include offshore transactions and card-captured spend that does not match paid-online GMV rules. |
Taken together, the spread mainly comes from what is included around retail-only revenue versus broader online spending, plus how currency timing and base year alignment are treated. By keeping inputs tied to observable signals like online penetration, transaction behavior, and payment-online capture, the final number stays traceable to repeatable steps that buyers can pressure-test.
Key Questions Answered in the Report
What is the current value of the New Zealand e-commerce market?
The market is worth USD 3.54 billion in 2026 and is forecast to grow to USD 5.43 billion by 2031.
Which business model is growing fastest?
B2B e-commerce is advancing at an 11.25% CAGR as enterprises digitise procurement and supply chains.
How important is mobile commerce in New Zealand?
Smartphones generated 65.70% of 2025 online sales and are projected to rise 10.12% CAGR, making mobile the primary shopping channel.
What segment will lead future growth in product categories?
Food & beverage is expected to post a 13.55% CAGR through 2031, driven by same-day delivery and cold-chain investments.
How is regulation influencing payment trends?
Interchange-fee caps and BNPL consumer-protection rules encourage merchants to offer diverse, lower-cost payment options that enhance checkout conversion.
What are the biggest restraints on e-commerce expansion?
High coastal shipping costs to the South Island and rising online fraud both suppress growth, subtracting a combined 2% from forecast CAGR.