Market Overview
| Study Period | 2019 - 2030 |
|---|---|
| Base Year For Estimation | 2024 |
| Forecast Data Period | 2025 - 2030 |
| Market Size (2025) | USD 44.24 Million |
| Market Size (2030) | USD 56.39 Million |
| Growth Rate (2025 - 2030) | 4.98% CAGR |
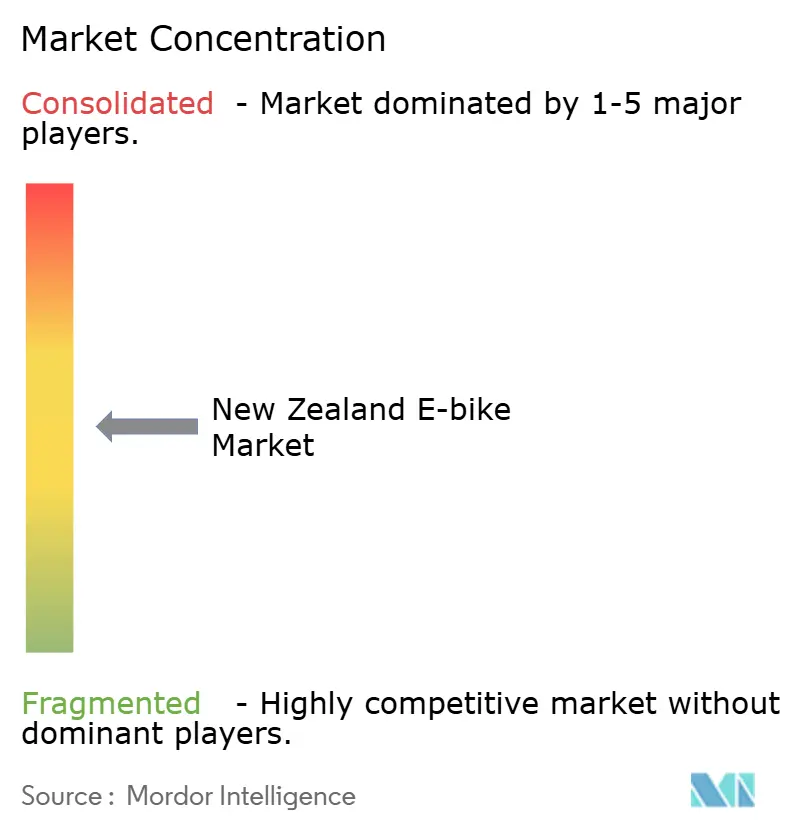
| Market Concentration | Medium |
Major Players*Disclaimer: Major Players sorted in no particular order Image © Mordor Intelligence. Reuse requires attribution under CC BY 4.0. |
|

New Zealand E-bike Market Analysis by Mordor Intelligence
The New Zealand E-bike market size reached USD 44.24 million in 2025 and is forecast to grow at a 4.98% CAGR to USD 56.39 million by 2030. This trajectory signals the shift from early-adopter enthusiasm to mainstream uptake, supported by purchase rebates, tax exemptions, and the government’s target of 10,000 public EV charging points by the end of the decade. Urban congestion pricing proposals, an 80% renewable electricity mix, and falling lithium-ion prices reinforce the value proposition, while the Regulatory Systems (Transport) Amendment Act 2025 raises the non-motor-vehicle power ceiling to 2,000 W, widening the addressable product range.
Key Report Takeaways
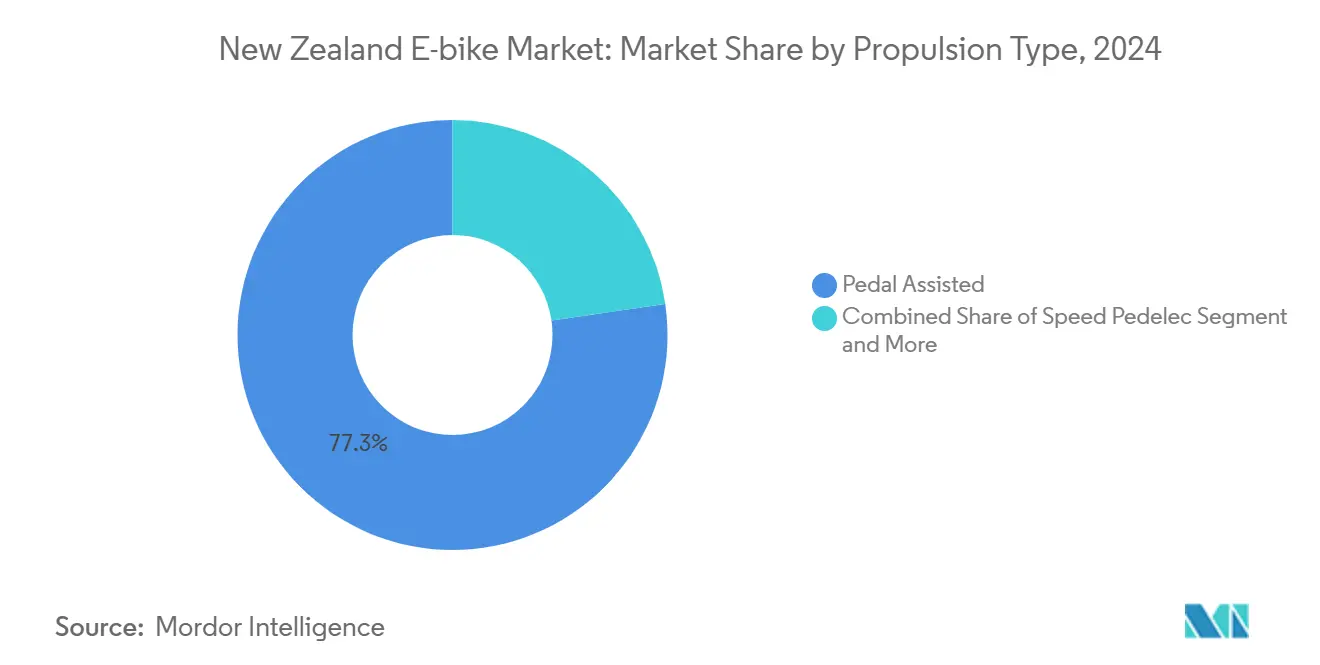
- By propulsion type, pedal-assisted models led with a 77.33% in the New Zealand E-bike market in 2024, whereas speed pedelecs posted the strongest growth at a 21.42% CAGR through 2030.
- By application type, city/urban bikes accounted for 77.41% of 2024 demand, while trekking/mountain units are projected to expand at an 18.69% CAGR to 2030.
- By battery type, lithium-ion technology captured 86.14% share in 2024, and the segment is advancing at a 12.87% CAGR through 2030.
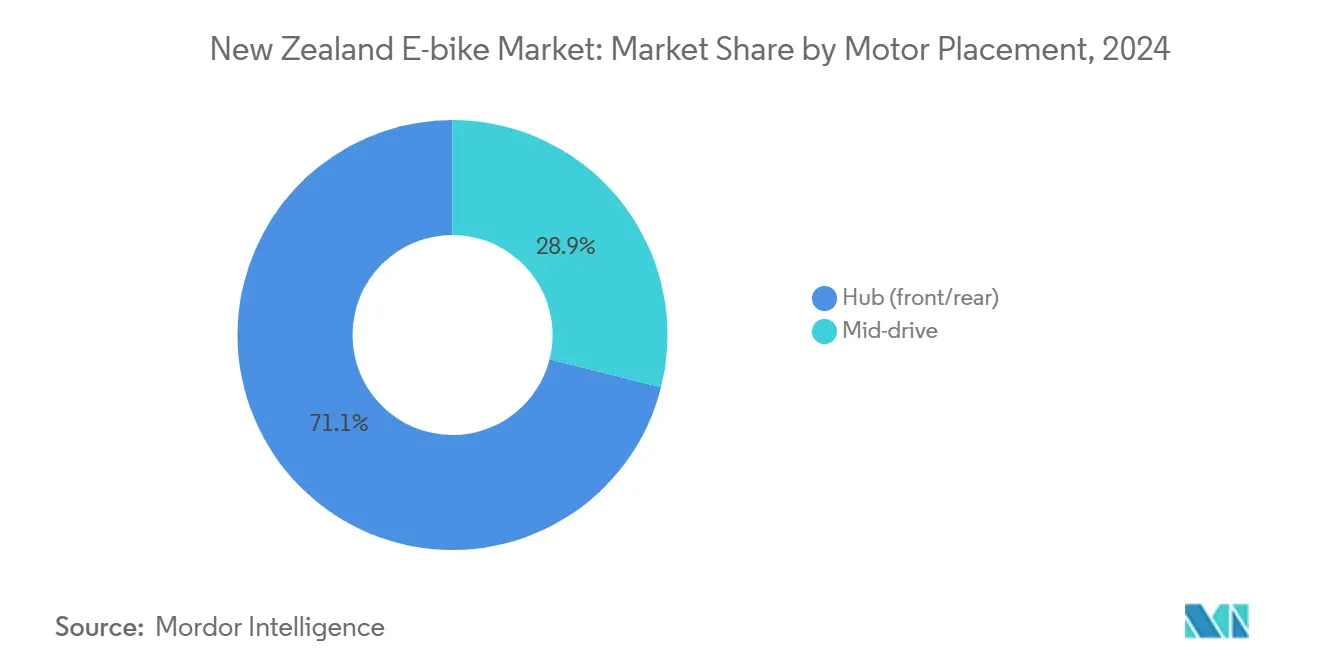
- By motor placement, hub motors held 71.08% of the New Zealand E-bike market size in 2024, while the mid-drive systems are growing at a 15.27% CAGR to 2030.
- By drive system, chain drives led with 66.32% share in 2024; belt drives are the fastest-growing, at a 19.79% CAGR.
- By motor power, units below 250 W represented 53.18% of 2024 shipments, while the 351 to 500 W segment is forecast to climb at a 17.62% CAGR.
- By price band, the USD 1,500 to 2,499 segment commanded 34.11% share of the New Zealand E-bike market size in 2024; USD 2,500 to 3,499 models are set to rise at a 14.23% CAGR.
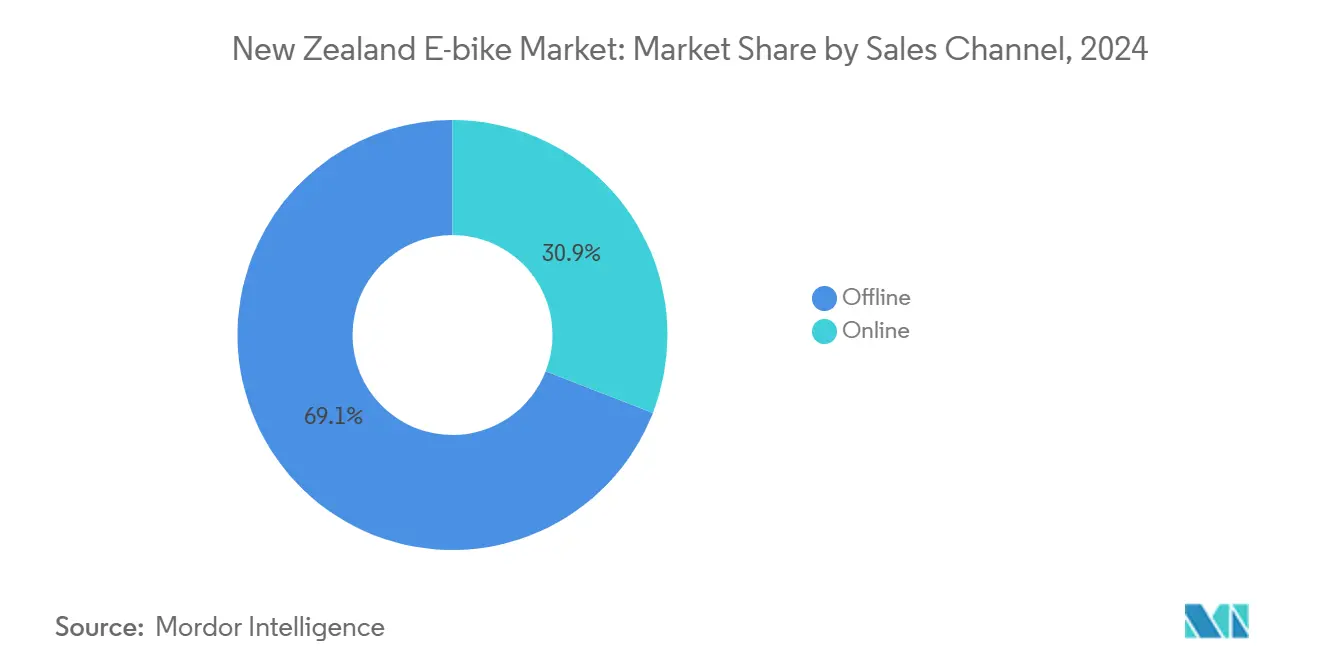
- By sales channel, offline retail generated 69.06% of 2024 value, whereas online platforms are pacing at a 20.15% CAGR.
- By end use, personal and family ownership held 58.43% share in 2024, while commercial delivery fleets are advancing at a 22.49% CAGR.
New Zealand E-bike Market Trends and Insights
Drivers Impact Analysis
| Driver | (~) % Impact on CAGR Forecast | Geographic Relevance | Impact Timeline |
|---|---|---|---|
| Government Purchase Rebates | +1.2% | Nationwide; strongest in Auckland, Wellington, Christchurch | Medium term (2–4 years) |
| Falling Lithium-Ion Battery Cost | +0.8% | Global supply chain influence; local assembly | Long term (≥ 4 years) |
| Urban Congestion and Parking Scarcity | +0.6% | Auckland, Wellington, Christchurch cores | Short term (≤ 2 years) |
| Corporate Fleet Decarbonization | +0.5% | Major business centers nationwide | Medium term (2–4 years) |
| E-Bike Tourism Routes | +0.4% | Queenstown, Rotorua, Bay of Plenty | Medium term (2–4 years) |
| Rising Fuel Prices | +0.3% | Rural and suburban corridors | Short term (≤ 2 years) |
| Source: Mordor Intelligence | |||
Understand The Key Trends Shaping This Market
Download PDF
Government Purchase Rebates and E-Mobility Incentives
Government fiscal support creates compelling economic incentives that directly reduce the total cost of ownership for both individual and fleet purchasers. The fringe benefit tax exemption for employer-provided e-bikes, combined with salary sacrifice schemes offering significant savings, fundamentally alters the value proposition for corporate adoption. EECA (Energy Efficiency and Conservation Authority) fleet transition program provides co-funding for organizations transitioning to low-emission alternatives, creating institutional demand for commercial e-bike fleets[1]"Fleet Transition Programme," EECA (Energy Efficiency & Conservation Authority), eeca.govt.nz. These incentives operate most effectively in urban centers where commuting distances align with e-bike capabilities and charging infrastructure density supports daily use patterns.
Falling Lithium-Ion Battery Cost Curve
Global battery cost deflation transforms e-bike economics by reducing the single most expensive component while improving performance characteristics. Lithium iron phosphate (LFP) battery packs now cost less than USD 100/kWh[2]Teo Lombardo, "The battery industry has entered a new phase," International Energy Agency, www.iea.org, representing a structural shift that enables mass market pricing. The International Energy Agency projects an additional 40% cost decline through 2030, suggesting continued margin expansion opportunities for manufacturers and price reductions for consumers. This cost trajectory particularly benefits New Zealand's market by enabling local assembly operations to compete with fully imported units, as companies like UBCO demonstrate through their partnership with Taiwanese manufacturer TPK Holdings for component sourcing while retaining final assembly domestically. The convergence of lower battery costs with New Zealand's 80% renewable electricity grid creates a compelling environmental and economic value proposition that differentiates e-bikes from internal combustion alternatives.
Urban Congestion and Parking Scarcity
Metropolitan transportation challenges create structural demand for alternative mobility solutions as traditional infrastructure reaches capacity constraints. Auckland Transport's investigation of time-of-use congestion charging save significant amount annually from reduced congestion, with revenue mandated for reinvestment in regional transport infrastructure. This policy framework creates direct economic incentives for commuters to adopt e-bikes as congestion-avoiding alternatives. NZTA research identifying 73 door-related cyclist crashes out of 295 total cycling incidents highlights infrastructure adaptation needs that support e-bike integration into urban transport systems. The government's drafting of congestion charging legislation in 2024 signals institutional commitment to demand management strategies that favor micromobility solutions. E-bikes offer particular advantages in dense urban environments where parking costs and availability constraints make car ownership increasingly uneconomical for short-to-medium distance trips.
Corporate Fleet Decarbonization Commitments
Institutional sustainability mandates drive systematic adoption of low-emission transport alternatives as organizations pursue measurable carbon reduction targets. NZ Post's commitment to achieve 100% fleet electrification by 2025, building on its current electric vehicle adoption rate, demonstrates the scale of corporate demand for alternative transport solutions. The net-zero target by 2050, requiring 42%[3]"Carbon reduction," NZ Post, www.nzpost.co.nz greenhouse gas emissions reduction by 2030, creates procurement pressure for last-mile delivery solutions that can reduce Scope 1 emissions from traditional vehicle fleets. UBCO's success in securing fleet contracts, including trials with NZ Post and the 175-unit Australia Post deployment, validates the commercial viability of utility e-bikes in logistics applications. Corporate adoption patterns suggest that fleet procurement decisions increasingly prioritize total cost of ownership calculations that include carbon pricing and sustainability reporting requirements, creating sustained demand for electric alternatives across commercial applications.
Restraints Impact Analysis
| Restraint | (~) % Impact on CAGR Forecast | Geographic Relevance | Impact Timeline |
|---|---|---|---|
| High Upfront Cost vs. Conventional Bicycles | −0.7% | Price-sensitive segments nationwide | Short term (≤ 2 years) |
| Sparse Rural Charging Infrastructure | −0.4% | South Island and remote districts | Long term (≥ 4 years) |
| 32 km/h Regulatory Speed Cap for Speed-Pedelecs | −0.3% | Nationwide | Medium term (2–4 years) |
| Port-Side Supply-Chain Bottlenecks | −0.2% | Auckland, Tauranga, Lyttelton ports | Short term (≤ 2 years) |
| Source: Mordor Intelligence | |||
High Upfront Cost versus Conventional Bicycles
Price sensitivity remains the primary barrier to mass market adoption, with e-bikes commanding significant premiums over conventional bicycles despite improving value propositions. Evo Cycles' New Zealand retail data shows e-bike pricing ranges from NZ$1,343 (~USD 775) to NZ$18,499 (~USD 10,640), creating affordability challenges for mainstream consumers accustomed to conventional bicycle price points. The USD 1,500-2,499 price band growth indicates consumer concentration in mid-market segments that balance performance with affordability considerations. However, salary sacrifice schemes offering 32-63% cost reductions through employer programs provide pathways to overcome initial price barriers for employed consumers. The challenge intensifies in rural areas where lower population density limits economies of scale for retailers and service networks, potentially constraining adoption rates outside major urban centers.
Sparse Rural Charging Infrastructure
Infrastructure gaps in remote and rural areas create range anxiety and limit practical utility for longer-distance applications beyond urban commuting scenarios. Current public charging infrastructure totals 1,248 chargers nationwide, with 826 in the North Island and 422 in the South Island, highlighting geographic concentration that favors urban adoption. The government's target of 10,000 public charging points by 2030 requires installation rates of approximately 130 chargers monthly, compared to current deployment rates of 21 per month, suggesting infrastructure development may lag demand growth in rural markets. The Great Rides charging infrastructure program addresses tourism applications through targeted installations, but coverage remains limited for general rural transport needs. Rural charging constraints particularly affect utility applications where e-bikes could replace farm vehicles or support remote work activities, limiting market expansion beyond urban and tourism segments.
Segment Analysis
By Propulsion Type: Speed Pedelecs Drive Premium Growth
Pedal-assisted models maintain a dominant 77.33% market share in 2024, while speed pedelecs represent the fastest-growing propulsion segment at 21.42% CAGR through 2025-2030. This growth dynamic reflects evolving consumer preferences toward performance-oriented solutions that can effectively replace car trips for longer commutes and recreational applications. Throttle-assisted variants occupy a smaller but stable market position, appealing to users who prioritize convenience over exercise benefits or regulatory compliance considerations.
The regulatory environment significantly influences propulsion type adoption patterns, with the current 32 km/h speed cap for speed pedelecs creating performance limitations that may constrain growth potential. However, the Regulatory Systems (Transport) Amendment Act 2025 raises the power threshold for non-motor vehicle classification from 600W to 2,000W, potentially enabling more powerful speed pedelecs to operate under simplified regulatory frameworks.
Note: Segment shares of all individual segments available upon report purchase
Get Detailed Market Forecasts at the Most Granular Levels
Download PDF
By Application Type: Trekking Gains on Urban Dominance
City/urban applications command 77.41% market share in 2024, reflecting New Zealand's urbanization patterns and commuting infrastructure development, while trekking/mountain applications accelerate at 18.69% CAGR as outdoor recreation drives premium segment growth. The Great Rides network's attraction of over 1 million annual visitors, with 20% international participation, creates sustained demand for touring and recreational e-bikes capable of handling New Zealand's diverse terrain. Cargo/utility applications serve niche commercial markets, with companies like UBCO demonstrating success in fleet applications through partnerships with postal services and conservation agencies.
Rotorua's mountain biking sector contributed significantly to the local economy in 2021, with 1,153 jobs supported by mountain bike-related spending, illustrating the economic significance of recreational cycling that increasingly incorporates e-bike adoption. The government investment in Great Rides infrastructure improvements over 2025-2026 specifically targets resilience and capacity enhancements to accommodate growing rider numbers, supporting continued trekking/mountain segment expansion. Urban applications benefit from established cycling infrastructure and shorter trip distances that align with current battery capabilities, while trekking applications capitalize on New Zealand's outdoor recreation culture and tourism sector growth.
By Battery Type: Lithium-ion Consolidates Market Leadership
Lithium-ion technology captures 86.14% market share in 2024 while simultaneously representing the fastest-growing battery segment at 12.87% CAGR, demonstrating technology consolidation around superior energy density and declining cost structures. Lead-acid batteries serve price-sensitive applications but face displacement pressure from improving lithium-ion economics, while other battery technologies occupy specialized niches with limited growth prospects. The convergence of market share leadership and growth acceleration in lithium-ion reflects the technology's maturation and manufacturing scale benefits.
Global lithium iron phosphate (LFP) battery pack costs below USD 100/kWh, with Chinese cell prices at approximately USD 53/kWh in 2024, create structural cost advantages that support continued lithium-ion adoption across all price segments. The International Energy Agency's projection of an additional 40% cost decline through 2030 suggests lithium-ion will further consolidate its market position while enabling price reductions that expand addressable market segments.
By Motor Placement: Mid-Drive Systems Challenge Hub Dominance
Hub motors maintain 71.08% market share in 2024 through cost advantages and installation simplicity, yet mid-drive systems accelerate at 15.27% CAGR as performance-conscious consumers prioritize superior hill-climbing capabilities and natural riding dynamics. This shift reflects market maturation as early adopters seek enhanced performance characteristics that justify premium pricing. Hub motors benefit from lower manufacturing costs and reduced maintenance requirements, supporting their continued dominance in price-sensitive segments and urban commuting applications.
Mid-drive systems offer superior weight distribution and gear integration that enhances climbing performance on New Zealand's hilly terrain, creating particular appeal for recreational and touring applications. The technology's higher cost structure limits adoption in entry-level segments but drives growth in premium markets where performance justifies price premiums. Bosch eBike Systems partnership with Rotorua Trails Trust to develop specialized maintenance trailers demonstrates mid-drive systems suitability for demanding utility applications that require sustained power delivery and reliability.
Get Detailed Market Forecasts at the Most Granular Levels
Download PDF
By Drive System: Belt Drive Emerges as Premium Alternative
Chain drive systems dominate with 66.32% market share in 2024 due to cost advantages and widespread familiarity among consumers and service providers, while belt drive systems achieve 19.79% CAGR growth through superior durability and maintenance characteristics. Belt drives appeal to commuters and fleet operators seeking reduced maintenance requirements and longer service intervals, particularly in commercial applications where downtime costs justify premium component pricing. The technology's growth trajectory reflects increasing consumer sophistication and willingness to pay for long-term operational benefits.
Belt drive systems offer particular advantages in New Zealand's variable weather conditions, providing consistent performance and reduced maintenance requirements compared to traditional chain systems that require regular lubrication and adjustment. The technology's adoption in premium e-bike segments aligns with market trends toward higher-value applications where total cost of ownership considerations outweigh initial price sensitivity. Chain drives maintain dominance through established supply chains and service networks, but belt drives capture growth in applications where reliability and low maintenance justify cost premiums, particularly in fleet and commercial segments.
By Motor Power: Mid-Range Power Gains Market Share
Motors under 250W capture 53.18% market share in 2024, benefiting from regulatory clarity and widespread infrastructure acceptance, while 351 to 500W systems accelerate at 17.62% CAGR as consumers seek enhanced performance for demanding applications. This power distribution reflects New Zealand's regulatory framework that treats sub-300W e-bikes as bicycles, avoiding motor vehicle registration and licensing requirements. Higher power segments serve specialized applications requiring enhanced climbing ability or cargo capacity, while lower power options maximize regulatory compliance and infrastructure access.
The upcoming increase in the non-motor vehicle power threshold from 600W to 2,000W under the Regulatory Systems (Transport) Amendment Act 2025 may accelerate the adoption of higher-power systems by simplifying regulatory compliance for performance-oriented applications. Motors in the 251 to 350W range serve mainstream commuting applications that balance performance with regulatory compliance, while systems exceeding 500W target utility and commercial applications where power requirements justify regulatory complexity.
By Price Band: Premium Segments Drive Value Migration
The USD 1,500 to 2,499 price band captures 34.11% market share in 2024, representing the market's center of gravity where performance and affordability considerations converge, while the USD 2,500 to 3,499 segment accelerates at 14.23% CAGR as consumers migrate toward higher-value offerings. This pricing dynamic reflects improving technology capabilities and consumer willingness to invest in superior performance characteristics. Lower price bands serve entry-level adoption, while premium segments above USD 6,000 target enthusiasts and commercial applications requiring specialized capabilities.
Salary sacrifice schemes offering 32-63% cost reductions through employer programs effectively shift consumer purchasing power toward higher price bands by reducing net out-of-pocket costs. This dynamic supports growth in premium segments as workplace programs make higher-quality e-bikes accessible to mainstream consumers who would otherwise purchase lower-specification alternatives. The price band distribution evolution suggests market maturation as consumers develop more sophisticated preferences and willingness to pay for enhanced features, reliability, and performance characteristics that justify premium positioning.
By Sales Channel: Online Gains on Traditional Retail
Offline sales channels maintain 69.06% market share in 2024 through established relationships and service capabilities that support complex product categories requiring demonstration and fitting, while online channels accelerate at 20.15% CAGR as digital commerce capabilities mature and consumer comfort with online purchases increases. This channel evolution reflects broader retail trends toward omnichannel strategies that combine digital convenience with physical service capabilities. Traditional retailers benefit from established service networks and customer relationships that support ongoing maintenance requirements.
The complexity of e-bike products, including battery management, motor specifications, and fit considerations, creates natural advantages for physical retail channels that can provide demonstration and professional fitting services. However, online channels capture growth through expanded product selection, competitive pricing, and convenience factors that appeal to informed consumers comfortable with technical specifications. The University of Auckland's partnership with Ebike Team for staff purchase programs demonstrates institutional channels role in driving adoption through workplace benefit programs. Channel evolution suggests successful retailers will adopt hybrid strategies combining online discovery and ordering with physical service and support capabilities.
Get Detailed Market Forecasts at the Most Granular Levels
Download PDF
By End Use: Commercial Delivery Accelerates Adoption
Personal and family use dominates with 58.43% market share in 2024, reflecting e-bikes' primary role as recreational and commuting alternatives to conventional bicycles and cars, while commercial delivery applications accelerate at 22.49% CAGR driven by last-mile logistics optimization and corporate sustainability commitments. This end-use evolution demonstrates e-bikes transition from recreational products to commercial tools that address specific business requirements. Service providers and institutional users represent smaller but growing segments as organizations adopt e-bikes for operational efficiency and environmental benefits.
UBCO's success in commercial applications, including the 175-unit Australia Post contract and trials with NZ Post, validates utility e-bikes viability in demanding logistics environments. Commercial delivery growth reflects broader trends toward sustainable logistics solutions and urban congestion avoidance that create operational advantages for e-bike deployment. NZ Post's commitment to 100% fleet electrification by 2025 and net-zero emissions by 2050 creates institutional demand for electric alternatives across delivery operations. Personal use applications benefit from government incentives and infrastructure development, while commercial segments drive adoption through total cost of ownership advantages and regulatory compliance benefits.
Competitive Landscape
The New Zealand e-bike market exhibits moderate fragmentation with established global brands competing alongside emerging local innovators, creating dynamic competitive tensions between scale advantages and specialized positioning strategies. International players like Giant, Trek, and Specialized leverage global supply chains and brand recognition, while New Zealand companies such as UBCO and Velduro pursue differentiation through local design capabilities and specialized applications. UBCO's success in securing major fleet contracts, including the 175-unit Australia Post deployment and trials with NZ Post, demonstrates local manufacturers ability to compete on utility and durability rather than pure cost considerations. The competitive landscape increasingly rewards companies that can demonstrate total cost of ownership advantages and specialized capabilities for specific use cases rather than generic product offerings.
Technology integration emerges as a key competitive differentiator, with companies like Velduro partnering with DJI for advanced motor systems and winning international recognition at China Cycle 2025 among 600 competing bikes.
White-space opportunities exist in commercial fleet applications, rural utility markets, and specialized tourism segments where performance requirements and service needs favor companies with deep local market understanding and application-specific engineering capabilities. The regulatory environment under NZTA oversight creates compliance requirements that benefit established players with regulatory expertise while potentially constraining new entrants lacking local regulatory knowledge.
New Zealand E-bike Industry Leaders
-
Accell Group
-
Giant Manufacturing Co.
-
Scott Sports
-
Trek Bicycle Corporation
-
UBCO
- *Disclaimer: Major Players sorted in no particular order
Need More Details on Market Players and Competitors?
Download PDF
Recent Industry Developments
- August 2025: Surron electric trail‑bikes are being adapted in New Zealand for farming and utility use, with local accessory manufacturing and carry‑rack solutions being developed to convert recreational models into work‑duty machines.
- June 2025: The New Zealand Government has announced USD 3 million funding under the Electrifying the Great Rides Fund to support the installation of e-bike charging stations on major trail networks, including the Hawke’s Bay Trails and the Remutaka Cycle Trail.
New Zealand E-bike Market Report Scope
Pedal Assisted, Speed Pedelec, Throttle Assisted are covered as segments by Propulsion Type. Cargo/Utility, City/Urban, Trekking are covered as segments by Application Type. Lead Acid Battery, Lithium-ion Battery, Others are covered as segments by Battery Type.
By Propulsion Type
| Pedal Assisted |
| Speed Pedelec |
| Throttle Assisted |
By Application Type
| Cargo/Utility |
| City/Urban |
| Trekking/Mountain |
By Battery Type
| Lead Acid Battery |
| Lithium-ion Battery |
| Others |
By Motor Placement
| Hub (front/rear) |
| Mid-drive |
By Drive Systems
| Chain Drive |
| Belt Drive |
By Motor Power
| Less than 250 W |
| 251 to 350 W |
| 351 to 500 W |
| 501 to 600 W |
| More than 600 W |
By Price Band (USD)
| Up to 1,000 |
| 1,000 to 1,499 |
| 1,500 to 2,499 |
| 2,500 to 3,499 |
| 3,500 to 5,999 |
| Above 6,000 |
By Sales Channel
| Online |
| Offline |
By End Use
| Commercial Delivery | Retail and Goods Delivery |
| Food and Beverage Delivery | |
| Service Providers | |
| Personal and Family Use | |
| Institutional | |
| Others |
| By Propulsion Type | Pedal Assisted | |
| Speed Pedelec | ||
| Throttle Assisted | ||
| By Application Type | Cargo/Utility | |
| City/Urban | ||
| Trekking/Mountain | ||
| By Battery Type | Lead Acid Battery | |
| Lithium-ion Battery | ||
| Others | ||
| By Motor Placement | Hub (front/rear) | |
| Mid-drive | ||
| By Drive Systems | Chain Drive | |
| Belt Drive | ||
| By Motor Power | Less than 250 W | |
| 251 to 350 W | ||
| 351 to 500 W | ||
| 501 to 600 W | ||
| More than 600 W | ||
| By Price Band (USD) | Up to 1,000 | |
| 1,000 to 1,499 | ||
| 1,500 to 2,499 | ||
| 2,500 to 3,499 | ||
| 3,500 to 5,999 | ||
| Above 6,000 | ||
| By Sales Channel | Online | |
| Offline | ||
| By End Use | Commercial Delivery | Retail and Goods Delivery |
| Food and Beverage Delivery | ||
| Service Providers | ||
| Personal and Family Use | ||
| Institutional | ||
| Others | ||
Need A Different Region or Segment?
Customize Now
Market Definition
- By Application Type - E-bikes considered under this segment include city/urban, trekking, and cargo/utility e-bikes. The common types of e-bikes under these three categories include off-road/hybrid, kids, ladies/gents, cross, MTB, folding, fat tire, and sports e-bike.
- By Battery Type - This segment includes lithium-ion batteries, lead-acid batteries, and other battery types. The other battery type category includes nickel-metal hydroxide (NiMH), silicon, and lithium-polymer batteries.
- By Propulsion Type - E-bikes considered under this segment include pedal-assisted e-bikes, throttle-assisted e-bikes, and speed pedelec. While the speed limit of pedal and throttle-assisted e-bikes is usually 25 km/h, the speed limit of speed pedelec is generally 45 km/h (28 mph).
| Keyword | Definition |
|---|---|
| Pedal Assisted | Pedal-assist or pedelec category refers to the electric bikes that provide limited power assistance through torque-assist system and do not have throttle for varying the speed. The power from the motor gets activated upon pedaling in these bikes and reduces human efforts. |
| Throttle Assisted | Throttle-based e-bikes are equipped with the throttle assistance grip, installed on the handlebar, similarly to motorbikes. The speed can be controlled by twisting the throttle directly without the need to pedal. The throttle response directly provides power to the motor installed in the bicycles and speeds up the vehicle without paddling. |
| Speed Pedelec | Speed pedelec is e-bikes similar to pedal-assist e-bikes as they do not have throttle functionality. However, these e-bikes are integrated with an electric motor which delivers power of approximately 500 W and more. The speed limit of such e-bikes is generally 45 km/h (28 mph) in most of the countries. |
| City/Urban | The city or urban e-bikes are designed with daily commuting standards and functions to be operated within the city and urban areas. The bicycles include various features and specifications such as comfortable seats, sit upright riding posture, tires for easy grip and comfortable ride, etc. |
| Trekking | Trekking and mountain bikes are special types of e-bikes that are designed for special purposes considering the robust and rough usage of the vehicles. These bicycles include a strong frame, and wide tires for better and advanced grip and are also equipped with various gear mechanisms which can be used while riding in different terrains, rough grounded, and tough mountainous roads. |
| Cargo/Utility | The e-cargo or utility e-bikes are designed to carry various types of cargo and packages for shorter distances such as within urban areas. These bikes are usually owned by local businesses and delivery partners to deliver packages and parcels at very low operational costs. |
| Lithium-ion Battery | A Li-ion battery is a rechargeable battery, which uses lithium and carbon as its constituent materials. The Li-Ion batteries have a higher density and lesser weight than sealed lead acid batteries and provide the rider with more range per charge than other types of batteries. |
| Lead Acid Battery | A lead acid battery refers to sealed lead acid battery having a very low energy-to-weight and energy-to-volume ratio. The battery can produce high surge currents, owing to its relatively high power-to-weight ratio as compared to other rechargeable batteries. |
| Other Batteries | This includes electric bikes using nickel–metal hydroxide (NiMH), silicon, and lithium-polymer batteries. |
| Business-to-Business (B2B) | The sales of e-bikes to business customers such as urban fleet and logistics company, rental/sharing operators, last-mile fleet operators, and corporate fleet operators are considered under this category. |
| Business-to-Customers (B2C) | The sales of electric scooters and motorcycles to direct consumers is considered under this category. The consumers acquire these vehicles either directly from manufacturers or from other distributers and dealers through online and offline channel. |
| Unorganized Local OEMs | These players are small local manufacturers and assemblers of e-bikes. Most of these manufacturers import the components from China and Taiwan and assemble them locally. They offer the product at low cost in this price sensitive market which give them advantage over organized manufacturers. |
| Battery-as-a-Service | A business model in which the battery of an EV can be rented from a service provider or swapped with another battery when it runs out of charge |
| Dockless e-Bikes | Electric bikes that have self-locking mechanisms and a GPS tracking facility with an average top speed of around 15mph. These are mainly used by bike-sharing companies such as Bird, Lime, and Spin. |
| Electric Vehicle | A vehicle which uses one or more electric motors for propulsion. Includes cars, scooters, buses, trucks, motorcycles, and boats. This term includes all-electric vehicles and hybrid electric vehicles |
| Plug-in EV | An electric vehicle that can be externally charged and generally includes all-electric vehicles as well as plug-in hybrids. In this report we use the term for all-electric vehicles to differentiate them from plug-in hybrid electric vehicles. |
| Lithium-Sulphur Battery | A rechargeable battery that replaces the liquid or polymer electrolyte found in current lithium-ion batteries with sulfur. They have more capacity than Li-ion batteries. |
| Micromobility | Micromobility is one of the many modes of transport involving very-light-duty vehicles to travel short distances. These means of transportation include bikes, e-scooters, e-bikes, mopeds, and scooters. Such vehicles are used on a sharing basis for covering short distances, usually five miles or less. |
| Low Speed Electric Vehicls (LSEVs) | They are low speed (usually less than 25 kmph) light vehicles that do not have an internal combustion engine, and solely use electric energy for propulsion. |
Need More Details on Market Definition?
Ask a Question
Research Methodology
Mordor Intelligence follows a four-step methodology in all its reports.
- Step-1: Identify Key Variables: To build a robust forecasting methodology, the variables and factors identified in Step-1 are tested against available historical market numbers. Through an iterative process, the variables required for market forecast are set and the model is built based on these variables.
- Step-2: Build a Market Model: Market-size estimations for the historical and forecast years have been provided in revenue and volume terms. Market revenue is calculated by multiplying the volume demand with volume-weighted average battery pack price (per kWh). Battery pack price estimation and forecast takes into account various factors affecting ASP, such as inflation rates, market demand shifts, production costs, technological developments, and consumer preferences, providing estimations for both historical data and future trends.
- Step-3: Validate and Finalize: In this important step, all market numbers, variables, and analyst calls are validated through an extensive network of primary research experts from the market studied. The respondents are selected across levels and functions to generate a holistic picture of the market studied.
- Step-4: Research Outputs: Syndicated Reports, Custom Consulting Assignments, Databases & Subscription Platforms

Get More Details On Research Methodology
Download PDF


