
Market Overview
| Study Period | 2020 - 2031 |
|---|---|
| Forecast Data Period | 2026 - 2031 |
| Base Year Market Size (2025) | USD 572.5 Million |
| Market Size (2026) | USD 614.16 Million |
| Market Size (2031) | USD 873.2 Million |
| Growth Rate (2026 - 2031) | 7.28% CAGR |
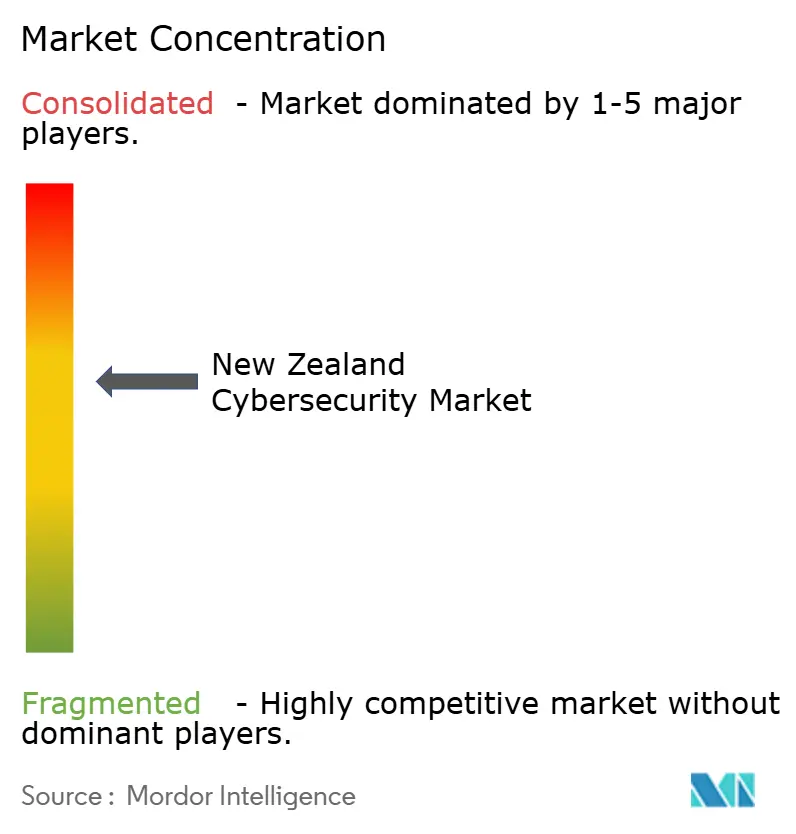
| Market Concentration | Medium |
Major Players *Disclaimer: Major Players sorted in no particular order Image © Mordor Intelligence. Reuse requires attribution under CC BY 4.0. | |
New Zealand Cybersecurity Market Analysis by Mordor Intelligence
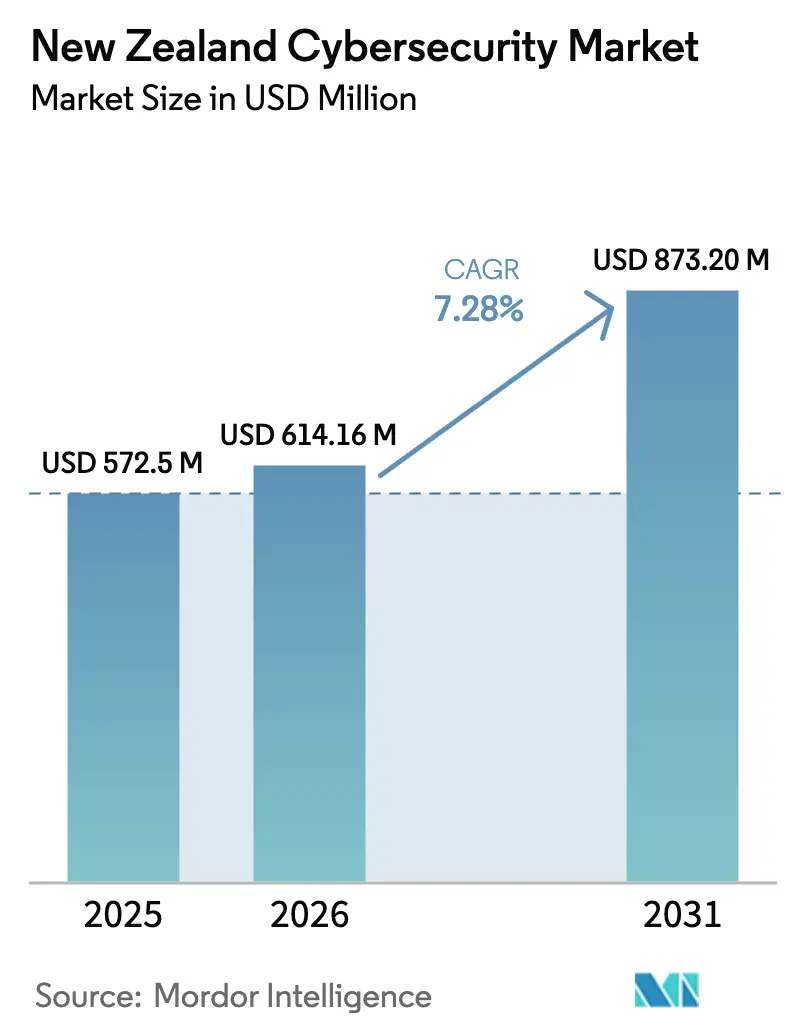
New Zealand cybersecurity market size in 2026 is estimated at USD 614.16 million, growing from 2025 value of USD 572.5 million with 2031 projections showing USD 873.2 million, growing at 7.28% CAGR over 2026-2031. Rising cloud‐first transformations, the first recorded dominance of financially motivated intrusions, and policy mandates that integrate indigenous data sovereignty are together lifting yearly security allocations. Boards now treat prevention and resilience as recurring operating expense, locking in multi-year revenue visibility for vendors while insulating budgets from conventional economic cycles. Intensified regulatory oversight—spanning privacy breach notification to critical-infrastructure directives—has also enlarged the total addressable pool, because every supplier to the Crown must now furnish audited assurance frameworks. With insurers requiring zero-trust evidence before renewing cover, underwriting questionnaires have effectively become sector-wide compliance gatekeepers. These converging forces confirm that the New Zealand cybersecurity market is progressing from episodic project spending to a durable, structurally funded investment path.
Key Report Takeaways
- By offering, services overtook solutions in growth tempo, advancing at 11.1% CAGR to 2031 while solutions retained a 60.12% 2025 revenue lead in the New Zealand cybersecurity market share.
- By deployment mode, on-premise controlled 51.60% of 2025 spend, yet cloud security is the fastest-rising slice at 10.1% CAGR through 2031 as hybrid workplaces normalise.
- By end-user industry, BFSI remained the largest buyer with 27.10% of 2025 revenue, whereas healthcare posts the highest 2026-2031 CAGR at 11.7% after headline ransomware events.
- By end-user enterprise size, large enterprises commanded 69.70% of 2025 spend, but SMEs will grow fastest at 10.4% CAGR as subscription MSSP bundles lower entry barriers.
Note: Market size and forecast figures in this report are generated using Mordor Intelligence’s proprietary estimation framework, updated with the latest available data and insights as of 2026.
New Zealand Cybersecurity Market Trends and Insights
Drivers Impact Analysis*
| Driver | (~) % Impact on CAGR Forecast | Geographic Relevance | Impact Timeline |
|---|---|---|---|
| Government’s 2023 Cyber Security Strategy Stimulating Enterprise Spending | +2.10% | Nationwide; focus on Auckland, Wellington, Christchurch | Medium term (2-4 years) |
| Mandatory Privacy Breach Notification (Privacy Act 2020) Accelerating Adoption | +1.80% | Nationwide | Short term (≤ 2 years) |
| Surge in Ransomware Attacks Affecting Critical Infrastructure and SMEs | +1.50% | Nationwide; acute in healthcare & utilities | Short term (≤ 2 years) |
| Rapid Cloud Migration and Remote Workforce Dependence | +2.30% | Nationwide; strongest in urban centres | Medium term (2-4 years) |
| Cyber-Insurance Premium Inflation Driving Proactive Security Investment | +1.20% | Nationwide | Short term (≤ 2 years) |
| Demand for Zero-Trust Architecture and XDR Platforms | +1.40% | Financial services & public sector hubs | Medium term (2-4 years) |
| Source: Mordor Intelligence | |||
Government’s 2023 Cyber Security Strategy Stimulating Enterprise Spending
The National Security Strategy published in 2023 elevates cyber risk to a core national-security pillar and directs agencies to pursue early action rather than reactive containment [1]Department of the Prime Minister and Cabinet, “New Zealand National Security Strategy 2023,” dpmc.govt.nz. The guidance binds crown entities to specific assurance baselines, which private-sector suppliers must also satisfy to preserve eligibility for contracts. One result is accelerated tender timelines bundling multiyear support, lifting lifetime values for compliant vendors. Local councils now tap co-funding pools patterned on disaster-resilience grants, broadening regional demand. Crucially, the strategy embeds indigenous data stewardship into standard risk-assurance frameworks, so that every new workload touching Māori data invokes culturally aligned governance checks. These aligned incentives enlarge the New Zealand cybersecurity market because compliance becomes a prerequisite to trading with government or its tier-one contractors.
Mandatory Privacy Breach Notification (Privacy Act 2020) Accelerating Adoption
The Privacy Act 2020 obliges organisations to disclose serious breaches within prescribed windows or face penalties. Healthcare outlays rose 22% in 2024 as hospitals linked patient-safety arguments to breach-notification risk, legitimising budget reallocation. Boards therefore install extended detection-and-response (XDR) stacks and commission 24×7 monitoring to document diligence. MSSPs now bundle breach-report templates and regulator-ready artefacts into baseline packages, converting legal exposure into productised features. Planned legislative refreshes that envisage larger monetary fines and biometric-data safeguards will tighten the compliance net further, magnifying downstream demand for process automation and encryption.
Surge in Ransomware Attacks Affecting Critical Infrastructure and SMEs
Financially motivated attackers executed 28% of significant incidents logged by NCSC last fiscal year, outstripping state-linked operations for the first time. Waikato DHB’s protracted outage and Bloom Hearing’s data leak crystallised the business-continuity stakes for boards across sectors. Gen Digital’s Q2 2024 threat report recorded a 24% jump in consumer ransomware within New Zealand, underlining breadth of exposure. Insurers now scrutinise segmentation, immutable backup, and incident-response runbooks before underwriting. Organisations conclude that paying ransoms fails to offset reputational and operational fallout, so prevention budgets soar, reinforcing growth momentum across the New Zealand cybersecurity market.
Rapid Cloud Migration and Remote Workforce Dependence
Remote-work normalisation pushes organisations toward secure-access-service-edge (SASE) overlays bundling network and security functions. Kordia’s 2024 merger of cloud and cyber units typifies supplier moves to capture converged demand. As Microsoft, AWS, and Spectrum Consulting stand up sovereign zones, localisation of control planes boosts consumption of cloud-native posture-management tools. The migration dynamic therefore acts as a structural accelerator for the New Zealand cybersecurity market size trajectory.
Restraints Impact Analysis*
| Restraint | (~) % Impact on CAGR Forecast | Geographic Relevance | Impact Timeline |
|---|---|---|---|
| Acute Shortage of Advanced Cyber Talent Inside NZ | −1.9% | Nationwide; sharper outside tier-one cities | Long term (≥ 4 years) |
| Budget Constraints of SMEs | −1.7% | Nationwide | Medium term (2-4 years) |
| High Reliance on Imported Solutions Exposed to NZD Volatility | −1.1% | Nationwide | Medium term (2-4 years) |
| Fragmented Tooling Creating Integration Complexity | −1.3% | Nationwide | Short term (≤ 2 years) |
| Source: Mordor Intelligence | |||
Acute Shortage of Advanced Cyber Talent Inside NZ
New Zealand requires around 3,500 additional security professionals. SMEs and regional councils struggle to compete for expertise, delaying roll-outs beyond budgeted cycles. Providers compensate by leveraging offshore SOC resources, but that workaround clashes with data-residency promises central to many contracts. Universities have synchronised coursework with international certifications; however, graduation intake still trails demand. The shortage curbs the New Zealand cybersecurity market’s expansion rate because projects stall for people rather than money.
Budget Constraints of SMEs
SMEs compose 90% of domestic SaaS exporters, yet cyber-insurance premiums spiked through 2024, consuming scarce working capital [2]KiwiSaaS, “State of the SaaS Sector 2024,” kiwisaas.com. Banks increasingly bake security posture into credit risk, raising borrowing costs for under-protected firms. Managed service bundles starting at low monthly rates are emerging, but micro-businesses with sub-10 staff still find fees daunting. Uptake therefore remains uneven, muting the otherwise vast SME contribution to overall market growth.
*Our forecasts treat driver/restraint impacts as directional, not additive. The impact forecasts reflect baseline growth, mix effects, and variable interactions.
Segment Analysis
By Offering: Services Narrow the Lead of Solutions
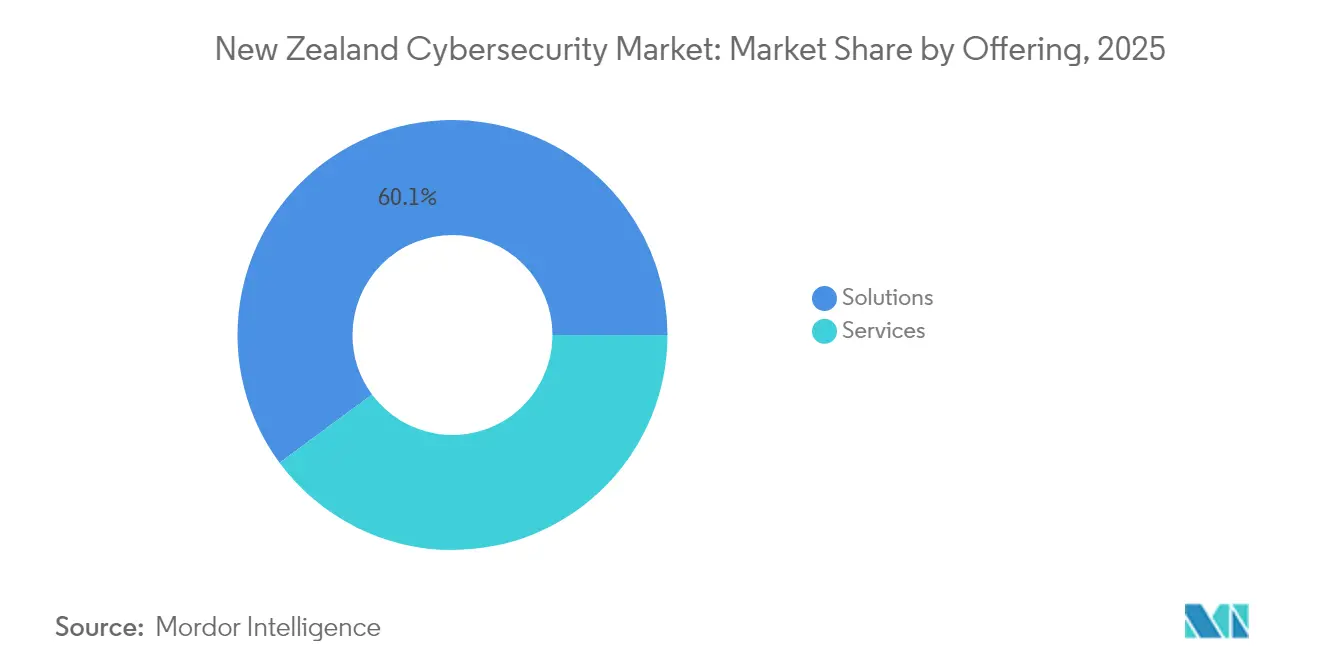
Solutions held 60.12% of 2025 spending, equating to roughly USD 344.3 million of the New Zealand cybersecurity market size. However, services will compound at 11.1% to 2031, steadily eroding the historical solutions lead. Organisations outsource 24×7 monitoring and threat hunting because talent scarcity makes internal operations impractical. MSSPs differentiate by folding privacy-compliance attestations and indigenous governance artefacts into service-level agreements, turning legislative burden into subscription value. Cloud-security and identity-and-access management licences now account for highest solution growth, spurred by zero-trust roll-outs linked to insurance renewals.
Professional-services revenue rises as boards seek strategic risk mapping against evolving directives. Consultants versed in Māori data protocols secure advisory retainers that global majors cannot easily replicate, redistributing fees toward local boutiques. AI-driven analytics, while promising scale efficiencies, still require human validation to curb false-positive fatigue, ensuring ongoing demand for tier-two incident analysts. Hardware gateway refresh cycles flatten as funds pivot to SaaS-delivered controls. Overall, the shift in mix signals that the New Zealand cybersecurity market is converting one-off product margins into dependable service annuities.


By Deployment Mode: Cloud Gains Despite On-Premise Dominance
On-premise architectures held 51.60% of spending during 2025, reflecting entrenched sovereignty sensitivities and sunk data-centre investment. Nonetheless, cloud-based controls are forecast to rise at 10.1% CAGR, elevating their slice of the New Zealand cybersecurity market share beyond 48% by 2031. Adoption typically starts with secure email gateways or identity federation, then expands into full SASE frameworks once trust builds. Indigenous co-governance agreements require providers to host primary and secondary replicas domestically, spurring sovereign-cloud innovation such as Spectrum’s Lantern AI platform.
Legacy appliance vendors hedge by offering virtualised firewalls cross-licensed for major IaaS environments, reducing switching friction. Yet buyers increasingly benchmark them against native-cloud posture tools integrated into hyperscaler consoles. Integration complexity remains purchase-critical: platforms sporting pre-built connectors to Microsoft 365, AWS, or GCP win shorter deployment cycles, which is pivotal for projects racing to hit breach-notification compliance. Cloud adoption therefore acts as both demand generator and competitive filter, shaping evolution of the New Zealand cybersecurity market size.
By End-User Industry: Healthcare Tops the Growth Charts
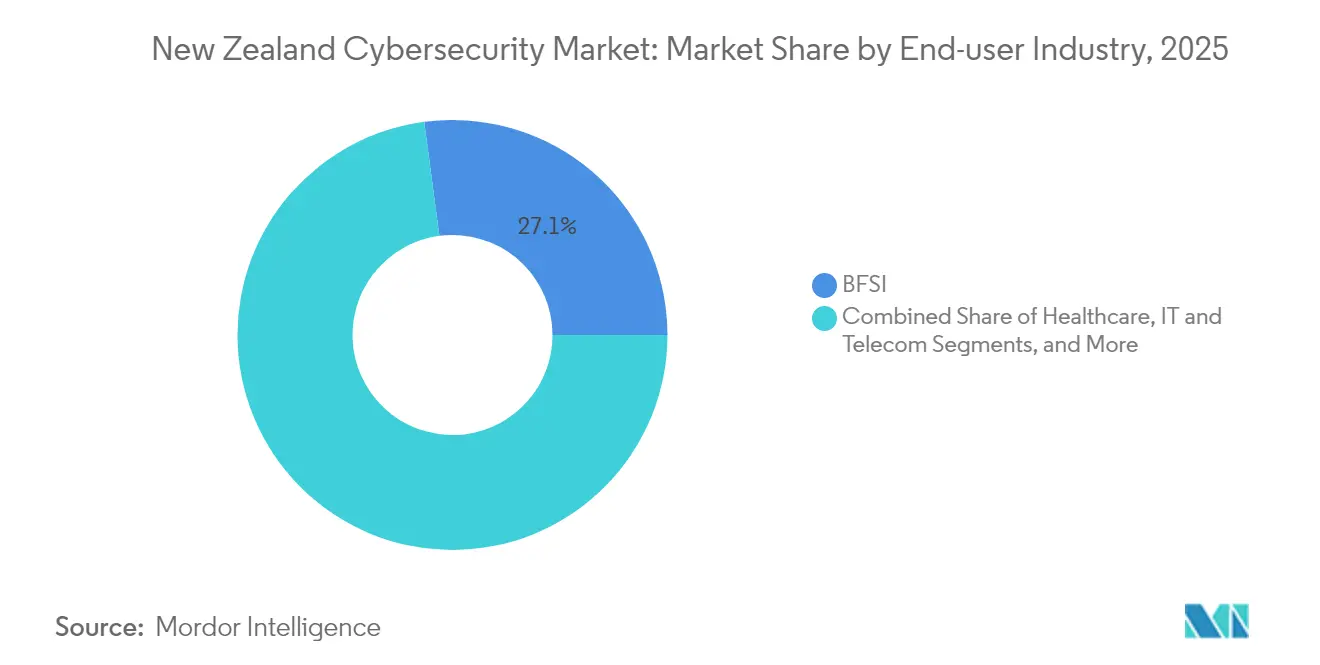
BFSI commanded 27.10% of 2025 spend anchored by stringent prudential oversight and customer trust imperatives. Yet healthcare is forecast to lead expansion at 11.7% CAGR, reflecting post-incident urgency to safeguard patient records and clinical workflows. Waikato DHB’s multi-month recovery became a national case study that linked operational resilience to direct patient outcomes, moving cybersecurity from IT cost to clinical-safety budget.
Government departments wield the National Security Strategy to justify stepped-up investments in secure collaboration platforms that facilitate cross-agency data sharing. Industrial and defence operators prioritise operational-technology visibility, evidenced by Dragos-Yokogawa collaborations embedding threat intelligence into SCADA fabrics. Retail and manufacturing lines deploy supplier-risk solutions to pre-empt cascade breaches that could stall fulfilment. Energy utilities overlay zero-trust on IoT sensors monitoring grid assets, effectively converging cyber and operational reliability. These multi-sector drivers keep the New Zealand cybersecurity market diversified, mitigating over-reliance on any single vertical.
By End-user Enterprise Size: SMEs Fastest-Growing Cohort
Large enterprises delivered 69.70% of 2025 revenue, an expected outcome given their wider digital footprints and regulatory exposure. Even so, SME spend will grow 10.4% CAGR, the highest among size tiers, as subscription MSSP offerings democratise access to enterprise-grade protection. Government co-funding vouchers for export-oriented start-ups offset initial onboarding fees, accelerating uptake. CyberCX and Datacom have launched SME-focused service tiers with simplified dashboards and predictable per-user pricing, making budgeting easier for firms under 100 staff.
A secondary growth lever is customer pressure: multinational buyers increasingly stipulate ISO 27001 or NZISM alignment in supply-chain contracts, forcing SMEs to invest or risk revenue loss. AI-powered toolsets that automate baseline hygiene—patching, MFA enforcement, privileged-access alerts—let small IT teams manage complexity without deep specialist headcount. Collectively, these factors underline that closing the SME adoption gap could add more than USD 100 million incremental spend to the New Zealand cybersecurity market by decade’s end.
Geography Analysis
New Zealand cybersecurity demand naturally clusters within the Auckland–Wellington–Christchurch triangle where headquarters, data centres, and hyperscaler regions reside. Auckland’s role as commercial epicentre generates high-volume MSSP contracts, particularly in transport logistics and retail. Wellington’s dense aggregation of ministries fuels year-round advisory pipelines as agencies align with the National Security Strategy. Christchurch leverages quake-hardened infrastructure and R&D precincts to pilot high-availability disaster-recovery blueprints, exporting those playbooks to Pacific neighbours.
Beyond metro hubs, regional councils in Bay of Plenty and Northland channel central-government co-funding into cyber ranging from secure Wi-Fi projects up to water-utility OT segmentation. Vendors with on-the-ground field engineers gain competitive edge because clients prize rapid site visits during incidents. Indigenous communities in Waikato and Taranaki are asserting control over tribal datasets, prompting on-premise sovereign micro-clouds housed within rohe. This localisation shifts a slice of recurring revenue from international hosts to regional integrators and data-centre co-los, subtly rebalancing the New Zealand cybersecurity market size map.
Cross-border ties with Australia foster trans-Tasman managed-service offerings that treat both nations as one logical coverage zone. While this expands export revenue for Kiwi providers, it also imports competition from Australian MSPs keen on New Zealand growth. Government procurement still privileges domestic capability where sensitive data is involved, but multinational enterprises increasingly negotiate single-contract SOC coverage spanning Sydney and Auckland nodes. The interplay of localisation mandates and regional service consolidation ensures geographic growth remains broad-based rather than strictly urban.
Regulatory Landscape
New Zealand cyber governance blends privacy obligations with sector-specific security oversight, alongside a growing move to formalise critical-infrastructure requirements. The Privacy Act 2020 requires notification of serious privacy breaches, and government buyers typically ask suppliers for evidence of structured security assurance. Telecommunications network security is supervised through the National Cyber Security Centre (NCSC) Regulatory Unit under the Telecommunications (Interception Capability and Security) Act (TICSA), placing telco operators and their technology partners within a defined security compliance framework.
In February 2026, the Department of the Prime Minister and Cabinet (DPMC) published New Zealand's Cyber Security Strategy 2026-2030 and also progressed consultation on enhancing cybersecurity for critical infrastructure, including potential powers to direct entities for national security reasons. For the public sector, GCISO-mandated agencies align to minimum cyber security standards that map to the Protective Security Requirements (PSR) assurance approach, shaping procurement and operational baselines while increasing demand for audit-ready controls, monitoring, and documented incident response capabilities.
Value Chain Analysis
The New Zealand cybersecurity value chain begins with global software and platform vendors providing security controls for identity, endpoint, network, cloud, and data protection. It then moves through local and trans-Tasman distributors, integrators, and managed service providers that package those controls into operational outcomes. Consultancies and specialists support implementation through risk assessments, architecture design, and compliance-aligned documentation, which is then operationalised via managed detection and response (MDR), SOC monitoring, vulnerability management, and incident response retainers.
On the downstream side, local providers such as Datacom and Kordia deliver managed security services and publish benchmarking and threat research, for example Datacom's 2026 Cybersecurity Index survey of New Zealand security leaders and Kordia's annual business cyber security report. Specialist response capabilities are another node in the chain, with providers such as CyberCX offering digital forensics and incident response services, while firms such as PwC provide MDR, threat intelligence, and consulting to align controls with government and industry assurance needs. Telecommunications operators, including Spark New Zealand, function as both critical infrastructure and as connectivity channels, and TICSA obligations influence security requirements across their supplier ecosystems.
Competitive Landscape
Global platform players—IBM, Cisco, Palo Alto Networks—leverage expansive threat-intelligence feeds to pitch integrated stacks, securing multi-year deals with banks and utilities. Domestic specialists such as CyberCX, Kordia, and Datacom counter via deep regulatory fluency, local SOC presences, and culturally competent engagement. Kordia’s unification of cloud and cybersecurity teams in 2024 enabled bundled proposals that deliver lower total cost while ensuring single-throat accountability, a value proposition resonating with mid-market firms.
M&A momentum is rising: Being AI’s partial acquisition of Spectrum Consulting funds development of Lantern AI, a sovereign-cloud platform embedding Māori governance in its control fabric. Start-ups like Watchful attract venture capital for AI-native analytics that promise reduced mean-time-to-detect for SMEs [3]Watchful Security, “Seed Funding Announcement 2024,” watchful.co.nz. These new entrants spur incumbents to refresh product roadmaps, preserving healthy innovation churn inside the New Zealand cybersecurity market.
The acute talent gap forces service providers to automate tier-one SOC tasks; savings are reinvested into premium advisory and penetration-testing practices. Customers, wary of lock-in, value open-standards architectures that ease toolchain swaps. Consequently, cooperative ecosystems—not single-vendor dominance—define competition. With the top six suppliers aggregating 48% revenue, the landscape remains moderately concentrated yet sufficiently open to reward niche differentiation and cultural alignment.
New Zealand Cybersecurity Industry Leaders
CyberCX NZ Ltd.
Kordia Limited
Datacom Group Ltd.
Spark New Zealand Ltd.
PwC New Zealand
- *Disclaimer: Major Players sorted in no particular order

Market Opportunities and Future Outlook
A clear opportunity is in compliance-led programs that extend beyond central government into critical infrastructure operators and their supply chains. The DPMC's Cyber Security Strategy 2026-2030 and the 2026 consultation on strengthening critical infrastructure cybersecurity elevate expectations for incident reporting, risk management, and government direction powers. That combination creates whitespace for governance, risk, and compliance tooling, including evidence generation such as audit-ready logging, reporting workflows, and control attestation, as well as managed services designed for continuous compliance rather than one-off project delivery.
Technology opportunities are converging around cloud-delivered security operations and automated trust, as organisations look to reduce manual workload amid talent constraints and rising threat complexity. Market evidence points to vendors productising these shifts: Kordia launched a unified SASE offer (Secure Edge) with local SOC support, and Datacom partnered with DigiCert to integrate certificate lifecycle management into managed IT services, which supports ongoing demand for automation in identity, encryption, and machine-to-machine trust. Separately, the GCSB refresh of Cryptographic Products Management Infrastructure to prepare for a post-quantum world supports a pipeline of cryptography modernisation work, including crypto-agility assessments, key management upgrades, and procurement-aligned product assurance.
Recent Industry Developments
- June 2026: Datacom Group Ltd. and DigiCert partner to integrate Trust Lifecycle Manager into managed IT services. The collaboration strengthens certificate lifecycle automation in NZ IT services, advancing cloud-native security and automated trust workflows in the NZ market.
- May 2026: CyberCX partners with Barnardos Aotearoa to support digital safety and social services. The collaboration adds cybersecurity capability to the social-services ecosystem in NZ, expanding enterprise-resilience offerings and public-sector alignment in NZ cyber market.
- March 2026: Kordia releases the 10th edition of the New Zealand Business Cyber Security Report. The release provides NZ-specific threat assessment and governance insights, informing market direction and vendor positioning for NZ enterprise cybersecurity.


Research Methodology Framework and Report Scope
Market Definition and Coverage
For this report, the market is defined as spending in New Zealand on cybersecurity products and services that help prevent, detect, and respond to digital threats across enterprise and public-sector users.
Scope exclusions: We exclude general IT hardware, broad IT outsourcing without a security deliverable, and one-time incident costs that are not paid to cybersecurity vendors.
Segmentation Overview
- By Offering
- Solutions
- Application Security
- Cloud Security
- Data Security
- Identity and Access Management
- Infrastructure Protection
- Integrated Risk Management
- Network Security
- End-point Security
- Services
- Professional Services
- Managed Services
- Solutions
- By Deployment Mode
- Cloud
- On-Premise
- By End-user Industry
- BFSI
- Healthcare
- IT and Telecom
- Industrial and Defense
- Retail and E-commerce
- Energy and Utilities
- Manufacturing
- Others
- By End-user Enterprise Size
- Large Enterprises
- Small and Medium Enterprises (SMEs)
Data Sources, Market Sizing, and Validation
Desk Research
Desk research was used to build the starting structure of the market and to keep inputs anchored in real New Zealand context. We referenced public and official sources such as CERT NZ incident reporting and advisories, Statistics New Zealand (economic and business counts), NZ Treasury and agency budget documents, and privacy and critical infrastructure guidance published by regulators.
In parallel, we reviewed company annual reports and investor presentations for relevant local service providers and telecom operators, plus reputable press coverage on breaches, regulatory actions, and major security programs. For cross-checking company scale and deal activity, we also used paid subscriptions that cover company financials and news, along with patent databases for directional innovation signals. The sources named here are illustrative only, and other public documents and datasets were also used during data collection, validation, and clarification.
Primary Interviews and Surveys
Primary work was used to confirm what is actually being bought in New Zealand, how budgets are being allocated across products and services, and how pricing typically moves during renewals. We spoke with a mix of buyers and delivery-side experts, including security leaders in regulated industries, IT operations teams, and channel and consulting practitioners, then used that feedback to refine assumptions that desk research could not reliably answer.
Distribution of primary research fieldwork respondents
| Company type | Respondent position | Region |
|---|---|---|
| Top tier: 29% | CXOs: 16% | |
| Mid tier: 54% | Functional/Unit leaders: 39% | |
| Smaller Players: 17% | Managers: 45% |
Market-Sizing & Forecasting
Sizing starts with a top-down build that reconstructs the demand pool from New Zealand ICT spending and security allocation patterns, then maps that demand to the types of security products and services commonly procured by organizations. Once the mapping is set, we corroborate totals using selective bottom-up checks such as sampled vendor revenue exposure to New Zealand, channel feedback on deal volumes, and an ASP-per-user or ASP-per-site view for common contract types. If the checks do not line up, we adjust the model accordingly.
Key inputs include reported cyber incident patterns and response workload signals, cloud and digital transformation pace across New Zealand organizations, regulatory and assurance requirements that influence baseline controls, the mix of managed services versus tools, and typical contract durations that affect revenue recognition timing. Where direct data is missing, gaps are handled using conservative penetration assumptions validated through interviews, followed by sensitivity checks on pricing and renewal rates.
For forecasting, we used scenario analysis supported by a simple multivariate view, so growth is not driven by a single headline factor. The outlook is guided by how experts expect security services demand, software renewals, and network security refresh cycles to evolve, and then these assumptions are tested against macro and policy signals before the final curve is set.
Data Validation & Update Cycle
Outputs are validated through multiple checks so totals stay realistic and internally consistent. We compare the model results against independent signals such as security and risk management spend references, public incident and advisory activity, and the implied per-organization spending levels, then review the results for outliers.
Before sign-off, assumptions and calculations go through step-by-step analyst reviews. Any large variance triggers follow-up questions with primary respondents to confirm what changed. Reports are refreshed annually, with interim updates when material events occur, and a final pre-delivery review is completed so clients receive the latest updated view.
Mordor Intelligence's New Zealand Cybersecurity Market Estimate Compared With Other Published Estimates
Published values for cybersecurity in New Zealand can look far apart because authors use different boundaries for what counts as security, and they may also mix up spend versus revenue or report different base years and currency timing. The differences tend to widen when one estimate counts only enterprise tools, while another adds broader consulting, risk programs, or adjacent IT services delivered by organizations with security teams.
Security and risk management spend signals and public incident reporting trends are used to keep Mordor Intelligence's estimate tied to a defined cybersecurity vendor revenue scope, rather than a wider risk-management spend bucket. Where estimates diverge, it is often due to how managed security services are treated, whether implementation labor is fully included, how fast prices are assumed to rise during renewals, and how frequently the model is refreshed when major breaches or policy changes happen.
Benchmark comparison
| Source | Market Size | Gaps in Research Methodology |
|---|---|---|
| Mordor Intelligence | USD 572.50 M (2025) | |
| Trade Journal A | USD 472.50 M (2025) | Uses a spend view for information security and risk management that can exclude parts of cybersecurity services delivered under multi-year contracts, and it may not align to vendor revenue timing and renewal cycles. |
| Industry Publisher B | USD 3.36 B (2026) | Applies a much broader scope and aggressive growth assumptions that likely bundle adjacent IT and risk categories into cybersecurity, which inflates totals versus a defined product-and-service market boundary. |
The table shows that the spread is mainly explained by scope and measurement choices, not just math. By keeping inclusions specific, stress-testing pricing and renewal assumptions, and rechecking the outputs against independent signals, the final number stays traceable to steps that can be repeated and reviewed.


Key Questions Answered in the Report
What is the current New Zealand cybersecurity market size?
The New Zealand cybersecurity market size is estimated at USD 614.16 million for 2026.
How fast will the New Zealand cybersecurity market grow through 2031?
It is forecast to expand at a 7.28% CAGR, reaching USD 873.2 million by 2031.
Which segment holds the largest New Zealand cybersecurity market share?
Solutions remain the largest offering segment with 60.12% share in 2025, but services are growing faster.
Why is healthcare the fastest-growing vertical?
High-profile ransomware incidents and stringent privacy rules are driving healthcare security budgets up at 11.7% CAGR.
Page last updated on:






