
New Jersey Data Center Market Size and Share
Market Overview
| Study Period | 2020 - 2031 |
|---|---|
| Forecast Data Period | 2026 - 2031 |
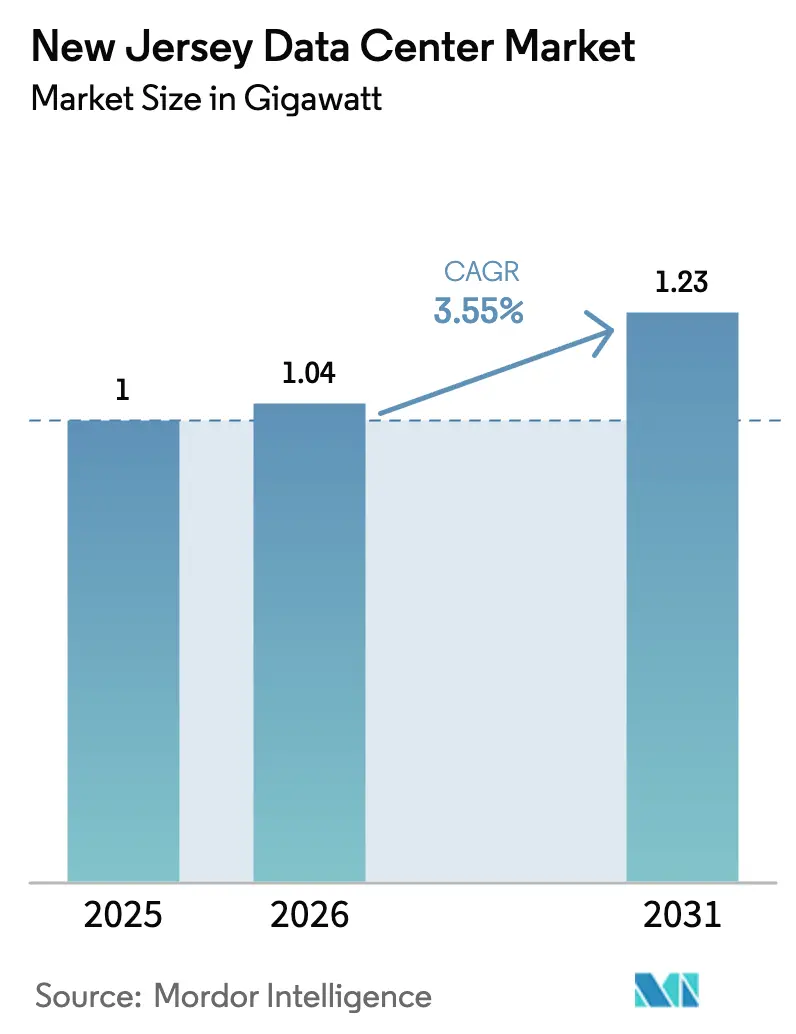
| Base Year Market Size (2025) | 1.0 gigawatt |
| Market Volume (2026) | 1.04 gigawatt |
| Market Volume (2031) | 1.23 gigawatt |
| Growth Rate (2026 - 2031) | 3.55% CAGR |
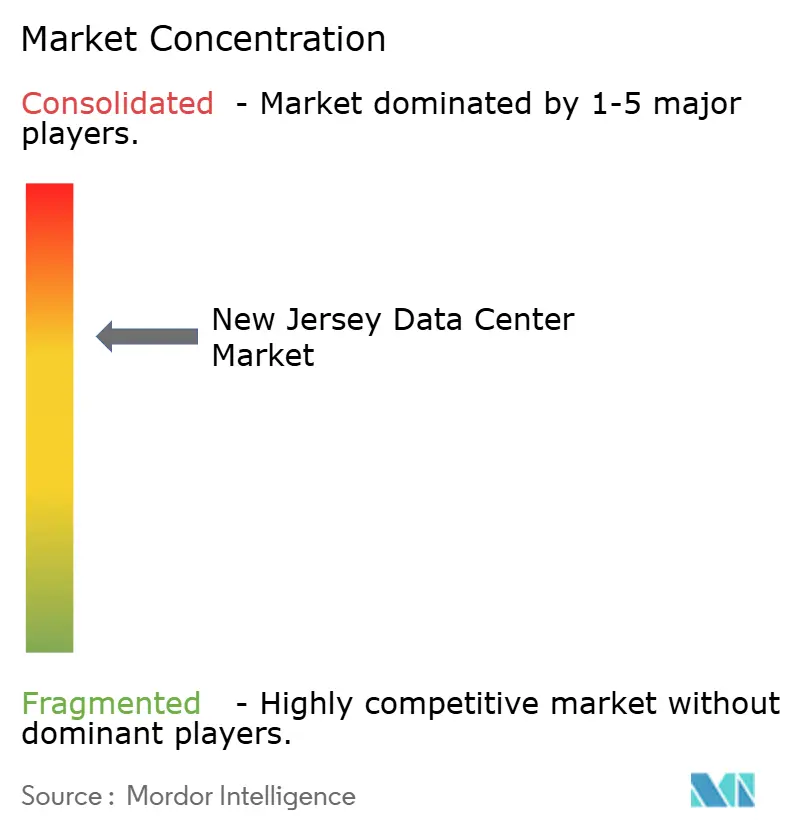
| Market Concentration | Medium |
Major Players *Disclaimer: Major Players sorted in no particular order Image © Mordor Intelligence. Reuse requires attribution under CC BY 4.0. | |
New Jersey Data Center Market Analysis by Mordor Intelligence
The New Jersey data center market size is expected to grow from 1.0 GW in 2025 to 1.04 GW in 2026 and is forecast to reach 1.23 GW by 2031 at 3.55% CAGR over 2026-2031. AI training clusters requiring tens of megawatts per lease are reshaping capital-expenditure priorities, and the entire procurement stack is tilting toward high-density power distribution, direct-to-chip cooling and rapid interconnection datacenterfrontier.com. Submarine-cable proximity in Wall Township, coupled with sub-millisecond fiber routes to Manhattan, has attracted latency-sensitive trading workloads and reinforced the state’s role as the North-East’s international gateway. Meanwhile, a PJM interconnection queue backlog exceeding 4.7 GW underscores how grid-access scarcity can accelerate facility consolidation or joint-venture structures that bundle existing power rights. Legislative moves that link AI data-center tax incentives to renewable-energy sourcing are setting new compliance thresholds and nudging operators toward behind-the-meter solar or wind PPAs.
Key Report Takeaways
- By data-center size, massive facilities held 54.70% of the New Jersey data center market share in 2025, while the mega class is forecast to post the fastest 5.25% CAGR through 2031.
- By tier classification, Tier 3 facilities led with 56.80% revenue share in 2025; Tier 4 deployments are expanding at a 6.12% CAGR to 2031.
- By data-center type, colocation commanded 45.90% share of the New Jersey data center market size in 2025, whereas cloud-service-provider builds are advancing at a 7.05% CAGR.
Note: Market size and forecast figures in this report are generated using Mordor Intelligence’s proprietary estimation framework, updated with the latest available data and insights as of 2026.
New Jersey Data Center Market Trends and Insights
Drivers Impact Analysis*
| Driver | (~) % Impact on CAGR Forecast | Geographic Relevance | Impact Timeline |
|---|---|---|---|
| AI-driven 20-MW+ pre-leasing surge | 1.2% | Northern NJ, Hudson County focus | Medium term (2-4 years) |
| Sub-Atlantic subsea cables landing in NJ | 0.8% | Wall Township, coastal regions | Long term (≥ 4 years) |
| Fin-tech latency arms-race (NY ↔ NJ ≤ 1 ms) | 0.6% | Secaucus, Mahwah corridors | Short term (≤ 2 years) |
| Renewable "behind-the-meter" PPAs | 0.4% | Statewide, utility-scale projects | Medium term (2-4 years) |
| State tax-abatement program NJEDA | 0.3% | Statewide economic zones | Long term (≥ 4 years) |
| Build-to-suit GPU densification >40 kW/rack | 1.0% | AI-focused facilities statewide | Short term (≤ 2 years) |
| Source: Mordor Intelligence | |||
AI-driven 20 MW+ pre-leasing surge
CoreWeave’s USD 1.2 billion Kenilworth project illustrates how GPU cloud providers now secure entire buildings before the first shovel breaks ground, underpinning a wave of speculative construction backed by long-term offtake contracts.[1]CoreWeave, “CoreWeave to convert New Jersey lab building into data center,” datacenterdynamics.comTypical AI racks exceed 40 kW, so developers pre-buy substations and liquid-cooling manifolds, locking in electrical and mechanical designs three quarters earlier than historical norms. This sudden front-loading of capex pushes the New Jersey data center market toward vertically integrated site-selection, where grid-interconnection status carries more valuation weight than real-estate cost. Pre-lease volumes above 60 MW also transfer bargaining power to hyperscalers that demand renewable guarantees or direct fiber into Wall Township’s landing station. The effect cascades into subcontracting tiers, lifting demand for commissioning engineers, immersion-cooling vendors and high-capacity switchgear.
Sub-Atlantic subsea cables landing in NJ
The NJFX campus offers carrier-neutral access to HAVFRUE/AEC-2 and WALL-LI routes, eliminating New York metro cross-connect fees and shaving milliseconds on trans-Atlantic round-trip latency.[2]Alan Mauldin, “NJFX Expands Subsea Hub Connectivity,” submarinenetworks.com Elevation 64 ft above sea level and flood-zone clearance enhance business-continuity credentials, attracting disaster-recovery footprints from financial institutions. Telxius and Windstream backhaul spurs now extend capacity south toward Virginia Beach, weaving New Jersey space into redundant Atlantic mesh topologies. In the longer horizon, data-sovereignty clauses that prohibit data routing through certain jurisdictions are expected to inflate value for diverse U.S. landing points. Consequently, the New Jersey data center market benefits from a structural connectivity moat difficult for land-locked rivals to replicate.
Fin-tech latency arms-race (NY ↔ NJ ≤ 1 ms)
NYSE’s 400,000 sq ft Mahwah engine and Equinix’s NY4 site in Secaucus deliver microsecond order-matching service that trading firms treat as strategic alpha.[3]Yevgeniy Sverdlik, “Equinix NY4 Latency Metrics,” datacenterknowledge.com Dedicated dark-fiber pairs use micro-bending-optimized glass and flat routes to keep round-trip times under 0.8 ms, while switch vendors offer cut-through firmware to minimize serialization delay. Equity traders increasingly co-locate cryptocurrency nodes and low-latency derivatives engines in the same cabinets, concentrating bandwidth-intensive workloads within Hudson County. The New Jersey data center market thus commands premium pricing for contiguous whitespace, and even marginal gains—10 meters of fiber, a single cross-connect hop—justify seven-figure annual fees for sophisticated trading desks.
Build-to-suit GPU densification greater than 40 kW/rack
NVIDIA DGX B200 units consume 14.3 kW each, leading operators to adopt cold-plate loops and rear-door heat exchangers capable of handling 1000 W per square foot. Some greenfield designs in Middlesex County are experimenting with 400 V DC distribution, reducing conversion loss and freeing breaker panel real estate for additional feeds per rack. Immersion cooling can push PUE to 1.03, trimming operating expenses and unlocking more megawatts within fixed transformer envelopes. The densification curve raises procurement complexity, elongating chiller and manifold-fabrication lead times, thereby rewarding incumbents with established vendor stockpiles. Ultimately, next-generation AI racks act as forcing functions, accelerating a state-wide retro-fit cycle that compresses smaller legacy sites into higher-yield high-density footprints.
Restraints Impact Analysis*
| Restraint | (~) % Impact on CAGR Forecast | Geographic Relevance | Impact Timeline |
|---|---|---|---|
| PJM power-queue backlog greater than 4.7 GW | -1.8% | PJM territory, interconnection points | Medium term (2-4 years) |
| 12-24 month transformer lead-times | -0.9% | Statewide, utility infrastructure | Short term (≤ 2 years) |
| Real-estate scarcity in Hudson Co. | -0.6% | Hudson County, prime locations | Long term (≥ 4 years) |
| Water-use restrictions (Passaic basin) | -0.4% | Passaic River watershed | Medium term (2-4 years) |
| Source: Mordor Intelligence | |||
PJM power-queue backlog greater than 4.7 GW
PJM’s queue included 268 GW of generation requests by year-end 2024, yet only a single-digit percentage will reach operation in the near term, creating a mismatch between data-center demand and available capacity. Public Service Electric & Gas recorded 4.7 GW of large-load interconnection inquiries from data-center clients alone, clogging study windows and delaying permits. Retirements of 60 GW of thermal generation exacerbate the crunch because intermittent renewables in the same queue require extra grid-services headroom. Developers that lack executed PJM agreements are therefore forced toward costly on-site gas turbines or battery-backed behind-the-meter solar arrays. This bottleneck shaves nearly two percentage points off the otherwise robust growth slope of the New Jersey data center market.
12–24 month transformer lead-times
Global transformer factories hit full utilization after AI workloads accelerated the scale of substation orders, leaving U.S. purchasers waiting up to two years for custom 30 MVA units. Spot prices for copper and cold-rolled silicon steel added further volatility, and OEMs demanded non-cancellable deposits at design-freeze. Developers seeking dual 138 kV feeds face sequencing hurdles: pushing site excavation schedules forward without certainty on transformer ship dates raises carrying costs and jeopardizes tenant go-live deadlines. Operators with multi-site footprints mitigate exposure by bank-ordering units years in advance, but smaller entrants struggle, slowing their entry into the New Jersey data center market and reinforcing consolidation.
*Our forecasts treat driver/restraint impacts as directional, not additive. The impact forecasts reflect baseline growth, mix effects, and variable interactions.
Segment Analysis
By Data Center Size – Massive facilities anchor AI investment
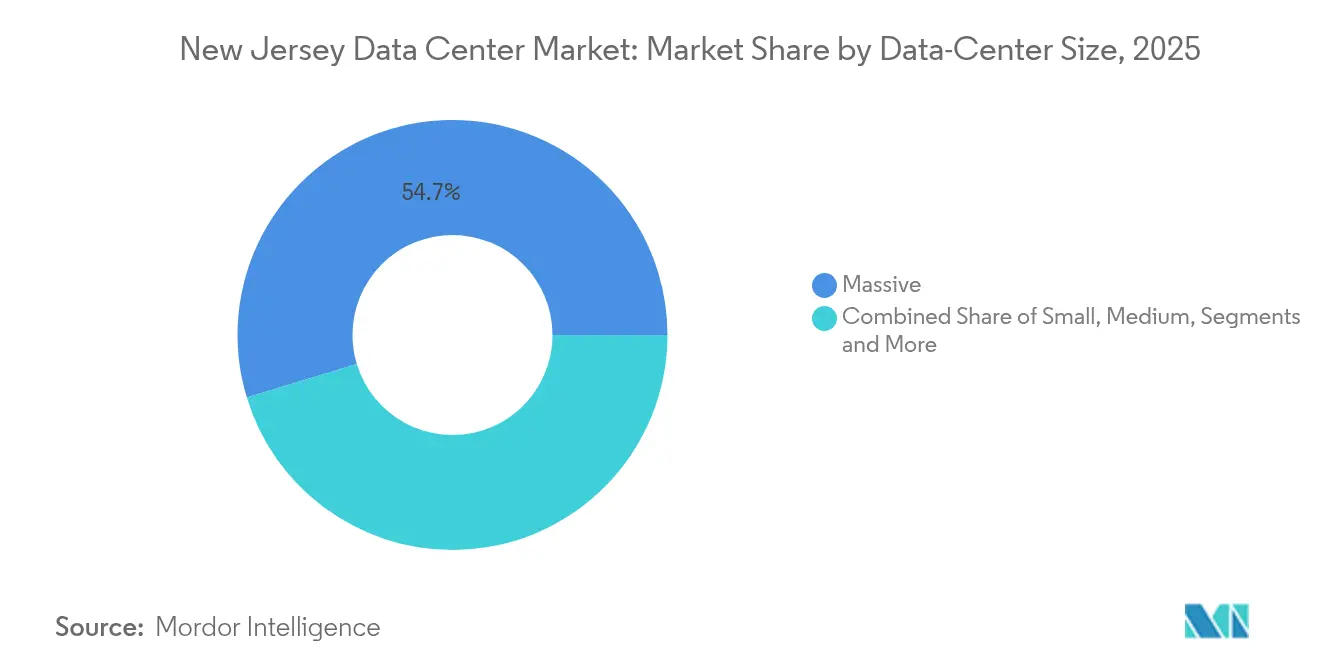
The massive category delivered 54.70% of 2025 revenue in the New Jersey data center market. Hyperscalers cluster multi-story halls and aggregate 80 MW utility feeds, attaining cooling economies that small sites cannot reproduce. This class enjoys ample land parcels in Middlesex and Mercer counties where zoning approvals accommodate multi-building campuses. Mega facilities are projected to record a 5.25% CAGR and will likely tilt the New Jersey data center market size toward fewer but denser campuses between 2026 and 2031.
Smaller footprints still play roles in edge aggregation, content caching and disaster-recovery topologies for mid-market enterprises. However, capex-per-MW spreads favor large-scale builds, especially as power densities rise above 40 kW. CoreWeave’s Kenilworth complex highlights how a single AI tenant can underwrite full-parcel development value, expediting entitlements and locking in renewable-energy PPAs at scale. Consequently, developers redeploy brownfield warehouses into multi-tenant suites only when grid access is pre-existing, limiting expansion pathways for the smallest site classes.


By Tier Classification – Tier 3 dominance under Tier 4 pressure
Tier 3 facilities captured 56.80% of the New Jersey data center market share in 2025, providing concurrently maintainable design without the premium of full fault tolerance. Financial-services and AI workloads, however, are propelling Tier 4 builds at a 6.12% CAGR as users quantify downtime at seven-figure hourly losses.
Exchange venues in Mahwah and Secaucus already exemplify Tier 4 architecture, incorporating dual active electrical paths, 2N+1 generator farms and geo-redundant chillers. The New Jersey data center market size allocated to Tier 4 halls is expected to rise whenever AI-training clusters require power-interruption immunity to avoid expensive model restarts. Conversely, Tier 1 and Tier 2 footprints are relegated to lab sandboxes or non-critical archival storage, setting the stage for future repurposing or retirement of low-tier inventory.
By Data Center Type – Colocation leadership meets CSP acceleration
Colocation accounted for 45.90% of the New Jersey data center market size in 2025, underpinned by interconnection density along the Secaucus-Wall fiber spine. Retail suites permit enterprises to stitch redundancy across multiple carriers, while wholesale wings cater to 2-5 MW blocks sought by SaaS providers.
Cloud-service-provider self-builds, though, deliver the fastest 7.05% CAGR as hyperscalers hunt for lower operating costs and rack layouts optimized for their proprietary liquid-cooling loops. Hybrid strategies such as Equinix xScale or Digital Realty’s Build-to-Suit program blur the lines, letting CSPs assume entire data halls inside otherwise multi-tenant campuses. Over time, the New Jersey data center market will likely converge on mixed-ownership models where retail colocation thrives in gateway buildings and CSP megacamps dominate greenfield parcels in central and southern counties.

Geography Analysis
Hudson County hosts the densest cluster of carrier hotels and finance-oriented facilities and therefore anchors the northern part of the New Jersey data center market . Secaucus, with its direct highway links into Manhattan and redundant substations on Patterson Plank Road, is home to Equinix’s NY4, NY5 and NY6, Digital Realty’s 210 Hudson Street and Coresite’s NY2 and NY3. These buildings enjoy round-trip latencies under 0.8 ms to Wall Street matching engines, a metric decisive for electronic-trading firms that lease high-spec cabinets months in advance.
Limited land availability and rising property taxes in Hudson County are nudging incremental capacity south toward Middlesex and Mercer counties. Here, municipalities like East Windsor and South Brunswick approve 70-acre parcels capable of accommodating 300-MW campuses, while zoning boards offer PILOT (payment-in-lieu-of-tax) structures to attract capital-intensive projects. Developers pivot to repurposed warehouses, leveraging existing 26-ft clear heights for hot-aisle containment retrofits, and pair onsite solar canopies with community-solar credits that offset peak tariffs.
Southern New Jersey, historically peripheral to data-center expansion, is exhibiting early-stage activity due to adjacency to Philadelphia and unused 230 kV transmission corridors. Nebius’s 300 MW campus announcement underscores how AI cloud platforms weigh renewable-energy appetite, labor costs and long-haul fiber routes as much as Manhattan adjacency. Over the next decade, the New Jersey data center market could evolve into a tri-polar geography—Hudson latency hubs, Central megacamps and emerging South Jersey renewable-rich clusters—thereby distributing load stress across multiple utility districts.
Regulatory Landscape
New Jersey data center development is increasingly shaped by electricity-rate and cost-allocation rules overseen by the New Jersey Board of Public Utilities (BPU), alongside state incentive policy changes tied to AI-scale load growth. In July 2026, Governor Mikie Sherrill signed S731/A796, directing the BPU to establish special electric rates and infrastructure cost-sharing requirements for large-load data centers so non-data-center customers are protected from upgrade costs. The framework includes financial assurances and multi-year service commitment requirements for qualifying large-load projects.
Incentives have also shifted. P.L. 2024, c.049 authorized up to USD 500 million in tax credits for AI-focused data centers, while subsequent actions in 2026 (including A5165) sunset the Next New Jersey Program tax credits and redirect USD 250 million of previously authorized incentives toward energy storage and ratepayer relief. In parallel, proposals such as S3379 to require bi-annual reporting of energy and water usage to the BPU add compliance and disclosure obligations that are directly relevant for high-density, liquid-cooled deployments.
Value Chain Analysis
The New Jersey data center value chain starts with site selection and entitlement near transmission access and fiber corridors, then moves into utility interconnection and power procurement within PJM territory, followed by design-build and fit-out for high-density IT loads. Grid-access workstreams, including interconnection studies, substation equipment, and utility upgrade funding, are increasingly gating items alongside long-lead electrical gear such as large transformers, which encourages developers to prioritize sites with existing power rights or to finance upgrades earlier in the project cycle.
On the supply side, colocation and interconnection operators, including Equinix, Digital Realty, CoreSite, DataBank, and CyrusOne, anchor capacity and support services such as cross-connects and carrier diversity. Connectivity to subsea landing infrastructure in coastal New Jersey also strengthens international backhaul options. Downstream, cloud and AI tenants taking multi-megawatt blocks, along with latency-sensitive financial services users concentrated along the Hudson County corridor, pull the chain toward higher-density power distribution and liquid-cooling-capable mechanical systems. Ownership and real-estate control act as a further value-chain lever, with operators converting key facilities from leased to owned assets to stabilize long-term expansion planning and capex timing.
Competitive Landscape
Competition remains balanced among multi-site REITs, carrier-neutral interconnection specialists and AI-focused independent entrants. Digital Realty’s six New Jersey assets span both Hudson and Middlesex counties, and the firm reported a 17× surge in Q4 2024 earnings driven by hyperscale bookings, confirming the margin pull bestowed by high-density deployments. Equinix runs eight IBX sites whose metro-connect fabric links directly to subsea landing stations, giving the company a first-mover advantage in cross-border bandwidth resale equinix.com.
New entrants such as CoreWeave differentiate through vertically integrated GPU clouds, offering pre-configured Kubernetes orchestration and hourly consumption models that lure AI developers away from general-purpose colocation. Meanwhile, joint-venture structures—exemplified by Equinix-PGIM’s USD 600 million vehicle—unlock balance-sheet capacity for land banking near substations already studied by PJM. Technology fronts include immersion-cooling start-ups partnering with incumbents to retrofit legacy rooms, and edge micro-modular vendors positioning 100 kW pods along street-cabinet fiber to support 5G and AR/VR workloads.
Capital requirements, power-contract negotiations and transformer scarcity raise barriers to entry. Operators with multi-state grids can shift energization schedules to match transformer arrival, whereas single-site developers confront idled crews. As AI rack densities double over the coming five years, strategic control over liquid-cooling IP and supply-chain volume discounts will likely consolidate share within the top five providers, yet room remains for specialized niche players targeting ultra-low-latency financial workloads or submarine-cable backhaul services.
New Jersey Data Center Industry Leaders
Equinix Inc.
Digital Realty Trust Inc.
CoreSite Realty Corp.
CyrusOne LLC
DataBank Holdings Ltd.
- *Disclaimer: Major Players sorted in no particular order

Market Opportunities and Future Outlook
A key whitespace sits at the intersection of large-load electrification and policy-driven cost accountability. The July 2026 enactment of S731/A796, with BPU-directed special rates and infrastructure cost-sharing for large-load data centers, clarifies how grid upgrades are funded. That shift supports developers and operators able to underwrite financial guarantees and secure long-term service commitments, while also enabling structured deals around power rights, substation capacity, and redevelopment of sites with existing utility infrastructure.
Connectivity-led opportunities remain tied to New Jersey's low-latency links to Manhattan and its role as an international gateway via coastal subsea-cable adjacency. NJFX in Wall Township has advanced high-density readiness through plans for a 10 MW liquid-cooled AI data hall (Project Cool Water). At the same time, financial-market infrastructure expansion continues in established colocation hubs, including Nasdaq breaking ground in June 2026 on an expansion at Equinix's NY11 facility in Carteret. Alongside capacity announcements, ownership trends reinforce the near-term focus on scalable, power-secure campuses, as shown by CoreWeave's July 2026 acquisition of a Kenilworth data center facility and adjacent land and DataBank's July 2026 purchase of the building housing its EWR2 facility in Piscataway.
Recent Industry Developments
- July 2026: CoreWeave completed the $322 million acquisition of its leased data center facility and a 27-acre parcel at the Northeast Science and Technology Center in Kenilworth, NJ. The acquisition strengthens ownership of high-density capacity near NJ hubs and improves long-term financing and control over power and cooling assets.
- July 2026: DataBank acquired the physical building housing its existing EWR2 data center in Piscataway, NJ, shifting the facility from a leased asset to owned real estate. This move enhances balance-sheet stability and capex predictability, and reduces lease exposure in its New Jersey colocation footprint.
- June 2026: Nasdaq broke ground on a data center expansion at Equinix's NY11 facility in Carteret, NJ, doubling the footprint of Nasdaq's existing infrastructure at the site. The expansion increases capacity to support cloud and edge workloads and reinforces New Jersey as a regional interconnection and low-latency hub.


Research Methodology Framework and Report Scope
Market Definition and Coverage
This market covers the installed and planned data center capacity located within New Jersey, measured as IT power capacity and linked build activity. It includes facilities used for enterprise, colocation, and cloud workloads, and it reflects capacity that is commissioned or reasonably committed based on project pipelines.
Scope exclusions: It excludes office IT rooms that are not operated as dedicated data center facilities, and it excludes telecom-only central office switching sites where third-party data center services are not the primary use.
Segmentation Overview
- By Data Center Size
- Small
- Medium
- Large
- Massive
- Mega
- By Tier Type
- Tier 1 and 2
- Tier 3
- Tier 4
- By Data Center Type
- Cloud Service Providers (CSPs)
- Enterprise, Modular and Edge
- Colocation
- Utilized
- Colocation Type
- Retail
- Wholesale
- Hyperscale
- End User
- Cloud and IT
- Telecom
- Media and Entertainment
- Government
- BFSI
- Manufacturing
- E-Commerce
- Other End User
- Colocation Type
- Utilized
Data Sources, Market Sizing, and Validation
Desk Research
Desk work starts with building a clean inventory view for New Jersey and then tying it back to power and construction signals that can be checked from public records. Useful inputs come from sources such as the U.S. Energy Information Administration (electricity pricing and fuel mix), the U.S. Census Bureau (construction activity context), and U.S. EPA programs (grid emissions factors used in some buyer requirements). For local grounding, we also review state and utility filings, planning and zoning disclosures where available, and reported interconnection or transmission updates that affect energization timelines.
On the industry side, we read company filings, investor decks, and press coverage to capture announced builds, commissioning milestones, and any changes in design density that shift MW per square foot expectations. We also use paid subscriptions for company financials and intelligence, patent databases, and shipment-level import and export signals when they help validate equipment lead times and delivery cycles. The desk sources listed here are illustrative and not exhaustive, and other public documents are used for data collection, cross-checking, and clarification.
Primary Interviews and Surveys
Primary work focuses on validating the New Jersey supply pipeline and the timing assumptions that desk sources rarely match on, including when power is actually available to the site. We speak with a mix of facility developers, operators, engineering and construction voices, and large end users to pressure-test commissioning schedules, pricing direction, and average rack density (which drives MW utilization).
Because this is a New Jersey specific study, interviews are centered on local market dynamics, and then cross-checked with broader US operator perspectives to confirm that the demand drivers we hear are not limited to a single project story.
Distribution of primary research fieldwork respondents
| Company type | Respondent position | Region |
|---|---|---|
| Top tier: 27% | CXOs: 16% | APAC: 41% |
| Mid tier: 54% | Functional/Unit leaders: 36% | EMEA: 33% |
| Smaller Players: 19% | Managers: 48% | Americas: 26% |
Market-Sizing & Forecasting
Sizing is built around a top-down reconstruction of the New Jersey capacity pool, where known operational inventory is combined with the under-construction and planned pipeline to arrive at annual GW totals. In practice, the model is organized by facility status and then adjusted for expected energization timing, which is influenced by utility interconnection progress and construction lead times. To keep the totals realistic, we corroborate the output using selective bottom-up checks like sampled facility MW announcements, operator roll-ups for key campuses, and simple MW-per-building reasonability tests.
A few practical inputs are used repeatedly because they explain most of the year to year movement in this market. These include commissioned IT load (MW), planned and under-construction capacity (MW), average rack density trends tied to AI and high-performance computing, vacancy and pre-lease direction as a signal of near-term absorption, and power availability constraints that can delay delivery even when a building is ready. Forecasting is run with scenario analysis anchored to the pipeline, and then timing and utilization assumptions are tuned based on what we hear from primary experts about permitting cycles, transformer lead times, and grid queue behavior. Where project details are incomplete, we apply conservative placeholder ranges for MW and in-service year, and those are revisited during validation so the forecast does not get pulled by a single unconfirmed build.
Data Validation & Update Cycle
Outputs are validated through multiple checks so the final series does not depend on one data stream. We compare model totals against independent signals like published inventory and pipeline summaries, utility and grid updates, and visible commissioning announcements, and then investigate any large variance before sign-off. When the model shows a sudden jump or drop, the underlying driver is traced back to a small set of inputs, and follow-up calls are triggered if the change is not supported by project evidence.
A second analyst review is done to re-check arithmetic, unit conversions, and timing logic, and then the narrative is aligned to the numbers. Reports are refreshed annually, with interim updates when material events occur such as major project cancellations, power allocation changes, or policy shifts affecting build permits. Before delivery, a fresh pass is completed to ensure clients receive an updated view based on the latest available public and primary inputs.
Mordor Intelligence's New Jersey Data Center Market Sizing Compared With Other Published Estimates
Published estimates for New Jersey data centers often vary because each publisher uses a different unit focus, a different facility cutoff, and a different way of timing capacity that is only planned. Some sources also blend New Jersey into the wider New York metro, which can inflate totals if the state line is not applied consistently.
Retail colocation revenue and managed hosting fees sit outside Mordor Intelligence's scope for this report, which is why our base year is expressed as installed and pipeline IT power in GW, and not a sales value that depends on pricing and occupancy assumptions. The largest gaps usually come from how planned MW is treated, whether utility-constrained sites are counted as deliverable capacity, and how aggressively density uplifts from AI racks are applied into the forecast years.
Benchmark comparison
| Source | Market Size | Gaps in Research Methodology |
|---|---|---|
| Mordor Intelligence | USD 1.00 B (2025) | |
| Real Estate Advisory A | USD 0.53 B (2025) | Uses reported operational inventory signals (MW) as the main proxy and does not clearly separate commissioned capacity from the planned pipeline, which typically understates the forward capacity pool. |
| Industry Brief B | USD 1.24 B (2026) | Rolls planned and announced projects into near-term totals with limited visibility on interconnection timing, and it can overstate deliverable capacity when grid constraints push energization out by multiple quarters. |
The comparison mainly shows that the spread is driven by scope and timing, not by arithmetic differences. When capacity is tracked as commissioned versus planned, and when energization risk is treated explicitly, the market size stays traceable to a few repeatable variables that can be checked year after year.


Key Questions Answered in the Report
What is the projected capacity of the New Jersey data center market by 2031?
The market is expected to reach 1.23 GW of installed IT load capacity by 2031, reflecting a 3.55% CAGR.
Which facility-size segment leads the state’s data center landscape?
Massive data centers held 54.70% revenue share in 2025 and remain the dominant segment as AI workloads scale.
How fast are Tier 4 facilities growing in New Jersey?
Tier 4 deployments are expanding at a 6.12% CAGR through 2031, driven by financial-services and AI reliability demands.
What share do colocation facilities hold in the market today?
Colocation sites accounted for 45.90% of the New Jersey data center market size in 2025.
Why are PJM interconnection backlogs a concern for developers?
More than 4.7 GW of large-load requests are queued, delaying grid access and dampening market growth by an estimated 1.8% of CAGR.
How is state legislation influencing energy sourcing for AI data centers?
A pending bill (S-4143) requires AI-oriented facilities to procure power from clean-energy sources, pushing operators toward renewable PPAs.
Page last updated on:






