
Neurological Disorder Drugs Market Size and Share
Market Overview
| Study Period | 2020 - 2031 |
|---|---|
| Forecast Data Period | 2026 - 2031 |
| Market Size (2026) | USD 105.44 Billion |
| Market Size (2031) | USD 151.09 Billion |
| Growth Rate (2026 - 2031) | 7.46 % |
| Fastest Growing Market | Asia Pacific |
| Largest Market | North America |
Major Players *Disclaimer: Major Players sorted in no particular order Image © Mordor Intelligence. Reuse requires attribution under CC BY 4.0. | |
Neurological Disorder Drugs Market Analysis by Mordor Intelligence
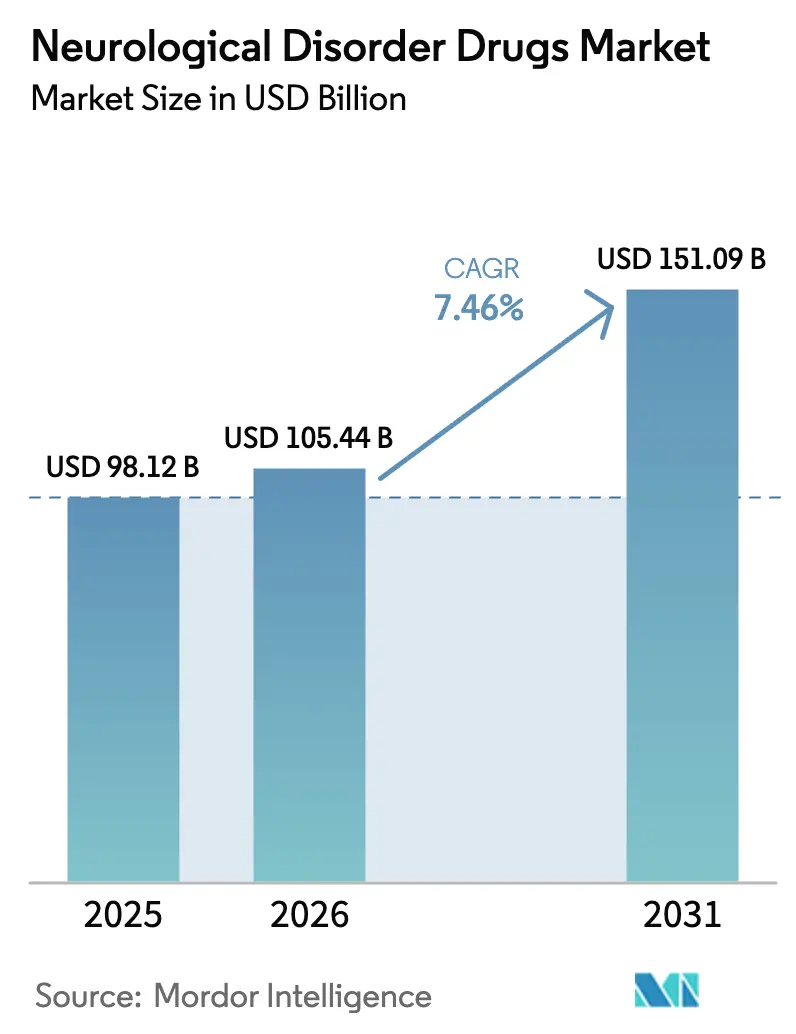
The neurological disorder drugs market size was valued at USD 98.12 billion in 2025 and estimated to grow from USD 105.44 billion in 2026 to reach USD 151.09 billion by 2031, at a CAGR of 7.46% during the forecast period (2026-2031). Demographic ageing, breakthrough disease-modifying approvals, and artificial-intelligence-enabled discovery pipelines are the three structural forces widening access to advanced therapeutics across every major indication. Regulatory agencies are sustaining the growth trajectory by applying accelerated approval pathways, a stance illustrated by the full approvals of Leqembi and Donanemab for Alzheimer’s disease. Digital health adoption is simultaneously reshaping distribution economics, while patent-cliff pressures between 2025 and 2029 are opening space for biosimilars that can reach patients faster across cost-sensitive geographies. In parallel, capacity expansions in sterile injectable manufacturing are becoming a competitive differentiator as supply chain resilience joins safety and efficacy as a front-line purchase criterion.
Key Report Takeaways
- By indication, Alzheimer’s disease led with 28.67% of the neurological disorder drugs market share in 2025; rare & orphan neurological disorders are forecast to expand at an 8.01% CAGR through 2031.
- By drug class, antiepileptics commanded 24.01% share of the neurological disorder drugs market size in 2025; CGRP monoclonal antibodies are projected to rise at an 8.29% CAGR to 2031.
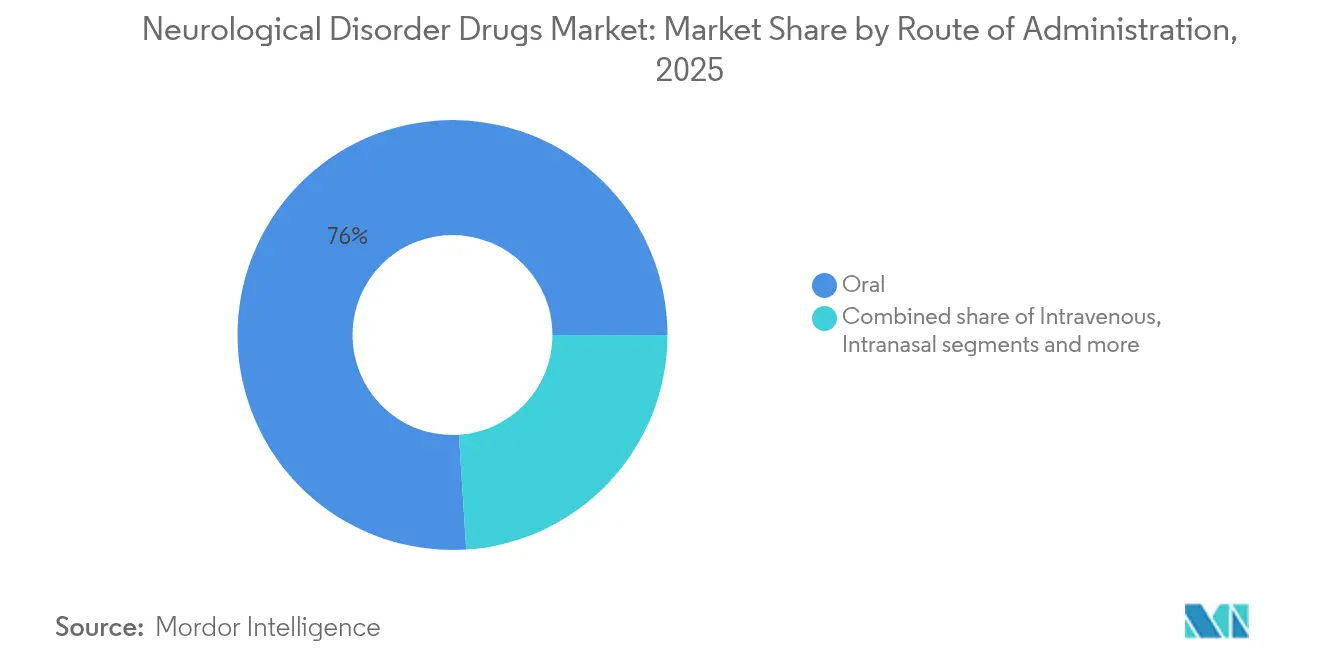
- By route of administration, oral formulations accounted for 76.02% share in 2025, while intranasal delivery platforms are set to grow at an 8.35% CAGR through 2031.
- By distribution channel, hospital pharmacies captured 53.21% share in 2025; online pharmacies are advancing at a 8.54% CAGR to 2031.
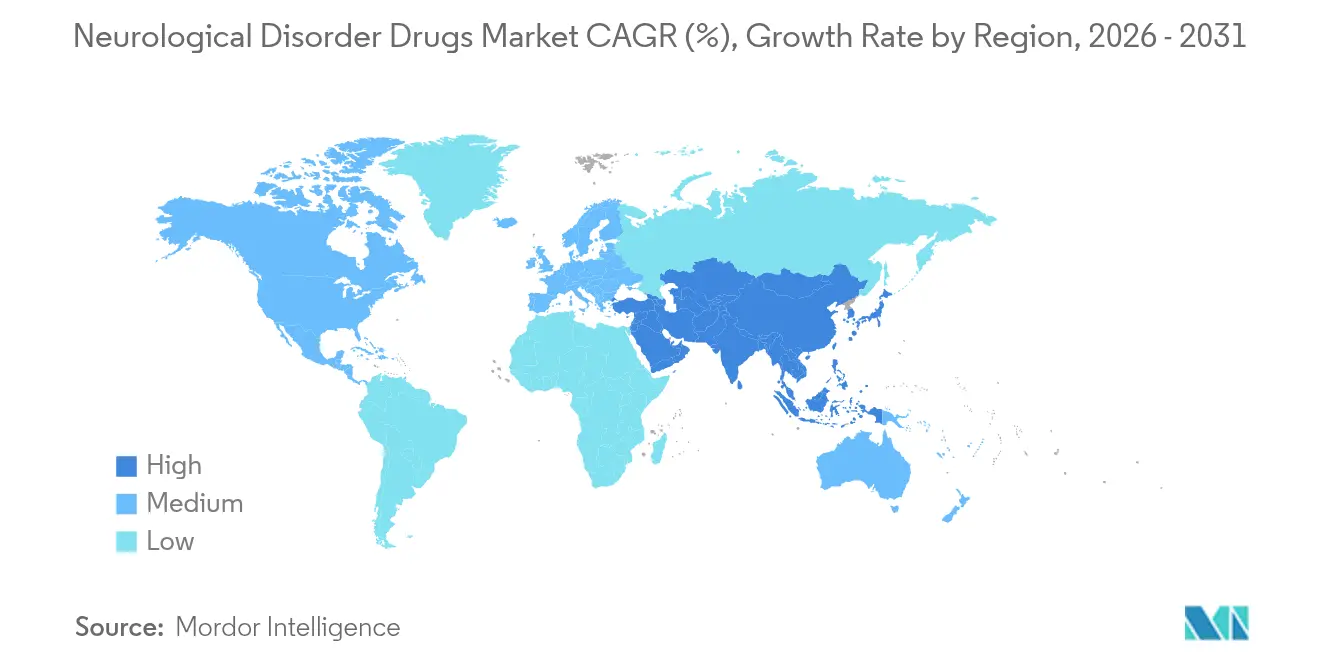
- North America held 39.35% share of the neurological disorder drugs market size in 2025, whereas Asia-Pacific is progressing at a 8.70% CAGR to 2031.
Note: Market size and forecast figures in this report are generated using Mordor Intelligence’s proprietary estimation framework, updated with the latest available data and insights as of 2026.
Market Trends and Insights
Drivers Impact Analysis of Neurological Disorder Drugs Market*
| Driver | (~) % Impact on CAGR Forecast | Geographic Relevance | Impact Timeline |
|---|---|---|---|
| Ageing population & rising prevalence of CNS disorders | +1.8% | Global; strongest in North America & Europe | Long term (≥ 4 years) |
| Breakthrough disease-modifying approvals (Leqembi, Donanemab) | +1.2% | North America & EU; expanding to APAC | Medium term (2-4 years) |
| Expansion of orphan-drug incentives | +0.9% | Global; highest in North America | Medium term (2-4 years) |
| AI-enabled neuro-drug discovery | +0.7% | Global; led by US & EU hubs | Long term (≥ 4 years) |
| Novel BBB & intranasal delivery platforms | +0.6% | Global; early uptake in developed markets | Medium term (2-4 years) |
| Venture funding surge in psychedelic-assisted neurotherapeutics | +0.4% | North America & EU | Short term (≤ 2 years) |
| Source: Mordor Intelligence | |||
Ageing Population & Rising Prevalence of CNS Disorders
Longer life expectancy is increasing the absolute number of patients with chronic neurological illnesses, a trend most visible in high-income economies where individuals aged ≥ 60 will represent more than 30% of the population by 2050[1]. Europe already reports 6.9 million Alzheimer’s cases, a figure that could double before mid-century, prompting insurers to reimburse earlier and costlier interventions. Similar prevalence curves are appearing in Parkinson’s disease, epilepsy, and multiple sclerosis, allowing manufacturers that expand regional production to secure first-mover volume advantages. Governments are also financing preventive screening that paradoxically lifts diagnosed prevalence and enlarges the addressable pool for therapeutics. The direct economic burden is pushing regulators to accelerate approvals, tightening the feedback loop between scientific discovery and bedside adoption and thereby supporting sustained expansion of the neurological disorder drugs market.
Breakthrough Disease-Modifying Approvals Drive Market Confidence
Leqembi’s full approval and Donanemab’s positive Phase III data have proven that amyloid-targeting pathways can achieve clinical and commercial success, validating high-risk neurodegenerative targets. Revenue ramp-ups have signaled strong payer acceptance despite high list prices, emboldening capital markets to back next-generation disease-modifying candidates across Huntington’s disease, ALS, and frontotemporal dementia. The European Medicines Agency revised its earlier stance on Leqembi, highlighting regulators’ willingness to re-assess benefit-risk when unmet need is compelling. Companies are reacting by accelerating time-to-submission strategies and intensifying global Phase III enrolment, moves that shorten commercialization cycles and further enlarge the neurological disorder drugs market.
Expansion of Orphan-Drug Incentives Accelerates Rare-Disease Development
Targeted laws such as the ACT for ALS Act and enhanced tax credits now underwrite early research, enabling smaller biotechs to advance niche neurological programs otherwise deemed uneconomic. Successful launches of Ztalmy and Skyclarys confirm that rare neurology can deliver blockbuster-level returns when exclusivity and pricing converge. Big Pharma is responding with acquisition mandates that secure first-in-class assets and specialized medical-science liaisons for ultra-orphan engagement. Improved registry data are also de-risking trial design by clarifying natural history endpoints, thereby pushing the neurological disorder drugs market toward precision-sized sub-markets that still carry premium margins.
AI-Enabled Neuro-Drug Discovery Transforms Pipeline Development
Machine-learning models now match genomic and proteomic signatures to druggable targets, aiding discovery in pathologies notorious for complex etiology. The EMA’s draft reflection paper on AI has given developers a framework for validating algorithms, effectively mainstreaming computational approaches. Cerevance’s NETSseq platform, already partnered with Merck, exemplifies how AI shortens target-ID cycles and reduces false positives[2]. As productivity improves, pipeline breadth is rising without proportional cost escalation, expanding the investable universe within the neurological disorder drugs market.
Restraints Impact Analysis of Neurological Disorder Drugs Market*
| Restraint | (~) % Impact on CAGR Forecast | Geographic Relevance | Impact Timeline |
|---|---|---|---|
| High late-stage attrition & R&D costs in CNS | -1.4% | Global; highest in US & EU | Long term (≥ 4 years) |
| Wave of blockbuster patent expiries (2025-29) | -1.1% | Global; concentrated in developed markets | Short term (≤ 2 years) |
| Supply shortage of cGMP neuro-APIs & sterile injectables | -0.8% | Global; acute in North America | Medium term (2-4 years) |
| Source: Mordor Intelligence | |||
High Late-Stage Attrition & R&D Costs Create Development Barriers
Neurology maintains the lowest Phase III success rate among major therapeutic areas, hovering near 30% compared with 58% for oncology. Complex endpoints, placebo effects, and heterogeneous pathophysiology drive median program costs above USD 2 billion, throttling smaller companies reliant on single assets. Investors, still wary from high-profile Alzheimer’s failures, require co-development risk-sharing that dilutes upside. Large firms mitigate through diversified portfolios, but the absolute spend siphons resources from early exploratory programs, dampening near-term asset flow into the neurological disorder drugs industry.
Patent Cliff Pressures Intensify Competitive Dynamics
Blockbusters across epilepsy, multiple sclerosis, and migraine will relinquish exclusivity before 2029, slicing in branded sales and triggering generic erosion. Payors already implement automatic substitution when chronic therapies fall below copay thresholds, pressuring innovators to launch line-extensions or fixed-dose combinations. While biosimilars expand access, they compress price corridors and can restrain top-line growth inside the neurological disorder drugs market—at least until next-wave disease-modifying agents backfill revenue gaps.
*Our forecasts treat driver/restraint impacts as directional, not additive. The impact forecasts reflect baseline growth, mix effects, and variable interactions.
Neurological Disorder Drugs Market Segment Analysis
By Indication:
Alzheimer’s Scale Paired with Rare-Disease VelocityAlzheimer’s disease generated 28.67% of neurological disorder drugs market revenue in 2025 on the back of high-ticket disease-modifying launches. The platform is widening as payers approve biomarker-confirmed early-stage use, anchoring premium ASPs and elevating the overall neurological disorder drugs market size. In the same period, rare & orphan neurologic diseases grew fastest, advancing at an 8.01% CAGR owing to orphan-drug exclusivity and public-grant co-funding. The differential growth rates signal portfolio-balancing value: broad-based Alzheimer’s drugs produce predictable volume while smaller, high-exclusivity disorders deliver margin upside.
Pipeline readouts in Huntington’s and Rett syndrome illustrate how niche indications can pivot to non-dilutive financing, allowing firms to monetize science before peak-sales maturity. Across Parkinson’s and epilepsy, incremental innovation—such as extended-release L-dopa and third-generation sodium-channel blockers—sustains mid-single-digit growth but cedes relative share to high-impact disease-modifiers. Migraine continues its biologics-driven transformation, as CGRP inhibitors expand prophylaxis beyond triptan non-responders, reinforcing multi-brand coexistence under roomier clinical guidelines. Collectively, indication diversity hedges exposure to single-asset risk and keeps the neurological disorder drugs market on a stable expansion path.


By Drug Class:
Antiepileptics Anchor, CGRP Biologics AccelerateAntiepileptics retained 24.01% of the neurological disorder drugs market share in 2025 thanks to entrenched prescribing patterns and broad insurance coverage. Their generics bulk still provides high patient volume, but revenue concentration is shifting as branded precision molecules secure orphan reimbursement. CGRP monoclonal antibodies, however, recorded the highest 8.29% CAGR, scaling an addressable pool of 36 million chronic migraine patients who previously cycled through four or more preventive classes.
Cholinesterase inhibitors and NMDA antagonists remain Alzheimer’s mainstays, yet real-world evidence indicates gradual slot replacement by Leqembi and Donanemab, reaffirming the transition from symptomatic to disease-modifying therapy. Dopamine agonists preserve relevance in Parkinson’s motor-symptom control, but non-motor endpoints drive demand for combination protocols. Immunomodulators, notably S1P receptor modulators, widen multiple-sclerosis remission durability, while biosimilar interferons introduce cost offsets that allow payors to fund novel agents. This compositional shift underscores how diversified drug-class dynamics reinforce resilience across the neurological disorder drugs market.
By Route of Administration:
Oral Dominance Faces Direct-to-Brain InnovationOral drugs represented 76.02% of neurological disorder drugs market volume in 2025, reflecting patient preference and straightforward manufacturing economics. Convenience factors lock in strong adherence, keeping the oral segment’s neurological disorder drugs market size above USD 74.58 billion. Intranasal delivery, however, is posting an 8.35% CAGR as nanoparticle excipients improve nose-to-brain transit, delivering rapid-onset seizure rescue and new-generation migraine prophylaxis without systemic exposure.
Intravenous therapies still underpin hospital-based acute care in stroke thrombolysis and status epilepticus, fields where bioavailability trumps convenience. Depot subcutaneous injections and transdermal systems fill the “Others” category, layering differentiation on chronically dosed agents through extended release and wearable patches. Technology convergence is allowing formulators to re-platform old APIs into novel devices, deepening lifecycle management and diversifying the revenue base within the neurological disorder drugs market.
By Distribution Channel:
Hospitals Hold Scale, Online Platforms Gain VelocityHospital pharmacies controlled 53.21% of 2025 sales because many neurological biologics require cold-chain handling and infusion monitoring. Their structural role anchors formulary inclusion and centralizes patient management for complex therapies. Online pharmacies, scaling at 8.54% CAGR, benefit from tele-neurology uptake and chronic refill automation, particularly for epilepsy and migraine maintenance drugs where adherence drives outcomes.
Retail outlets remain vital for face-to-face counseling and immediate access to acute rescue medications, especially in emerging markets where e-commerce penetration lags. Hybrid distribution models are emerging: digitally enabled hospital systems push e-prescriptions directly to home-delivery partners, integrating smart-pack adherence sensors that feed data back to clinicians. As service differentiation matures, competitive advantage will hinge on ecosystem coordination, extending the neurological disorder drugs market beyond product sales into longitudinal patient-support platforms.
Geography Analysis
North America Neurological Disorder Drugs Market
North America generated 39.35% of the neurological disorder drugs market size in 2025, underpinned by early uptake of FDA-approved disease-modifying agents and broad private-payer coverage. The region’s payer tolerance for premium therapies, combined with strong clinical-trial infrastructure, sustains double-digit launch trajectories for high-impact assets. Public policy also fuels demand: Medicare’s revised coverage decision for amyloid-targeting drugs effectively opens a multi-billion-dollar reimbursement channel, accelerating top-line momentum for asset holders.
Europe Neurological Disorder Drugs Market
Europe follows as the second-largest arena, though its reimbursement committees mandate cost-effectiveness thresholds that temper launch pricing. The EMA’s conditional endorsements typically require real-world evidence collection, compelling manufacturers to run outcome registries that can be leveraged globally. Despite tighter price discipline, pan-EU orphan-drug incentives—ten-year exclusivity and R&D tax credits—create vibrant sub-markets for rare neurological indications. Digital-health pilots in Germany’s DiGA program and France’s ETAPES tele-monitoring scheme are catalyzing remote-care integration, indirectly boosting prescription fills through adherence tools.
APAC Neurological Disorder Drugs Market
Asia-Pacific is the fastest-growing cluster, advancing at a 8.70% CAGR thanks to rapid urbanization, rising incomes, and regulatory harmonization. China’s National Reimbursement Drug List now incorporates several foreign neurological biologics, substantially reducing patient copays and unlocking volume. Japan’s Sakigake pathway continues to entice global developers with expedited review, while Australia’s Therapeutic Goods Administration aligns labeling changes within weeks of FDA actions, streamlining regional launches. Local manufacturing incentives in India and South Korea attract CDMO investment, shortening supply chains and building indigenous capacity that keeps margin erosion under control. The collective momentum positions Asia-Pacific as a strategic focal point for scaling the neurological disorder drugs market over the next decade.
Regulatory Landscape
Regulatory oversight for neurological disorder drugs is increasingly split between faster access for high-unmet-need indications and tighter evidence expectations for longer-duration safety and real-world effectiveness. In the United States, the FDA continues to rely on expedited pathways and label updates to broaden access, reflected in the July 2026 approval of LEQEMBI IQLIK (lecanemab-irmb) as a subcutaneous initiation dose option for early Alzheimer’s disease. The FDA novel drug approvals list for 2026 also includes therapies with CNS indications, including schizophrenia and bipolar disorder, indicating sustained regulatory throughput across neuropsychiatry as well as neurodegeneration.
In Europe, the European Medicines Agency (EMA) and the European Commission (EC) remain the gatekeepers for market access, with EC marketing authorizations translating CHMP opinions into EU-wide decisions that can reset treatment standards in specialty neurology. In 2026, this includes the EC authorization of IntraBio’s AQNEURSA for Niemann-Pick Type C (January 2026) and the EC approval of Sanofi’s Cenrifki (tolebrutinib) for secondary progressive multiple sclerosis without relapses (June 2026). These approvals reflect a regulatory environment that supports both rare-disease neurology and neuroimmunology, while post-authorization obligations and pharmacovigilance remain key determinants of uptake.
Value Chain Analysis
The value chain for neurological disorder drugs runs from target discovery and clinical development through API and biologics manufacturing, sterile fill-finish and device integration for injectables and emerging delivery formats, and distribution where cold-chain handling is required. Dispensing is split across hospital, retail, and online pharmacy channels, with hospital pharmacies remaining central for infused and monitored therapies. Online channels increasingly extend reach for chronic oral maintenance regimens through e-prescribing and refill automation. Supply-side constraints, including shortages in cGMP neuro-APIs and sterile injectables, also shape sourcing and quality expectations, raising the need for qualified dual sourcing, inventory buffers, and robust quality systems.
Operational digitization is becoming a differentiation lever across planning, serialization, and partner coordination. Neuraxpharm, for instance, implemented TraceLink MINT and OPUS in December 2025 to standardize real-time data exchange across its global supply chain network, connecting external partners with internal ERP environments. This connectivity improves batch traceability, reduces release-to-ship latency, and supports compliance with track-and-trace and quality documentation requirements across multiple geographies, particularly as portfolios expand into specialty neurology and rare-disease treatments.
Competitive Landscape
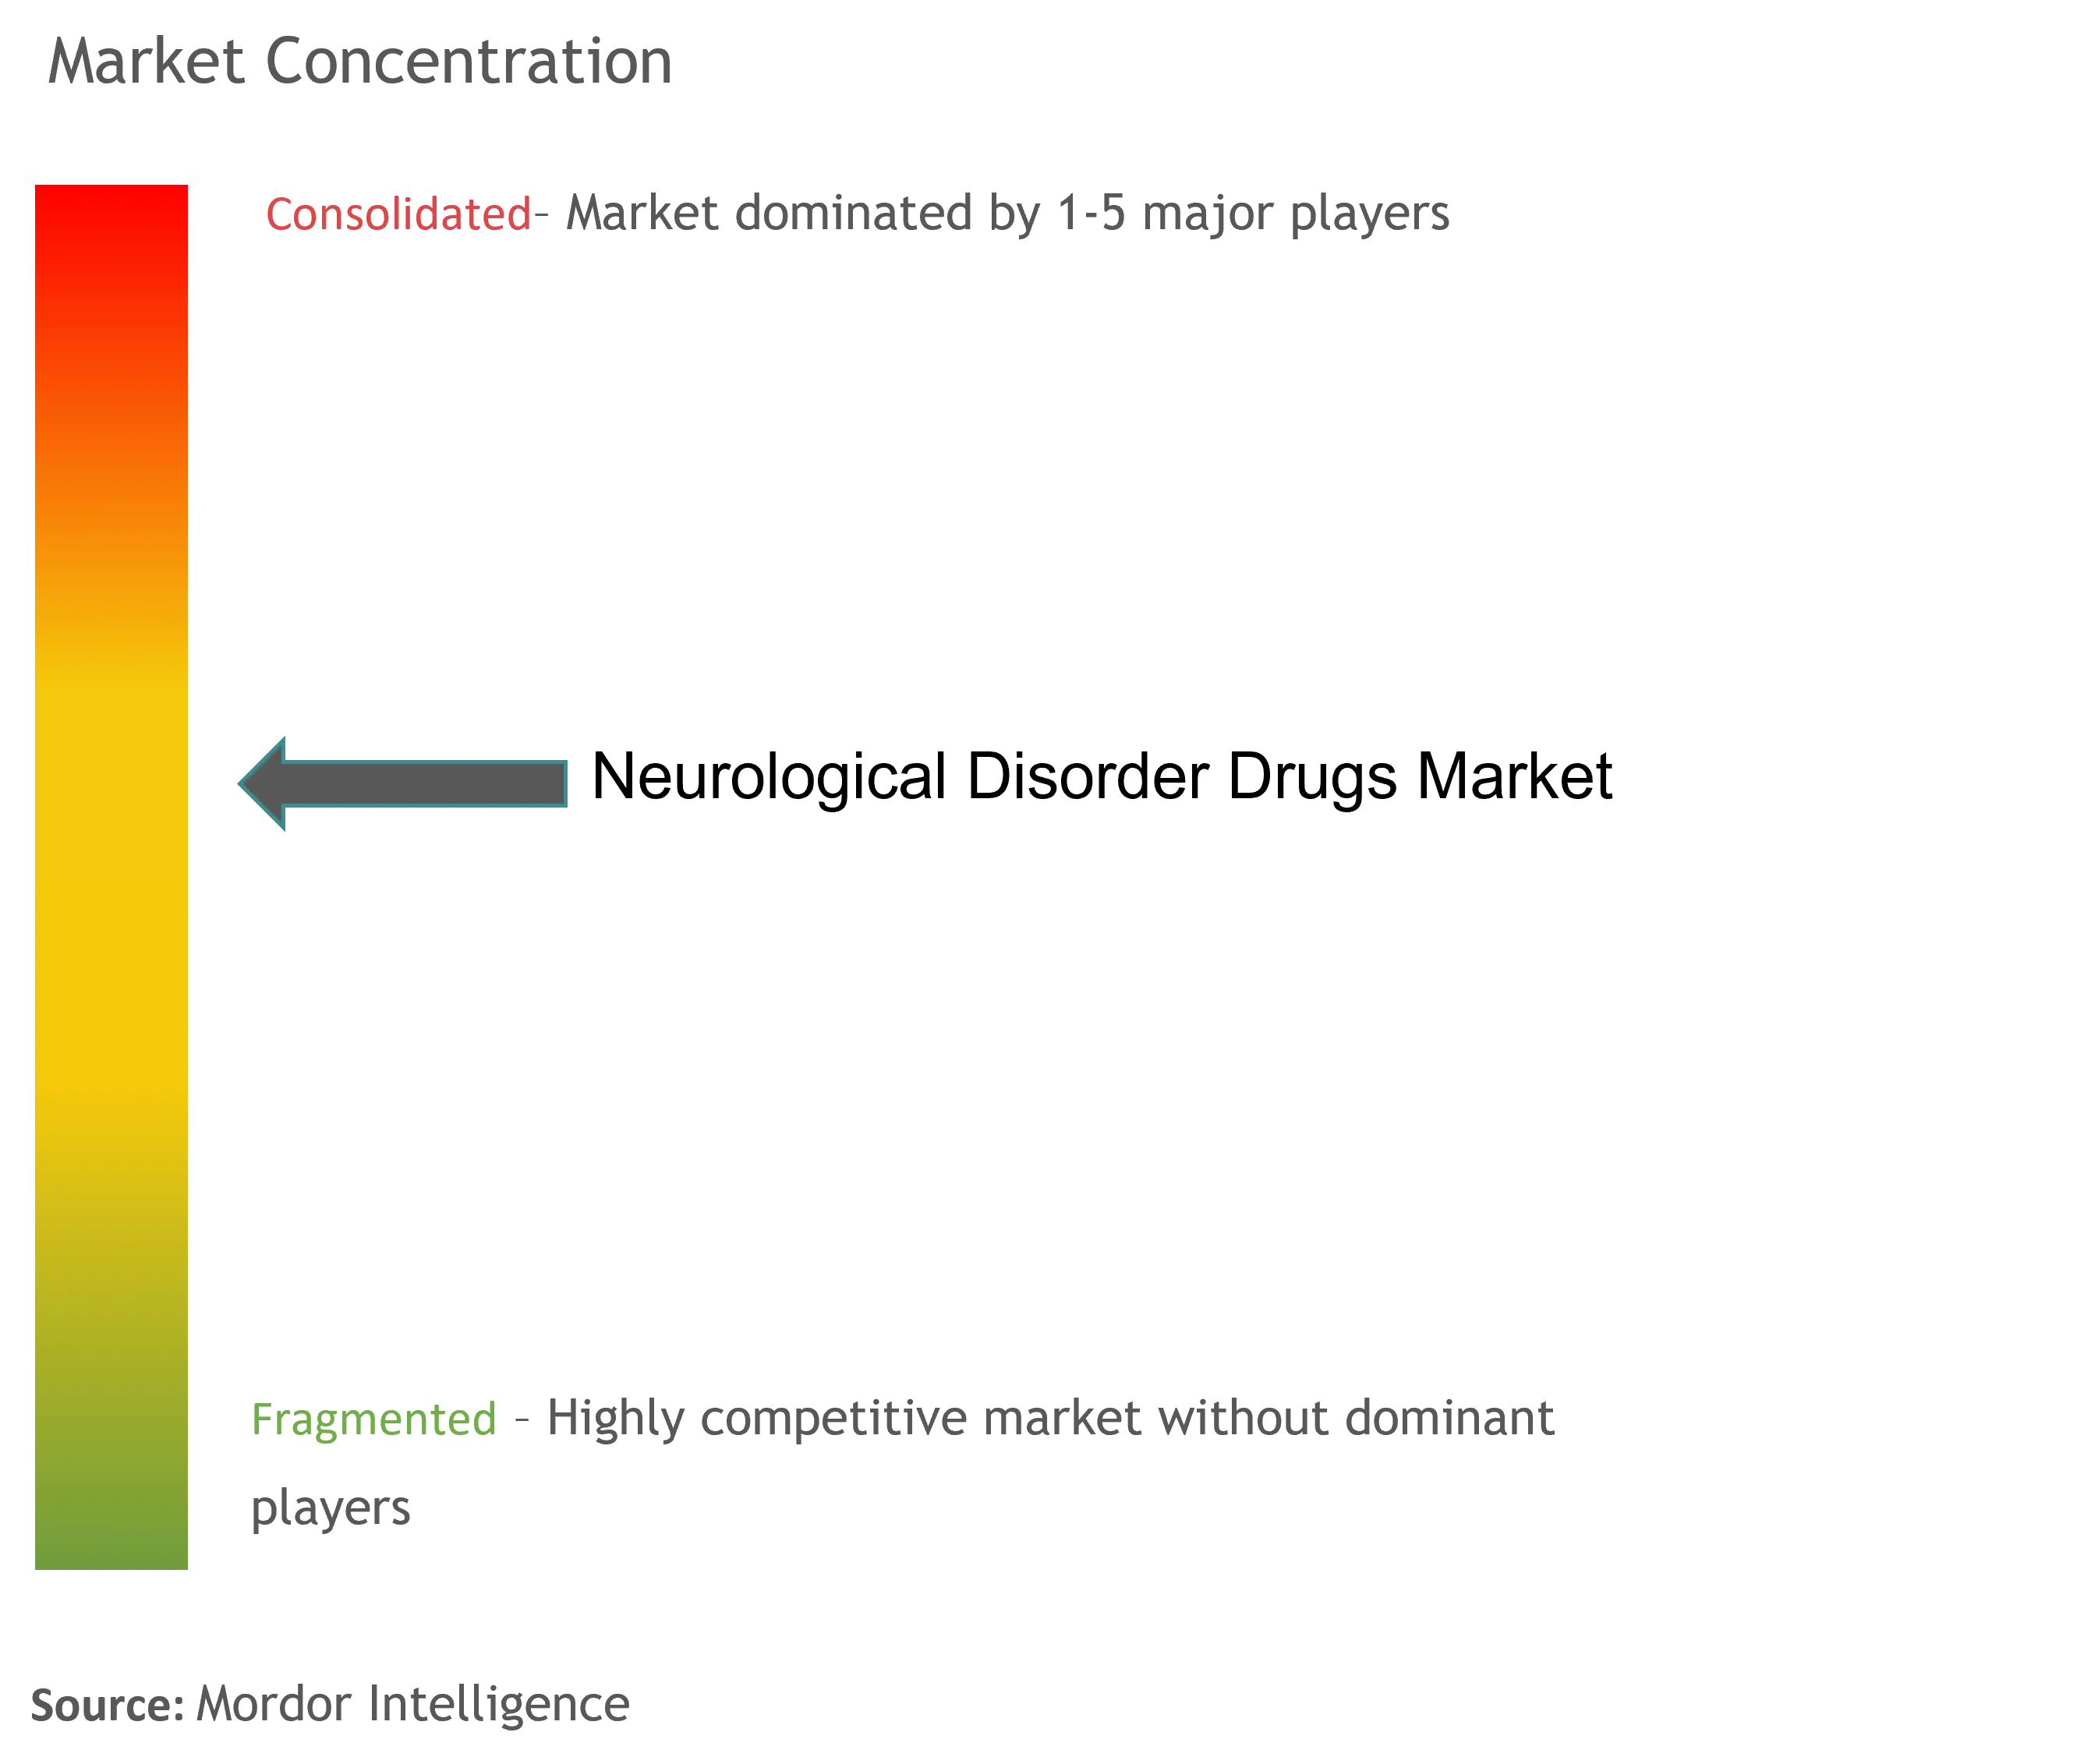
The neurological disorder drugs market depicts moderate concentration, with the top five companies controlling an estimated half of global revenue. Incumbents such as Biogen, Eli Lilly, and Roche deploy diversified portfolios spanning Alzheimer’s, multiple sclerosis, and rare epilepsy, mitigating single-asset risk. Their regulatory expertise allows parallel filings across continents, compressing time-to-revenue. Mid-caps including Acadia Pharmaceuticals and Neurocrine Biosciences leverage focused franchises and specialty sales forces, achieving outsized growth in movement disorders and tardive dyskinesia.
Strategic activity revolves around bolt-on acquisitions that infuse platform technologies—intranasal delivery, gene-editing, and digital therapeutics—into established pipelines. Lilly’s acquisition of intranasal-delivery firm Disarm showcases vertical integration aimed at route-of-administration differentiation, while Amgen’s Uplizna expansion into IgG4-related disease validates indications outside classic neurology yet dependent on neuro-immunology expertise. Collaborations with AI specialists such as Cerevance streamline target discovery, allowing pharma to outsource early risk while retaining downstream commercialization rights.
Price competition intensifies once molecules lose exclusivity; Takeda and Teva maintain competitive biosimilar units ready to cannibalize their own expiring blockbusters, thus defending share. Manufacturing resilience is emerging as a moat: companies with dual-continent sterile-fill plants weather API shortages better, protecting hospital contracts. Commercial models now integrate telehealth companion apps, with UCB’s epilepsy platform synchronizing refill reminders and seizure logs, creating sticky patient ecosystems that extend beyond the pill. This evolution keeps the neurological disorder drugs market dynamically balanced between scale advantages and niche innovation.
Neurological Disorder Drugs Industry Leaders
-
Pfizer Inc
-
Bayer AG
-
Johnson & Johnson Private Limited
-
Novartis AG
-
F. Hoffmann-La Roche Ltd.
- *Disclaimer: Major Players sorted in no particular order
Neurological Disorder Drugs Market Companies Covered in this Report
- Biogen
- Pfizer
- Novartis
- Johnson & Johnson
- Eli Lilly and Company
- Merck
- Roche
- Takeda Pharmaceuticals
- Eisai
- Abbvie
- Teva Pharmaceutical Industries
- UCB
- Lundbeck
- Sanofi
- Amgen
- Jazz Pharmaceuticals
- Neurocrine Biosciences
- Acadia Pharmaceuticals
- Sage Therapeutics
- Sunovion (Sumitomo)
Market Opportunities and Future Outlook
Alzheimer’s disease and other neurodegenerative conditions continue to create whitespace for product differentiation tied to administration convenience, earlier intervention, and scalable monitoring. A clear marker is the July 2026 FDA approval of LEQEMBI IQLIK as a subcutaneous initiation dosing option for early Alzheimer’s disease, which strengthens the rationale for therapies and companion services that reduce infusion burden and streamline initiation workflows. It also opens distribution and care-model opportunities around home-adjacent administration, adherence services, and integrated neuro-care pathways, especially as online pharmacy penetration rises for chronic neurologic maintenance therapies.
Rare and specialty neurology also remains an opportunity area where regulatory decisions directly expand treatment options and support investment in niche programs. The EC marketing authorization for AQNEURSA in Niemann-Pick Type C (January 2026) points to continued orphan-neurology momentum, while the EC approval of Cenrifki for SPMS without relapses (June 2026) underscores ongoing innovation in neuroimmunology and progressive disease segments with historically limited options. On the pipeline-to-market front, late-stage development milestones, including Roche’s stated plan to move fenebrutinib toward regulatory submission following Phase III readouts (noted for 1H 2026), keep competition concentrated on multiple sclerosis and related neuroinflammatory pathways, which raises demand for trial networks, biomarker-enabled patient identification, and manufacturing readiness for specialty launches.
Recent Industry Developments in Neurological Disorder Drugs Market
- July 2026: Roche announces clinical data presentations for trontinemab (Brainshuttle anti-amyloid-beta) at AAIC 2026, including design for PrevenTRON Phase III study in preclinical Alzheimer's. The Alzheimer's pipeline data signals momentum and potential near-term demand drivers in amyloid-targeting therapies.
- July 2026: Biogen and Eisai receive U.S. FDA approval of supplemental BLA for LEQEMBI IQLIK (lecanemab-irmb) subcutaneous initiation dosing for early Alzheimer's disease. The initiation-dosing platform expands treatment options and provides route-of-administration advantage.
- June 2026: Sanofi European Commission approves Cenrifki (tolebrutinib) for secondary progressive multiple sclerosis (SPMS) without relapses. The approval adds a broad-appeal oral therapy to the neuroimmunology portfolio and could influence market dynamics in the MS segment.
Neurological Disorder Drugs Market Report Scope and Research Methodology
Market Definition and Coverage
For this study, the market covers prescription and hospital administered drug revenues used to prevent, manage, or treat neurological disorders across the major care settings, measured in USD at manufacturer level value.
Scope exclusions: We exclude devices, diagnostics, procedure revenues, and non-therapeutic digital tools, even if they support disease management.
Segments Covered in This Report
- By Indication
- Alzheimer’s Disease
- Parkinson’s Disease
- Epilepsy
- Multiple Sclerosis
- Migraine
- ADHD & Other Psychiatric CNS
- Rare & Orphan Neurological Disorders
- By Drug Class
- Cholinesterase Inhibitors
- NMDA Receptor Antagonists
- Dopamine Agonists & Precursors
- Antiepileptics
- CGRP & Other Novel Biologics
- Immunomodulators
- Neuroprotective / Disease-Modifying Agents
- By Route of Administration
- Oral
- Intravenous
- Intranasal
- Others
- By Distribution Channel
- Hospital Pharmacies
- Retail Pharmacies
- Online Pharmacies
- By Geography
- North America
- United States
- Canada
- Mexico
- Europe
- Germany
- United Kingdom
- France
- Italy
- Spain
- Rest of Europe
- Asia-Pacific
- China
- India
- Japan
- South Korea
- Australia
- Rest of Asia-Pacific
- South America
- Brazil
- Argentina
- Rest of South America
- Middle East and Africa
- GCC
- South Africa
- Rest of Middle East and Africa
- North America
Data Sources, Market Sizing, and Validation
Desk Research
Desk research was used to map the treated patient pool, therapy pathways, and pricing logic before we moved into interviews. We mainly relied on public health statistics and clinical references, such as CDC, NIH, WHO, OECD health data, and peer-reviewed journals that report prevalence, incidence, and treatment patterns by indication.
We also reviewed regulator and payer signals that influence uptake and timing, such as FDA and EMA drug labels, approval dates, safety updates, and major guideline changes from medical societies. To sanity check revenue direction, we referenced company filings and investor presentations, along with reputable press coverage on launches, loss of exclusivity, and reimbursement decisions. Where needed, a paid subscription for company financials and intelligence and a patent database were used to cross-check pipeline density and patent timelines. The examples above are illustrative only and not exhaustive, and many other public sources were used to collect data, validate assumptions, and clarify open questions during the work.
Primary Interviews and Surveys
Primary work focused on neurologists, hospital pharmacists, payer or reimbursement stakeholders, and industry experts who track prescription behavior and access restrictions across the main regions. Inputs from these discussions were used to confirm treated rates, switching across drug classes, expected price erosion after patent expiry, and how quickly new disease modifying options expand the addressable pool.
Distribution of primary research fieldwork respondents
| Company type | Respondent position | Region |
|---|---|---|
| Top tier: 26% | CXOs: 16% | APAC: 39% |
| Mid tier: 58% | Functional/Unit leaders: 41% | EMEA: 36% |
| Smaller Players: 16% | Managers: 43% | Americas: 25% |
Market-Sizing & Forecasting
Sizing starts from a top-down build where prevalence and diagnosis rates are translated into a treated population by indication, which is then converted into demand using therapy mix and typical duration of treatment. After that, value is derived using price levels by drug class and route of administration, adjusted for expected gross to net effects in major markets.
To keep the totals realistic, selective bottom-up checks were used, such as summing a sampled set of brand revenues disclosed in filings, validating prescription intensity through channel checks, and testing implied spend per patient against clinical dosing norms. When country data gaps appeared, proxy markets with similar access and guideline adoption were used, followed by a step-down adjustment during expert reviews.
Forecasting was carried out using scenario analysis supported by a light multivariate regression on a few repeatable drivers. Key inputs included aging population share, diagnosis and screening trends, disease modifying launch timing, patent expiry driven generic entry, and price erosion patterns that differ by payer systems. Assumptions were refined until the demand pool, pricing path, and uptake curves were aligned across regions.
Data Validation & Update Cycle
Model outputs were checked against independent signals such as epidemiology totals, reported neurology drug sales in public filings, and approval or label expansion timelines. If a country level result looked unusual, the drivers were rechecked first, and then follow-up calls were triggered to confirm whether it was a real demand shift or a data mismatch.
A multi-step review was completed before sign-off, including cross-country consistency checks, currency conversion timing checks, and peer review of key assumptions. Reports are refreshed annually, and interim updates are made when material events occur, such as major approvals, safety restrictions, or large reimbursement changes. Before delivery, the latest public updates are re-read so clients receive an up to date view.
Mordor Intelligence's Neurological Disorder Drugs Market Estimate Compared With Other Published Estimates
Published market values for neurological disorder drugs can vary quite a bit, even when they use similar words for the topic. Differences usually come from what is counted as a drug revenue, how indications are grouped, and how pricing is handled across branded and generic products.
The main gap comes from whether adjacent neurology spending is blended in, where Mordor Intelligence counts only drug revenues tied to neurological indications and applies indication level uptake and post-LOE price erosion separately, instead of using one blended neurology price curve.
Benchmark comparison
| Source | Market Size | Gaps in Research Methodology |
|---|---|---|
| Mordor Intelligence | USD 105.44 B (2026) | |
| Trade Journal A | USD 90.09 B (2025) | Uses a narrower therapy set and appears to emphasize historical sales momentum, which can undercount newer disease modifying launches and their early access ramp in key markets. |
| Global Consultancy B | USD 67.30 B (2024) | Looks closer to a broader neurology therapeutics view that can exclude several high-revenue chronic categories or apply conservative treated-rate assumptions, which lowers the implied spend per diagnosed patient. |
Overall, the spread is mostly explained by what gets included as a drug revenue line item, plus how treated rates and price erosion are applied by indication. By keeping the build tied to patient pools, therapy mix, and repeatable pricing steps, the resulting number stays transparent and can be rechecked when new approvals or generic entries change the outlook.
Key Questions Answered in the Report
How large is the neurological disorder drugs market in 2026?
The market is valued at USD 105.44 billion in 2026 and is forecast to reach USD 151.09 billion by 2031.
Which therapeutic area holds the biggest revenue share?
Alzheimer's disease contributes 28.67% of 2025 sales, making it the single largest indication.
What is the fastest-growing drug class?
CGRP monoclonal antibodies for migraine prevention are expanding at an 8.29% CAGR through 2031.
Which region is growing fastest?
Asia-Pacific is set to register a 8.70% CAGR as health-care infrastructure matures and access widens.
How will patent expiries affect pricing?
Patents expiring between 2025 and 2029 will invite generic entry, compressing prices but broadening patient access.
What delivery technology shows most promise?
Intranasal nose-to-brain platforms are posting the highest growth, offering rapid CNS penetration and improved patient convenience.