
Network Encryption Market Size and Share
Market Overview
| Study Period | 2020 - 2031 |
|---|---|
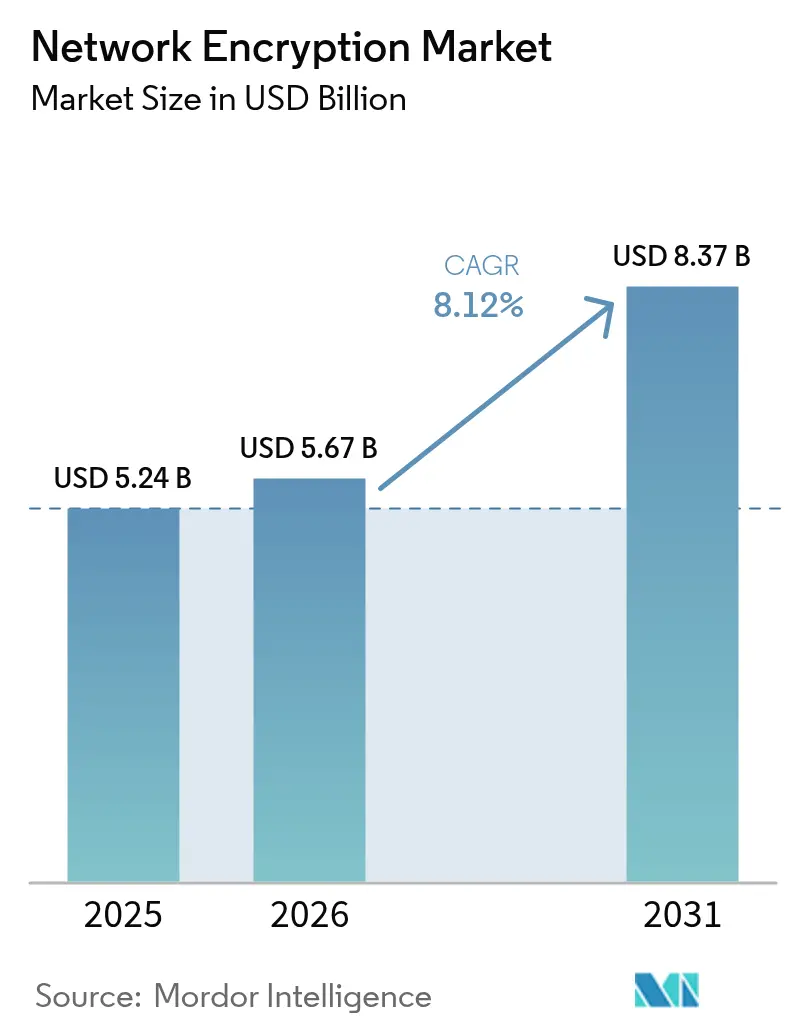
| Market Size (2026) | USD 5.67 Billion |
| Market Size (2031) | USD 8.37 Billion |
| Growth Rate (2026 - 2031) | 8.12% CAGR |
| Fastest Growing Market | Asia Pacific |
| Largest Market | North America |
| Market Concentration | Medium |
Major Players *Disclaimer: Major Players sorted in no particular order Image © Mordor Intelligence. Reuse requires attribution under CC BY 4.0. | |
Network Encryption Market Analysis by Mordor Intelligence
The network encryption market size is expected to grow from USD 5.24 billion in 2025 to USD 5.67 billion in 2026 and is forecast to reach USD 8.37 billion by 2031 at 8.12% CAGR over 2026-2031. Escalating quantum computing threats, the migration to zero-trust architectures, and tightening regulatory mandates converge to sustain a robust demand trajectory for advanced cryptographic controls. Enterprises race to deploy quantum-resistant algorithms ahead of commercially viable quantum computers, while 5G rollouts and cloud adoption create large volumes of traffic that must be encrypted at line rate. Hardware-accelerated solutions remain critical for ultra-low-latency use cases; however, the rapid rise of software-defined and managed encryption platforms signals a long-term shift toward flexible consumption models. Vendor differentiation increasingly hinges on seamless integration with identity platforms, automated key management, and support for the first wave of post-quantum standards.
Key Report Takeaways
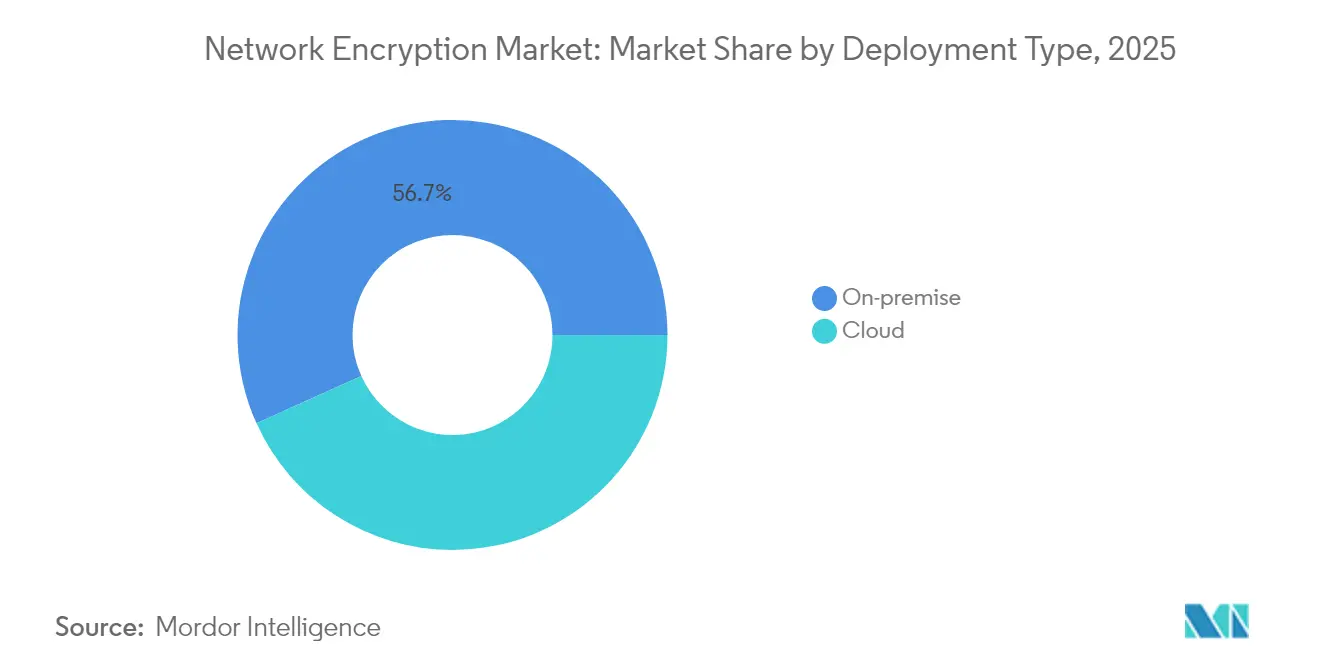
- By deployment type, on-premise solutions held 56.74% of the network encryption market share in 2025, whereas cloud implementations are expected to expand at a 9.87% CAGR through 2031.
- By component, hardware accounted for 49.01% of the network encryption market size in 2025, while solutions and services registered the fastest growth, at a 10.05% CAGR, from 2026 to 2031.
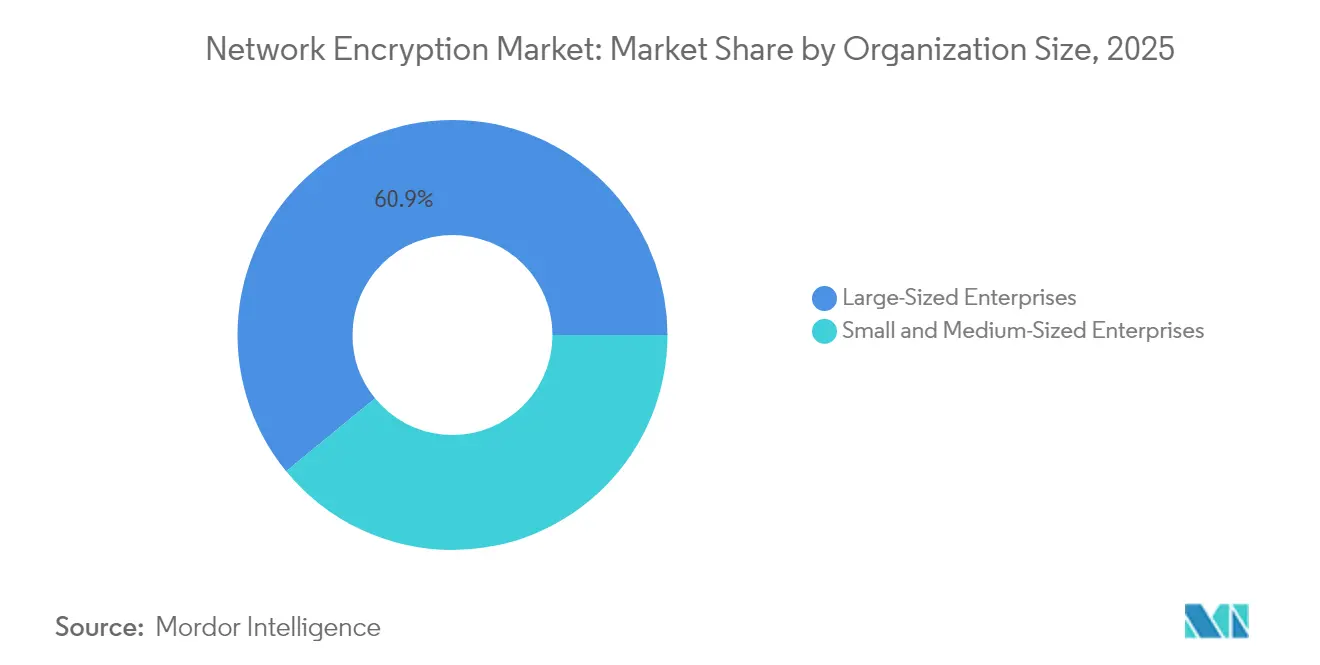
- By organization size, large enterprises commanded a 60.92% revenue share in 2025; however, the SME segment is forecasted to advance at a 9.94% CAGR.
- By end-user industry, BFSI led with a 27.35% share in 2025, while healthcare is projected to grow at an 8.49% CAGR through 2031.
- By geography, North America retained a 33.45% share in 2025, whereas the Asia Pacific is projected to post the highest regional CAGR at 8.86% through 2031.
Note: Market size and forecast figures in this report are generated using Mordor Intelligence’s proprietary estimation framework, updated with the latest available data and insights as of 2026.
Global Network Encryption Market Trends and Insights
Drivers Impact Analysis*
| Driver | (~) % Impact on CAGR Forecast | Geographic Relevance | Impact Timeline |
|---|---|---|---|
| Increasing number of network security breaches | +2.1% | Global with heightened focus in North America and Europe | Short term (≤ 2 years) |
| Accelerating adoption of cloud-based workloads | +1.8% | Global led by North America and Asia Pacific | Medium term (2-4 years) |
| Surge in 5G rollouts requiring high-speed inline encryption | +1.5% | Asia Pacific core, spill-over to North America and Europe | Medium term (2-4 years) |
| Compliance mandates such as GDPR and HIPAA | +1.2% | Europe and North America primarily, expanding to Asia Pacific | Long term (≥ 4 years) |
| Growing concern over quantum computing threats | +0.9% | Global with early adoption in North America and Europe | Long term (≥ 4 years) |
| Rising adoption of zero trust architectures | +0.8% | North America and Europe, expanding to Asia Pacific | Medium term (2-4 years) |
| Source: Mordor Intelligence | |||
Increasing Number of Network Security Breaches
Ransomware campaigns and state-sponsored intrusions grew in frequency and sophistication during 2024, driving boards to accelerate encryption investments across data-in-motion channels. Breach disclosure laws in the United States, Europe, and several Asia-Pacific jurisdictions impose heavy penalties for unprotected data exposure, prompting enterprises to encrypt internal east-west traffic alongside external communications. Insurance underwriters have tightened policy terms, granting premium discounts only when policyholders can prove ubiquitous encryption coverage. As a result, procurement teams now treat network-level encryption as a baseline control, rather than an optional safeguard, which propels continuous spending even when broader IT budgets are tightened. Vendors able to deliver easy-to-deploy appliances and automated policy engines gain rapid traction.
Accelerating Adoption of Cloud-Based Workloads
Cloud migration places new emphasis on encryption agility, because workloads spin up and down within seconds across multi-cloud footprints. Native cloud networking services now incorporate advanced encryption, enabling security teams to centralize key governance while application owners maintain DevOps velocity.[1]Amazon Web Services, “New Amazon VPC Lattice: Simplify Service-to-Service Connectivity, Security, and Monitoring,” amazon.com Service mesh frameworks integrate transparent TLS termination, removing the need for developers to code encryption calls. Consumption-based pricing lowers entry barriers for SMEs, enabling them to match the security posture of larger peers without capital purchases. Consequently, cloud-centric encryption platforms experience double-digit growth, driving demand for complementary key management-as-a-service offerings.
Surge in 5G Rollouts Requiring High-Speed Inline Encryption
Release 17 of the 3GPP standard mandates end-to-end encryption for network slicing, prompting operators to deploy line-rate cryptography at speeds of 100 Gbps and above.[2]3rd Generation Partnership Project, “Release 17 Specifications,” 3gpp.org Equipment vendors embed dedicated cryptographic processors in base stations and core routers, thereby avoiding the need for separate appliances that introduce latency. Industrial 5G use cases, ranging from autonomous robotics to remote surgery, cannot tolerate more than sub-millisecond delays; therefore, carriers favor hardware that pairs switching silicon with encryption engines on a single chipset. Capital outlays for encryption-ready 5G infrastructure, therefore, form a multi-year demand funnel, especially in the Asia Pacific, where greenfield deployments are more prevalent.
Compliance Mandates Such as GDPR and HIPAA
Regulators increasingly specify encryption at rest and in transit as explicit requirements rather than best-practice recommendations. Under GDPR, supervisory authorities throughout the European Union issue multimillion-euro fines when organizations fail to secure personal data during network transfer. In the United States, the 2025 update to the HIPAA Privacy Rule broadens the definition of protected health information, compelling covered entities to encrypt all telehealth traffic. Similar provisions appear in India’s Digital Personal Data Protection Act and Brazil’s LGPD, creating a harmonizing effect that raises the global floor for encryption adoption. Compliance teams now view certificate life-cycle automation and centralized audit logging as essential capabilities, benefiting platform vendors that integrate policy, key management, and reporting within a single console.[3]European Commission, “Cyber Resilience Act,” europa.eu
Restraints Impact Analysis*
| Restraint | (~) % Impact on CAGR Forecast | Geographic Relevance | Impact Timeline |
|---|---|---|---|
| High implementation cost of network encryption solutions | -1.4% | Global, with sharper pressure on SMEs in emerging markets | Short term (≤ 2 years) |
| Performance overhead and latency concerns in high-speed networks | -1.1% | Global, acutely felt in high-frequency trading and industrial control settings | Medium term (2-4 years) |
| Interoperability complexities across multi-vendor environments | -0.9% | Global, especially in large enterprises running heterogeneous infrastructure | Medium term (2-4 years) |
| Shortage of skilled cryptography professionals | -0.7% | Global, most pronounced in Asia Pacific and Latin America | Long term (≥ 4 years) |
| Source: Mordor Intelligence | |||
High Implementation Cost of Network Encryption Solutions
Comprehensive deployments often require specialized appliances, consulting services, and staff training, driving project outlays from USD 500,000 to well above USD 5 million for mid-sized enterprises. Budget pressure is more acute in emerging economies where local currency fluctuations inflate imported hardware prices. Additionally, legacy switches and routers may lack built-in crypto acceleration, forcing expensive infrastructure refreshes. Managed services do offset capital burdens, but small businesses still struggle with recurring subscription fees. As a result, price-sensitive buyers defer or narrow project scope, limiting near-term penetration in segments outside regulated verticals.
Performance Overhead and Latency Concerns in High-Speed Networks
Encrypting high-frequency trading feeds or manufacturing control loops adds 50-200 microseconds per hop, an unacceptable delay for applications that measure success in single-digit microseconds. Even when hardware acceleration is present, CPU cycles consumed by cryptographic operations can reduce overall throughput by 10-30%. Operators sometimes adopt selective encryption, leaving less-critical traffic unprotected to preserve performance, which limits total addressable spend. Vendors therefore face pressure to innovate lightweight ciphers, pipeline architectures, and FPGA-based offloads that close the latency gap without spiking power consumption.
*Our forecasts treat driver/restraint impacts as directional, not additive. The impact forecasts reflect baseline growth, mix effects, and variable interactions.
Segment Analysis
By Deployment Type: Cloud Migration Accelerates Despite Security Concerns
Cloud implementations are projected to register the fastest 9.87% CAGR through 2031, yet on-premise deployments still represented 56.74% of the network encryption market share in 2025. The large installed base of legacy applications and stringent data sovereignty rules in BFSI and government sectors anchor on-premise demand, while new digital services default to cloud-native encryption offerings. Major providers bundle key lifecycle management and automated certificate rotation, lowering the operational burden for security teams.
Hybrid patterns emerge as organizations retain mission-critical workloads on-site but route development, analytics, and customer-facing services through cloud backbones. This two-speed architecture allows buyers to experiment with consumption-based encryption without abandoning their existing investments. Vendors that supply unified policy engines capable of extending across on-premises gear and virtual appliances in public clouds gain account stickiness. As post-quantum algorithms become mainstream, cloud platforms offer faster upgrade cycles, potentially tilting long-term volume toward hosted encryption models.


By Component: Software-Defined Solutions Reshape Market Dynamics
Hardware retained 49.01% of the network encryption market share in 2025, as ultrafast links still rely on ASICs and FPGAs to maintain line-rate performance. Yet the solutions and services segment posts a 10.05% CAGR, illustrating the pivot toward flexible, software-controlled security. Enterprises value API-driven orchestration that integrates with infrastructure-as-code workflows, enabling the dynamic creation of tunnels and policy changes within seconds.
Managed security service providers integrate encryption into bundled offerings that combine threat detection, certificate automation, and zero-trust segmentation. Artificial intelligence assists by analyzing key usage patterns and predicting certificate expirations, reducing unplanned outages. Modular licensing also allows customers to scale bandwidth or algorithm suites without forklift upgrades. Over the forecast period, chip-level crypto blocks will become commoditized, while differentiation will shift to software analytics, compliance reporting, and broader integration capabilities.
By Organization Size: SME Adoption Accelerates Through Cloud Accessibility
Large enterprises contributed 60.92% of 2025 revenue, reflecting complex global networks and deep security budgets. Nonetheless, SMEs demonstrate a 9.94% CAGR thanks to pay-as-you-go models that remove large upfront costs. Cloud marketplaces now offer encryption-as-a-service bundles that can be deployed with just a few clicks, eliminating the need for specialized cryptography staff.
Vendor marketing emphasizes regulatory alignment, providing templated policies that map to HIPAA, PCI-DSS, and GDPR controls. Automated dashboards surface compliance gaps, supporting audit readiness for firms with limited personnel. As cyber insurers tighten coverage terms, SMEs perceive encryption as a prerequisite for affordable premiums, further stimulating demand. The democratization of advanced cryptography, therefore, widens the addressable base beyond traditional high-security verticals.
By End-User Industry: Healthcare Emerges as Growth Leader
BFSI remained the single largest contributor with a 27.35% share in 2025, derived from sustained investment in encryption for payments, core banking, and trading infrastructure. Healthcare’s 8.49% CAGR outpaces all other industries as telehealth platforms and electronic health records generate sensitive data flows that traverse public networks. Hospitals upgrade to TLS 1.3 and quantum-safe algorithms to protect patient confidentiality amid a rise in ransomware events.
Telecommunications operators also appear prominently as they embed encryption into 5G and edge computing nodes. Government and defense agencies uphold consistent demand, often specifying domestic key generation and multi-factor authentication within procurement tenders. Media and entertainment companies encrypt high-value content across CDNs to combat piracy, while manufacturers secure industrial IoT traffic between plants and cloud analytics engines. Cross-industry reliance on distributed workflows ensures that the network encryption market maintains a diverse revenue mix.
Geography Analysis
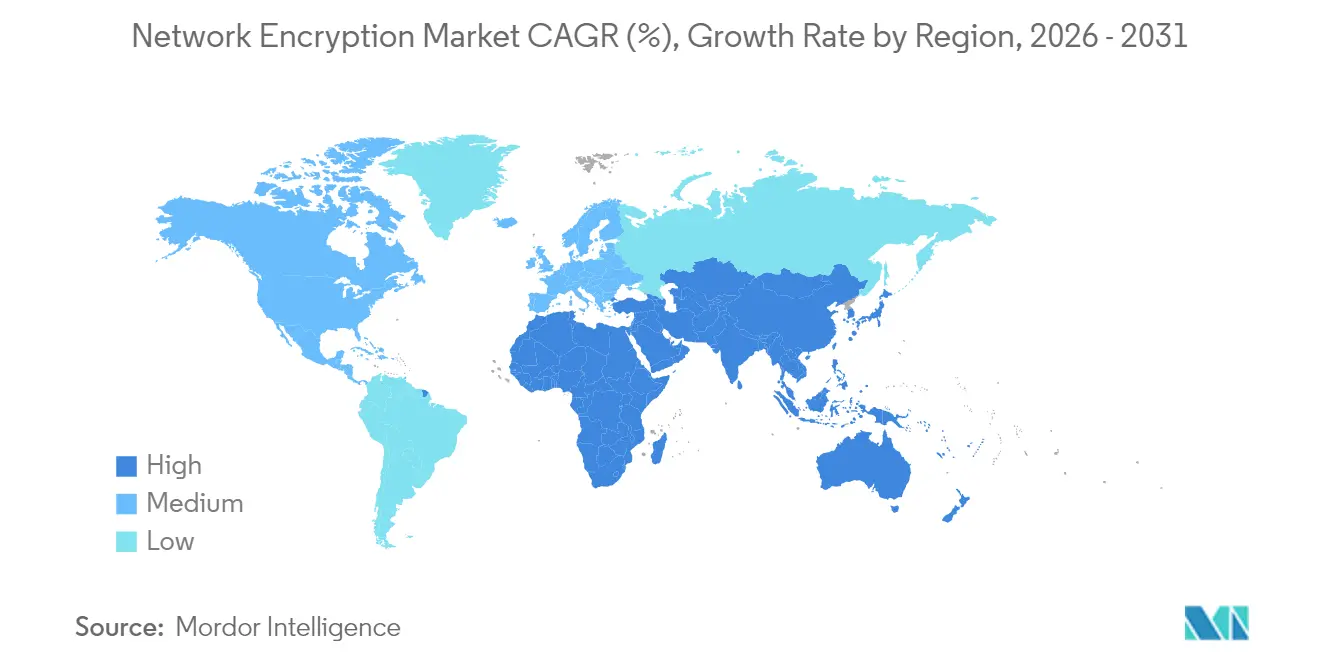
North America accounted for 33.45% of the revenue in 2025, underpinned by early zero-trust adoption, rich cyber budgets, and proximity to most leading encryption vendors. Federal mandates requiring quantum-resistant migration by 2026 further accelerate domestic upgrades. U.S. carriers likewise bundle inline encryption into nationwide 5G programs, stimulating equipment refresh cycles.
The Asia Pacific is projected to deliver the fastest 8.86% CAGR through 2031, driven by significant cloud investments in China, India, and Southeast Asia. Regional regulators tighten data residency rules, prompting enterprises to deploy locally managed key stores. Governments channel stimulus funds toward quantum research and 5G infrastructure, indirectly subsidizing encryption-capable hardware. Japanese financial institutions are piloting dual-algorithm schemes that combine classical and lattice-based ciphers, signaling an upcoming wave of post-quantum transitions.
Europe remains a pivotal market, as GDPR fines motivate ongoing spending on encryption. The forthcoming Cyber Resilience Act extends mandatory security controls to connected products, indirectly broadening the scope of encrypted channels. Telecom operators in Germany and France are integrating traffic-layer encryption into their Open RAN rollouts, while Scandinavian countries are leading early trials of quantum key distribution backbones. The Middle East and Africa, as well as South America, show rising adoption, although skills shortages and budget constraints push customers toward managed services and cloud deployment models.

Regulatory Landscape
Regulators are shifting encryption from guidance to auditable requirements across critical infrastructure, government networks, and cloud hosting. In the European Union, Regulation (EU) 2024/2847 (Cyber Resilience Act) and Implementing Regulation (EU) 2024/2690 supporting NIS2 compliance raise the baseline for secure communications and risk management measures across products and operators, increasing the use of encrypted channels and tightening expectations for key governance. In June 2025, ENISA published technical implementation guidance on cybersecurity risk management measures that reinforces controls commonly mapped to encryption in transit and key management across NIS2-aligned programs.
In 2026, several government actions tightened expectations for secure administration, cloud hosting, and protection of sensitive data. NIST issued SP 800-172 Rev. 3 (May 2026) to strengthen requirements for protecting Controlled Unclassified Information, reinforcing encryption and cryptographic key management in federal-aligned supply chains. The White House issued NSPM-12 (June 2026), directing CNSS to identify revisions to CNSSP-32 for secure cloud hosting of National Security Systems, while the UK released the Revised Telecommunications Security Code of Practice 2026 (version 1.1, July 2026), emphasizing secure administration and effective authentication and encryption for public telecoms providers. The Philippines signed Executive Order No. 119 (July 2026), establishing a data residency and classification framework that mandates encryption for designated categories of government data stored in cloud platforms.
Value Chain Analysis
The value chain spans cryptographic standards and validated modules upstream, then moves through silicon and appliance or virtual form factors, and into orchestration, certificate lifecycle management, and managed delivery. Standards bodies and validation programs, including NIST FIPS 140-3 and the Cryptographic Module Validation Program, along with updated FIPS 140-3 Implementation Guidance published in 2026, shape procurement for regulated buyers and influence vendor roadmaps for HSMs, VPNs, inline encryptors, and secure network operating systems. Component suppliers provide ASIC or FPGA acceleration, HSMs, and secure elements that support performance and assurance, while platform vendors package these components into appliances, virtual network functions, and cloud-native services.
Downstream, interoperability testing and protocol-level integration increasingly determine how encryption is built and consumed across enterprise and carrier networks. Cloudflare made hybrid post-quantum ML-KEM generally available for IPsec in April 2026 and cited interoperability with major network vendors, including Cisco and Fortinet, showing how protocol implementations pull demand for compatible gateways, policy tooling, and troubleshooting services across multi-vendor environments. Operating-system and identity stack providers are also key nodes in the chain: Microsoft moved ML-DSA certificate issuance into Active Directory Certificate Services on Windows Server 2025 (general availability in May 2026), and later enabled hybrid post-quantum key exchange in Windows TLS/Schannel via Windows updates in July 2026, increasing pull-through for certificate automation, key management, and managed encryption operations at scale.
Competitive Landscape
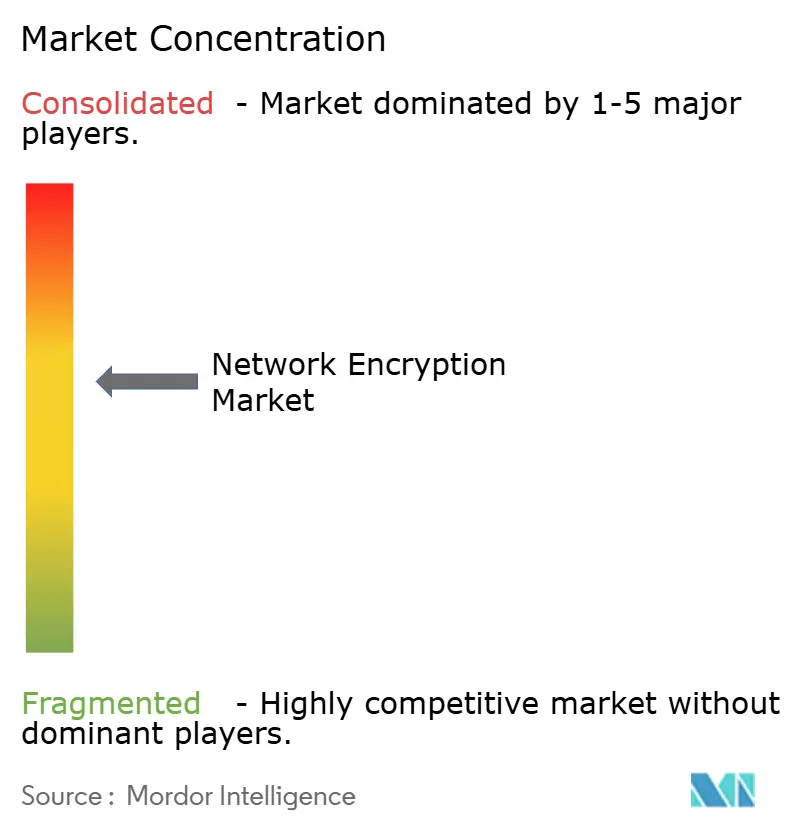
The network encryption market is moderately fragmented. Established infrastructure vendors, such as Cisco Systems, Juniper Networks, and Huawei Technologies, leverage in-house silicon to sustain their high-performance leadership. Simultaneously, specialized software vendors focus on quantum-safe algorithms and zero-trust orchestration layers, eroding market share from incumbents in greenfield cloud projects. Vendor selection criteria now weigh integration depth with identity providers and policy engines above raw throughput figures.
Intellectual property filings highlight fierce competition around FPGA-based cryptographic accelerators and distributed key escrow mechanisms. Mergers target complementary strengths: Thales absorbing Imperva reflects hardware players seeking database-level encryption intellectual property, while service providers align with hyperscale clouds to embed security natively. Early movers in post-quantum readiness command premium pricing as risk-averse industries lock in long-term confidentiality.
Channel ecosystems also matter. Vendors cultivate partnerships with system integrators that package encryption with zero trust assessments, cloud migration projects, and 5G deployments. Open-source libraries, such as OpenSSL 3.2, gain corporate backing to accelerate the rollout of hybrid classical-quantum cipher suites. As buyers favor consolidated platforms, suppliers able to bundle certificate automation, analytics, and threat detection alongside transport-layer encryption stand to capture upsell opportunities.
Network Encryption Industry Leaders
Thales Trusted Cyber Technologies
Juniper Networks Inc.
Atos SE
Certes Networks Inc.
Senetas Corporation Limited
- *Disclaimer: Major Players sorted in no particular order

Market Opportunities and Future Outlook
Post-quantum migration is creating whitespace around crypto-agility, hybrid deployments, and operational tooling that helps limit outage and compliance risk during algorithm transitions. NIST finalized core post-quantum standards in August 2024 (FIPS 203 ML-KEM, FIPS 204 ML-DSA, and FIPS 205 SLH-DSA), and 2026 activity shows these algorithms moving into mainstream network and identity stacks. Cloudflare making hybrid ML-KEM available for IPsec (April 2026) and Microsoft enabling both ML-DSA certificate issuance in AD CS (May 2026) and hybrid post-quantum key exchange in Windows TLS/Schannel (July 2026) support demand for certificate lifecycle automation, policy orchestration, and managed encryption services that can coordinate upgrades across endpoints, gateways, and cloud connectors.
Government timelines and sovereign-cloud programs are also catalyzing investment in key control and external key management architectures, particularly where buyers require keys to remain under customer control or within national jurisdictions. U.S. actions in 2026 increased urgency around post-quantum transition planning for federal-aligned networks, and Europe continues to operationalize NIS2-aligned controls and the Cyber Resilience Act, reinforcing encrypted communications and strong key governance as procurement requirements. On the supplier side, vendors are pushing protocol-layer and fabric-level implementations rather than isolated crypto libraries, including Palo Alto Networks operationalizing IETF-standard hybrid PQC across its SASE fabric in July 2026, which highlights opportunities for integrated SASE or WAN encryption, cloud-to-data-center protection, and multi-domain key management across on-premises, cloud, and telecom backbones.
Recent Industry Developments
- March 2026: Thales introduced the CN7000 series quantum-resistant network encryptors aimed at defense and intelligence use cases. The launch expands the addressable base for high-assurance, in-line encryption where certified hardware and long confidentiality periods are procurement requirements.
- June 2025: Juniper Networks validated a proof of concept for quantum-safe services over 5G mobile backhaul in collaboration with Turkcell and ID Quantique. The work links post-quantum security requirements directly to carrier transport modernization, supporting demand for encryption-capable routing, optical, and backhaul architectures.
- December 2024: Juniper Networks partnered with Quantum Bridge and Eurofiber to integrate advanced post-quantum cryptography into European network infrastructure. The collaboration underscores the move toward ecosystem-led deployments, where telecom operators and PQC specialists help drive interoperability and deployment patterns across regional backbones.


Research Methodology Framework and Report Scope
Market Definition and Coverage
For this methodology, the network encryption market covers revenue earned from tools and platforms that encrypt data as it moves across networks, including hardware and software, plus related implementation and support services.
Scope exclusions: We do not count general endpoint encryption, application-only encryption products, or non-security networking gear unless encryption is a primary, priced capability.
Segmentation Overview
- By Deployment Type
- Cloud
- On-premise
- By Component
- Hardware
- Solutions and Services
- By Organization Size
- Small and Medium-Sized Enterprises
- Large-Sized Enterprises
- By End-User Industry
- Telecom and IT
- BFSI
- Government
- Media and Entertainment
- Healthcare
- Defence and Aerospace
- Other End-User Industries
- By Geography
- North America
- United States
- Canada
- Mexico
- Europe
- Germany
- United Kingdom
- France
- Russia
- Rest of Europe
- Asia-Pacific
- China
- Japan
- India
- South Korea
- Australia
- Rest of Asia-Pacific
- Middle East and Africa
- Middle East
- Saudi Arabia
- United Arab Emirates
- Rest of Middle East
- Africa
- South Africa
- Egypt
- Rest of Africa
- Middle East
- South America
- Brazil
- Argentina
- Rest of South America
- North America
Data Sources, Market Sizing, and Validation
Desk Research
Desk research starts by mapping the real demand triggers for encrypting data in transit, and then tying them to measurable public signals. We leaned on widely available standards and policy sources, such as NIST cryptography guidance, ISO references, and security frameworks from organizations like CISA, because these documents influence enterprise adoption timing and refresh cycles.
To anchor the market inputs, we also reviewed public indicators such as telecom and broadband statistics (as proxies for traffic growth), government procurement portals for security-focused tenders, and cybersecurity incident reporting summaries where available. On the supply side, company filings, product documentation, investor presentations, and reputable press were used to understand pricing direction and packaging shifts between hardware appliances and software subscriptions. For specific cross-checks, we used paid subscriptions that provide company financial intelligence, patent lookups, and shipment-level trade signals where hardware moves are material. The desk sources listed here are illustrative only, and many other public documents were also read for data collection, validation, and clarification.
Primary Interviews and Surveys
Primary work focused on validating what gets purchased under network encryption budgets and what is bundled under adjacent security lines. We spoke with a mix of solution buyers, system integrators, and product-side specialists to pressure-test adoption drivers such as zero-trust rollouts and cloud connectivity, and then aligned assumptions across the Americas, EMEA, and APAC.
Their inputs were used to confirm typical deployment patterns, service attach rates, and realistic ASP movement, particularly where list pricing diverges from contracted pricing for larger deals.
Distribution of primary research fieldwork respondents
| Company type | Respondent position | Region |
|---|---|---|
| Top tier: 35% | CXOs: 18% | APAC: 49% |
| Mid tier: 46% | Functional/Unit leaders: 23% | EMEA: 29% |
| Smaller Players: 19% | Managers: 59% | Americas: 22% |
Market-Sizing & Forecasting
Sizing begins with a top-down build where enterprise and service-provider security spend is reconstructed into an addressable pool for encrypting data in transit, and then filtered by deployment realities across cloud and on-premise environments. The totals are corroborated with selective bottom-up checks, such as sampled ASP x volume for hardware deployments, services attach-rate checks, and channel feedback on typical refresh cycles, before final numbers are locked.
Key inputs used in the model include the on-premise versus cloud deployment mix, hardware versus solutions and services revenue split, adoption pace in regulated industries such as BFSI and government, network traffic growth linked to cloud and 5G activity, and the expected timing of cryptographic upgrades influenced by post-quantum readiness discussions. For forecasting, we relied on scenario analysis supported by expert consensus, where base, conservative, and accelerated cases are tied to variables such as migration speed to zero-trust architectures, compliance enforcement intensity, and the rate of cloud connectivity expansion. Where bottom-up coverage is incomplete, gaps are handled through calibrated ratios derived from comparable buyer cohorts, followed by a second pass of interview validation.
Data Validation & Update Cycle
Outputs are checked against independent market signals, then reviewed for variance by geography, deployment type, and component mix so obvious inconsistencies get flagged early. When an anomaly appears, the assumptions that drive it are traced back to the relevant input, and follow-up calls are triggered if the variance cannot be explained by a real-world event.
Before sign-off, a multi-step analyst review is done so the logic, calculations, and implied growth path are internally consistent. Reports are refreshed annually, with interim updates when material shifts occur, such as major standardization milestones, regulatory changes, or sudden pricing moves. Right before delivery, an analyst performs a fresh pass so clients receive the latest updated view.
Mordor Intelligence's Network Encryption Market Size Compared With Other Published Estimates
Published market values for network encryption can vary even when the same words are used, because the scope boundaries are often drawn differently and pricing treatment is not always consistent. The table helps show the spread, and it also hints at why the numbers do not line up.
The biggest gap drivers usually come from what is counted as network encryption versus broader security, how services and managed components are handled, and which year and exchange-rate timing is used for USD conversion. The table shows a tighter 2026 value versus higher and lower 2024 figures, and in Mordor Intelligence's model the market is sized across hardware plus solutions and services used specifically for encrypting data in transit, and then aligned to a 2026 base-year view with regional mix checks before forecasting to 2031.
Benchmark comparison
| Source | Market Size | Gaps in Research Methodology |
|---|---|---|
| Mordor Intelligence | USD 5.67 B (2026) | |
| Trade Journal A | USD 4.51 B (2024) | Uses a narrower interpretation that leans toward product revenue only and may exclude implementation and ongoing support services, which reduces the captured spend in larger deployments. |
| Industry Bulletin B | USD 5.18 B (2024) | Applies a broader umbrella that can blend adjacent encryption areas and then projects a uniform growth path, which can lift the total without checking component mix shifts between hardware and services. |
Overall, the gap across sources is mostly explained by scope edges and how services, packaging, and year conventions are treated. When the model is tied to clear spend drivers like deployment mix, component split, and regulated-industry adoption patterns, the resulting market value becomes easier to trace and repeat over time.


Key Questions Answered in the Report
What is the projected value of the network encryption space by 2031?
The sector is forecast to reach USD 8.37 billion by 2031.
Which deployment model is growing fastest for network encryption solutions?
Cloud-based deployments are expanding at a 9.87% CAGR through 2031.
Why is Asia Pacific considered the most dynamic region for network-level encryption?
Rapid 5G expansion, digital transformation programs, and evolving data protection laws are propelling a 8.86% regional CAGR.
Which end-user vertical shows the highest forward growth?
Healthcare leads with an 8.49% CAGR, driven by telehealth and electronic health record protection demands.
How are quantum computing advancements influencing encryption strategies?
Organizations are migrating to post-quantum algorithms and dual-cipher approaches in anticipation of cryptographically relevant quantum computers.
What inhibits broader SME adoption of advanced network encryption?
High implementation and recurring costs, along with limited in-house expertise, remain the main barriers despite growing cloud-based options.
Page last updated on:






