
Network Emulator Market Size and Share
Market Overview
| Study Period | 2020 - 2031 |
|---|---|
| Market Size (2026) | USD 0.33 Billion |
| Market Size (2031) | USD 0.54 Billion |
| Growth Rate (2026 - 2031) | 10.21 % |
| Fastest Growing Market | Asia Pacific |
| Largest Market | North America |
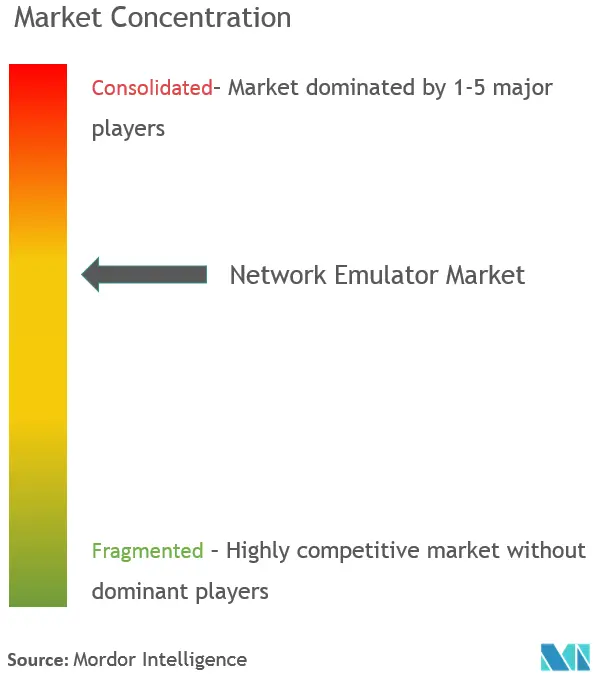
| Market Concentration | Medium |
Major Players *Disclaimer: Major Players sorted in no particular order Image © Mordor Intelligence. Reuse requires attribution under CC BY 4.0. | |
Network Emulator Market Analysis by Mordor Intelligence
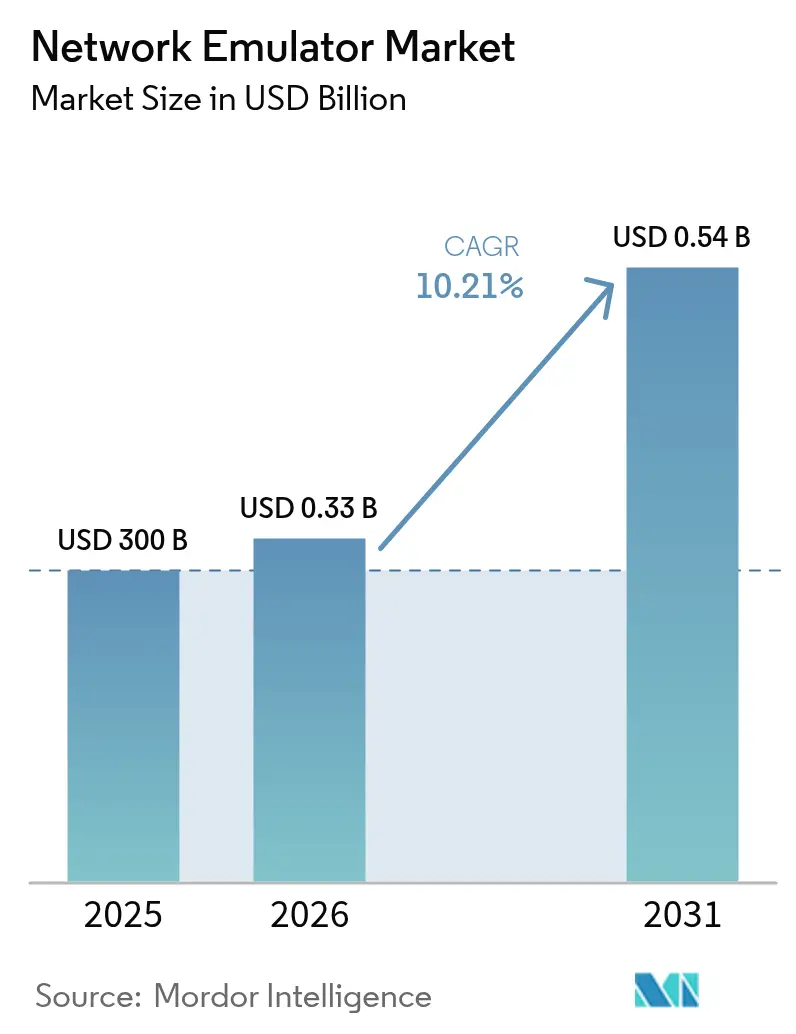
The network emulator market size was valued at USD 300 million in 2025 and estimated to grow from USD 330.63 million in 2026 to reach USD 538.1 million by 2031, at a CAGR of 10.21% during the forecast period (2026-2031). Momentum comes from 5G standalone upgrades, AI-centric data-center traffic, and regulatory scrutiny that requires nanosecond-level performance validation across critical infrastructure. Vendors are pivoting toward cloud-native, software-defined testing frameworks to keep pace with service-based 5G cores, LEO satellite backhaul, and automotive Ethernet traffic. Industry consolidation—typified by VIAVI Solutions’ USD 1.27 billion purchase of Spirent Communications—signals a strategic race to unify hardware, software, and assurance assets in one portfolio.[1]Keysight Technologies’ parallel deal structure, which divested Spirent’s high-speed Ethernet and security lines to VIAVI for USD 410 million, underlines how leading players are reshaping competitive boundaries while satisfying antitrust regulators.
Key Report Takeaways
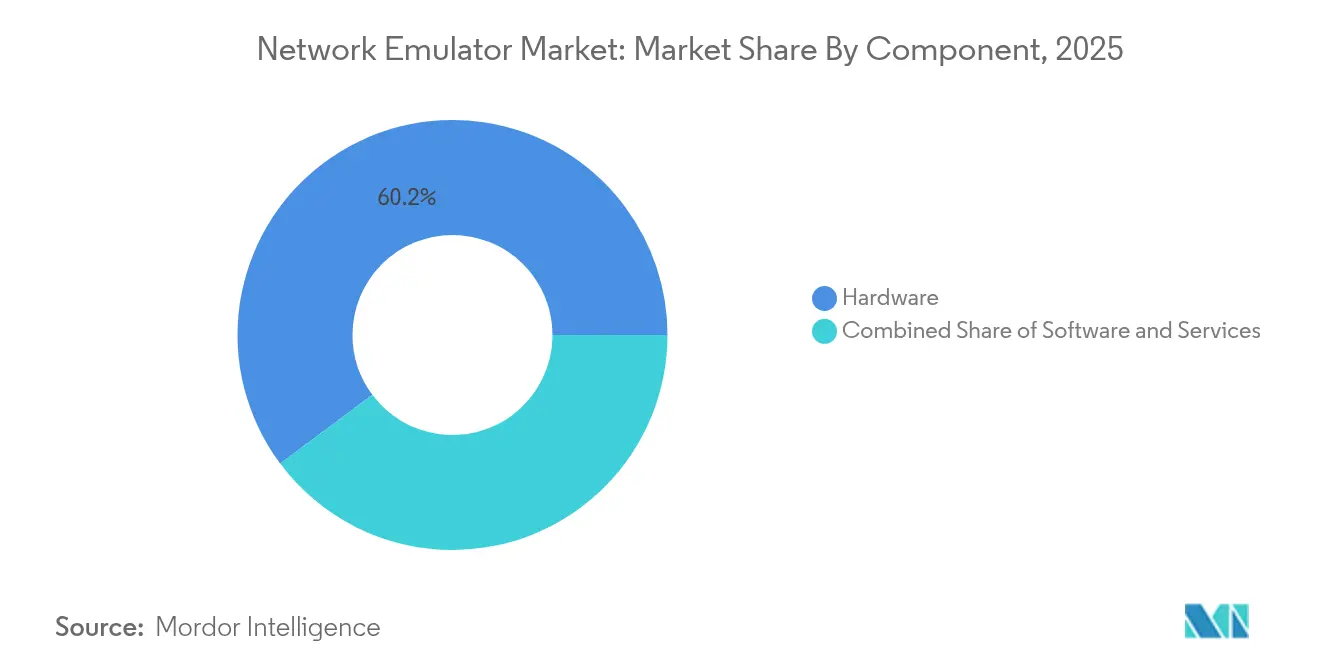
- By component, hardware commanded 60.20% of 2025 revenue, while the services segment is projected to grow the quickest at a 13.89% CAGR through 2031.
- By application, SD-WAN and SASE held 31.12% of 2025 revenue, whereas 5G RAN and Core testing is forecast to register the fastest 13.12% CAGR through 2031.
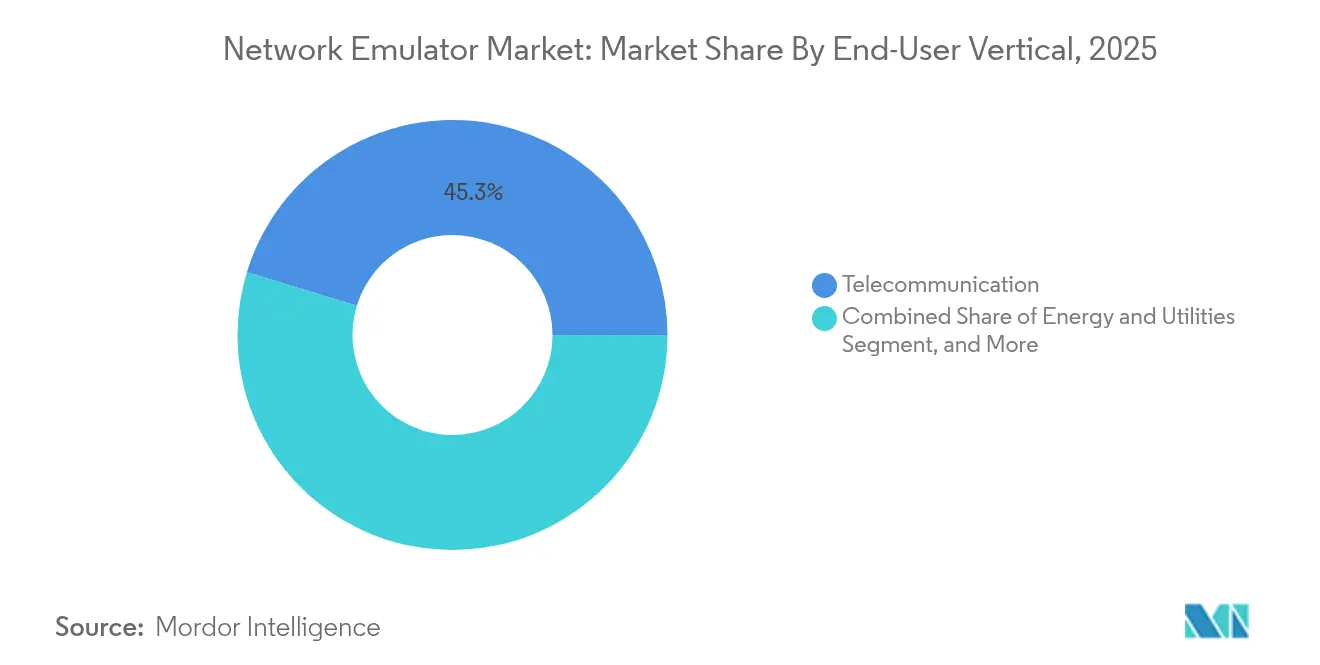
- By end-user vertical, telecommunications service providers accounted for 45.28% of 2025 revenue, but automotive and transportation is expected to expand at a 12.44% CAGR through 2031.
- By network type, 5G/LTE networks delivered both the largest 38.05% revenue share in 2025 and the quickest 13.4% CAGR outlook through 2031.
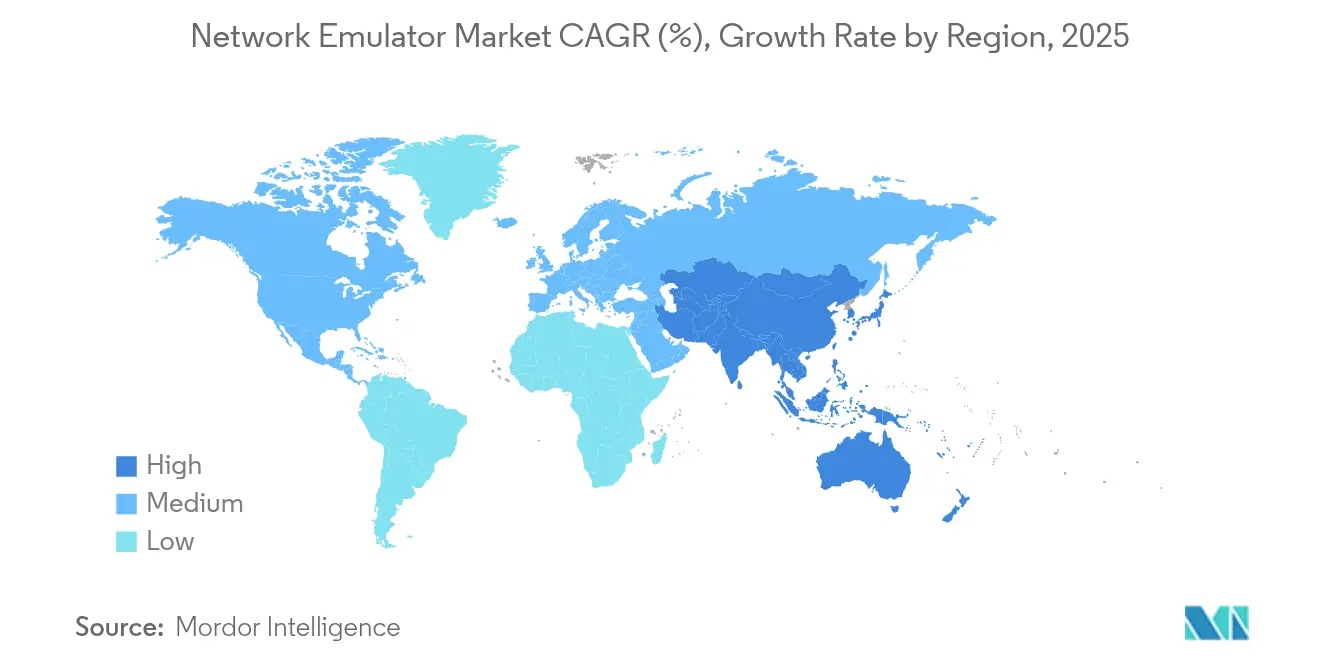
- By geography, North America led with a 37.35% revenue share in 2025, while Asia-Pacific is set to post the highest regional CAGR of 13.05% through 2031.
Note: Market size and forecast figures in this report are generated using Mordor Intelligence’s proprietary estimation framework, updated with the latest available data and insights as of 2026.
Market Trends and Insights
Drivers Impact Analysis of Network Emulator Market*
| Driver | (~) Impact on CAGR Forecast (~%) | Geographic Relevance | Impact Timeline |
|---|---|---|---|
| 5G stand-alone core roll-outs accelerating real-time test demand | +2.1% | Global; North America, China, South Korea lead | Medium term (2–4 years) |
| Surge in SD-WAN and SASE enterprise deployments | +1.8% | North America and EU; APAC gaining | Short term (≤ 2 years) |
| Adoption of cloud-native network digital twins for DevSecOps | +1.4% | Global; hyperscale data-center operators | Medium term (2–4 years) |
| Growing regulatory focus on critical-infrastructure resiliency testing | +1.2% | North America and EU; emerging in APAC | Long term (≥ 4 years) |
| Proliferation of LEO‐satellite broadband driving multi-link emulation | +0.9% | Global, with early adoption in rural North America and emerging markets | Long term (≥ 4 years) |
| Automotive software-defined vehicle (SDV) validation requirements | +1.6% | Global, concentrated in automotive manufacturing hubs | Medium term (2-4 years) |
| Source: Mordor Intelligence | |||
5G Stand-Alone Core Roll-outs Accelerating Real-Time Test Demand
Standalone 5G subscriptions reached 1.2 billion in 2024, with China and India adding the largest absolute numbers.[2] Operators must now validate service-based interfaces, network slicing, and microsecond synchronization without LTE anchors. NTT DoCoMo’s lab work with Keysight illustrates how tier-1 carriers rely on emulation to replicate beamforming and URLLC scenarios before field deployment. Precision requirements spill over into automotive V2X and industrial automation, elevating demand for network emulators that deliver deterministic timing.
Surge in SD-WAN and SASE Enterprise Deployments
Enterprises shifting from MPLS to software-defined fabrics need to prove dynamic path-selection logic and zero-trust policies at scale. VIAVI’s TeraVM emulates thousands of VPN clients to stress-test SASE links. Real-world evidence such as Sixt reducing latency 15% after adopting Cato Networks underscores why pre-deployment validation is now a board-level mandate. As vendors converge networking and security into single-vendor clouds, the network emulator market is widening toward multi-tenant SaaS test models.
Adoption of Cloud-Native Network Digital Twins for DevSecOps
Keysight’s Network Digital Twin ecosystem reproduces entire telco stacks, enabling CI/CD pipelines that continuously validate new VNFs against cyber-attack scenarios.[3] ISL Networks’ open 5G core server shows how smaller entrants leverage open-source to cut TCO for full-stack verification. The shift positions services teams as critical partners, explaining why the services segment leads CAGR growth.
Growing Regulatory Focus on Critical-Infrastructure Resiliency Testing
The FCC’s proposed BGP security rule would force broadband providers to simulate RPKI and ROA deployments at lab scale before production rollout. CISA’s FOCAL plan and Executive Order 14144 add governance mandates that translate into budget line-items for continuous emulation of attack chains. Compliance spending boosts premium testing demand, especially among energy, finance, and transportation operators classified as critical infrastructure.
Restraints Impact Analysis of Network Emulator Market*
| Restraint | (~) Impact on CAGR Forecast (~%) | Geographic Relevance | Impact Timeline |
|---|---|---|---|
| Limited availability of nanosecond-precision impairment hardware | –1.4% | Global; HFT hubs and 5G labs | Medium term (2–4 years) |
| Fragmented open-source tools diluting commercial ROI | –0.9% | Global; higher in academia and SMEs | Short term (≤ 2 years) |
| Budget freezes in 4G-focused CSPs of emerging economies | –0.7% | Africa, Latin America, Southeast Asia | Medium term (2–4 years) |
| Environmental regulations on electronic test-bed e-waste | –0.5% | EU; spreading to NA and APAC | Long term (≥ 4 years) |
| Source: Mordor Intelligence | |||
Limited Availability of Nanosecond-Precision Impairment Hardware
High-frequency traders demand 5–85 ns precision across 130+ exchanges, yet only a handful of Grandmaster-clock silicon vendors can meet IEEE-1588 compliance at volume. MiFID II pushes banks to migrate from NTP to PTP, inflating hardware costs and lengthening lead times. Similar timing rigor now applies to URLLC and V2X, constraining rapid uptake in segments that rely on off-the-shelf appliances.
Fragmented Open-Source Tools Diluting Commercial ROI
Mininet’s penetration across 100+ universities shows how containerized labs reproduce hundreds of nodes at near-zero cost.[4] VT-Mininet and CORE add virtual-time and NFV hooks, reducing the perceived gap with proprietary test suites. While open tools often falter at carrier scale, their “good enough” fidelity diverts entry-level customers, forcing vendors to differentiate via integrated analytics and support SLAs.
*Our forecasts treat driver/restraint impacts as directional, not additive. The impact forecasts reflect baseline growth, mix effects, and variable interactions.
Network Emulator Market Segment Analysis
By Component:
Services-Led Acceleration Redefines Hardware EconomicsHardware retained 60.20% share of the network emulator market in 2025, thanks to purpose-built impairment appliances for 400/800 G Ethernet and millimeter-wave 5G. Yet services revenue is pacing a 13.89% CAGR, outstripping any other component. Keysight reported that software-and-services now account for 39% of total sales, posting 16% ARR growth in Q1 2025, according to Keysight. Vendors are bundling perpetual licenses with managed support to monetize continuous testing across DevSecOps pipelines rather than one-time equipment drops.
The shift stems from cloud-native disaggregation: customers prefer subscription test-as-a-service that scales elastically with lab demand. Rohde & Schwarz positions its analytics service to benchmark 5G beamforming and MIMO, relieving operators from in-house tooling. Meanwhile, modular chassis like Anritsu’s MT8000A extend lifespan through firmware keys, protecting capex while steering users toward recurring support. This service surge is a structural pivot, ensuring that the network emulator industry maintains profitability even as hardware ASPs flatten.

By Application:
5G RAN and Core Testing Surges Ahead of SD-WAN MaturitySD-WAN and SASE retained 31.12% revenue leadership in 2025, buoyed by MPLS offload projects. However, 5G RAN and Core verification is the fastest-rising application at a 13.12% CAGR, reflecting worldwide standalone roll-outs. The network emulator market size for 5G test systems is projected to expand steadily as network slicing, URLLC, and non-terrestrial networking add layers of protocol complexity.
Open-RAN interoperability checks need emulators that pair RF impairment shelves with cloud PaaS simulators. Joint solutions from Rohde & Schwarz and VIAVI deliver O-RU conformance kits, giving manufacturers a turnkey route to NTIA funding eligibility. In parallel, Spirent’s A1 400G platform targets AI data-center fabrics, previewing demand beyond telecom toward high-density Ethernet. As SD-WAN penetrates even late-adopter SMBs, its growth moderates, but the installed base continues to purchase maintenance-heavy licenses, sustaining revenue.
By End-User Vertical:
Automotive Outpaces Traditional Telecom SpendTelecom operators still anchor 45.28% of 2025 revenue, yet automotive is sprinting at a 12.44% CAGR. Software-defined vehicle programs require fault-injection tests for automotive Ethernet, CAN-FD, and TSN, boosting orders for Keysight’s Novus mini launched in 2025. Defense-aerospace remains resilient as militaries validate satellite-cellular interoperability for battlefield comms, while banking underscores the latency race discussed earlier.
Automotive OEMs shift from prototype benches to over-the-air update validation in hardware-in-loop labs. UNH IOL’s independent TSN certification brings third-party assurance to suppliers. This demand profile nudges traditional telecom-centric vendors into adjacent mobility and industrial segments, diversifying revenue while cementing higher gross margins relative to commoditized carrier spending.
By Network Type:
5G/LTE Dual Leadership Shows No Sign of Plateau5G/LTE commands 38.05% of 2025 sales and concurrently registers the highest CAGR at 13.4%. That dual leadership underscores a still-early upgrade cycle: transition from NSA to SA demands wholesale re-testing of core and RAN slices. Network emulator market share gains for 5G products will persist while Open-RAN, NTN, and 6G research extend the roadmap.
Wi-Fi 6/7 test demand rises as enterprises push extended-reality use cases that strain deterministic latency. Ethernet/IP continues its central role as AI lifts demand for 400 G and 800 G leaf-spine fabrics. Meanwhile, satellite operators running LEO constellations need multi-link emulation to model Doppler shift and differential delay before commercial activation, fueling an emerging niche that commands premium contract values.
Geography Analysis
North America Network Emulator Market
North America generated 37.35% of 2025 revenue, propelled by 5G mid-band deployments, Wall Street latency mandates, and cybersecurity statutes such as Executive Order 14144 that compel continuous resilience testing. The same region hosts head offices for VIAVI, Keysight, and Spirent’s Ethernet unit, concentrating R&D and reinforcing home-market advantage. AI-centric data-centers in Silicon Valley and Northern Virginia are early adopters of 800 G traffic emulation, catalyzing local sales pipelines.
APAC Network Emulator Market
Asia-Pacific is the fastest-growing region with a 13.05% CAGR. China and India deploy standalone 5G at a massive scale, pushing local OEMs to procure advanced emulation gear. Median 5G download speeds already reach 524 Mbps in Kuala Lumpur, underscoring aggressive spectrum utilization. Japan fosters open-source-driven test labs such as ISL Networks’ 5GC server, enabling lower TCO for domestic carriers upgrading rural coverage. Automotive supply chains in Japan and South Korea amplify demand for TSN and Ethernet validation.
EMEA Network Emulator Market
Europe shows mature yet steady expansion. The WEEE Directive 2012/19/EU obliges vendors to design recyclable test equipment, increasing BOM scrutiny and nudging a shift toward modular, software-defined chassis. Germany’s automotive cluster invests in in-vehicle network testing, while the EU’s focus on open, secure supply chains makes Open-RAN conformance a strategic priority supported by NTIA’s allied funding window. In smaller Middle East and African markets, budget limits steer operators toward open-source plus light commercial tooling, but the long-term 4G-to-5G upgrade path will slowly lift ASPs.
Regulatory Landscape
Regulation and standardization increasingly affect how network emulators are specified, validated, and procured for telecom and other critical-infrastructure use cases. In the United States, the Federal Communications Commission published a Final Rule in the Federal Register on May 15, 2026 that strengthens oversight of Telecommunications Certification Bodies (TCBs) and associated measurement facilities and test labs, including priority review tied to trusted testing pathways. This tighter equipment-authorization governance raises the bar for traceable lab results, repeatable impairment profiles, and auditable test data for vendors serving broadband, enterprise, and public-sector programs.
At the standards level, bodies are also tightening test procedures and programmable interfaces to match the market shift toward software-defined and cloud-native testing environments. ITU-T issued Recommendations Q.4077 and Q.4078 (2025) on Testbed as a Service (TaaS) API concepts, while ITU-T Recommendation Q.3956 (April 2025) codifies VoNR and ViNR interconnection testing for roaming and interworking scenarios, reinforcing emulator demand in voice and video assurance. India added another procurement anchor in May 2026, when the Telecommunication Engineering Centre (TEC) notified an Essential Requirements standard for SD-WAN equipment (TEC 30072603), reinforcing structured pre-deployment validation across SD-WAN and SASE-heavy enterprise networks.
Value Chain Analysis
The network emulator value chain starts with upstream electronic and timing-critical inputs, including high-speed PHY and timing components (for IEEE-1588/PTP-aligned designs), RF and microwave modules for 5G testbeds, and high-frequency interconnects used in 400/800G-class platforms. Core OEMs and specialists such as Keysight Technologies, Spirent Communications, VIAVI Solutions, Apposite Technologies, Calnex Solutions, PacketStorm Communications, Aukua Systems, Polaris Networks, and TETCOS LLP then integrate impairment engines, traffic generation, and analytics into appliances and, increasingly, software-defined stacks aligned to cloud labs and digital-twin workflows.
Go-to-market activity is weighted toward direct sales and field engineering for tier-1 operator labs, defense programs, and large enterprises, with additional reach via international distributors. For software-forward offerings, distribution also extends through cloud marketplaces and subscription delivery models. Downstream value is captured in professional services, managed support, and continuous-testing enablement for CI/CD, where customers require reproducible scenarios across 5G core, SD-WAN/SASE policy validation, automotive Ethernet, and satellite backhaul. Bottlenecks remain concentrated in scarce RF systems engineering talent, along with constrained availability of precision, nanosecond-grade impairment and synchronization capabilities, which can extend lead times for advanced configurations.
Competitive Landscape
Industry consolidation is reshaping vendor hierarchies. VIAVI’s USD 1.27 billion Spirent acquisition combines radio, core, and assurance assets under one roof, expanding cross-sell potential into satellite, aerospace, and security segments for investors. Keysight’s carve-out of Spirent’s Ethernet line for USD 410 million adds high-density port emulation to its IXIA stable while sidestepping concentration concerns.
Patent velocity indicates where next-gen competition will emerge. Meta’s filing on low-latency path failover algorithms for extended reality highlights big-tech influence on enterprise test needs. Qualcomm’s XR streaming patents require multi-link emulation across cellular and Wi-Fi, creating fresh SKU opportunities. Rohde & Schwarz posted EUR 2.93 billion FY 2024 revenue, citing 23% order growth on security-centric test systems. Keysight’s Communications Solutions Group delivered USD 1.30 billion in Q1 2025 with 5% YoY rise, backed by auto-Ethernet test orders.
Open-source remains a disruptive undercurrent but rarely displaces tier-1 buying centers that mandate turnkey support. Vendors counter price erosion by embedding analytics, AI-driven root-cause engines, and cloud-hosted lab orchestration. Early movers in quantum-safe cryptography testing, such as VIAVI’s Inertial Labs pick-up, are designing differentiation ahead of regulatory demand curves. As a result, competitive intensity is migrating from bit-rate races to solution breadth and compliance coverage.
Network Emulator Industry Leaders
-
Spirent Communications plc
-
Apposite Technology, Inc.
-
iTrinegy
-
Polaris Networks
-
Keysight Technologies Inc
- *Disclaimer: Major Players sorted in no particular order
Network Emulator Market Companies Covered in this Report
- Keysight Technologies, Inc.
- Spirent Communications plc
- Viavi Solutions Inc.
- Apposite Technologies, Inc.
- iTrinegy (now part of Calnex Solutions)
- Polaris Networks
- PacketStorm Communications, Inc.
- Aukua Systems, Inc.
- InterWorking Labs (IWL)
- GigaNet Systems
- Candela Technologies
- GL Communications
- Calnex Solutions plc
- Anritsu Corporation
- Rohde & Schwarz
- OctoScope (Spirent)
- Netropy (Apposite)
- Veryx Technologies
- IP NetFusion
- JDS Test & Measurement
Market Opportunities and Future Outlook
The key whitespace is operationalizing network digital twins as production-adjacent test environments, not just offline simulations. Standardization and vendor platforms are pulling this forward, with 3GPP work on Network Digital Twin (NDT) management in Release 19 and ETSI ZSM alignment around closed-loop orchestration reinforcing demand for emulation that is API-driven, multi-domain (RAN, core, transport, edge), and synchronized enough to support automated validation and troubleshooting.
On the platform side, NVIDIA introduced the Aerial Omniverse Digital Twin (March 2025) to connect wireless training, simulation (PHY/MAC), and deployment workflows. This broadens the set of emulator workflows that vendors can plug into across AI-native wireless and lab automation. Another opportunity centers on higher-speed, lossless Ethernet and AI-data-center fabrics, where deterministic impairment, congestion behavior, and timing fidelity become differentiators beyond telecom. This vector ties to emulator requirements for 400G/800G traffic, precise buffering, and repeatable failure injection for distributed AI clusters, while also converging with SD-WAN/SASE validation needs as enterprise networking and security stacks move toward unified cloud delivery. Academic and engineering advances also point to deeper automation as a purchasing criterion, such as the publication of COREX (January 2026) as a framework for automating distributed digital twins and emulated cyber ranges, highlighting a shift toward orchestration and repeatability rather than only raw port density.
Recent Industry Developments in Network Emulator Market
- April 2026: Calnex Solutions introduced Transparent 400G Network Emulation to support validation of lossless Ethernet AI clusters. The release targets the rising need to reproduce congestion-control and timing behaviors that impact AI training fabrics. It also expands emulation use cases beyond telecom labs into data-center and HPC validation environments where 400G adoption is accelerating.
- March 2025: VIAVI Solutions agreed to acquire Spirent Communications for USD 1.27 billion, targeting portfolio expansion across radio, core, and assurance testing. The combination reshapes competitive bundling by aligning network emulation with broader service assurance and lifecycle testing offerings. It also signals a consolidation path where large vendors unify hardware and software assets to serve multi-domain test requirements.
- February 2025: Spirent unveiled the A1 400G AI-traffic emulator, positioned for AI workload and high-density Ethernet validation. The platform underscores the market shift toward emulating bursty, east-west traffic patterns common in AI data centers rather than only carrier-centric scenarios. It strengthens Spirent's relevance in cloud and data-center segments where emulator buyers increasingly demand both throughput and realistic application behavior.
Network Emulator Market Report Scope and Research Methodology
Market Definition and Coverage
The network emulator market is defined as revenues earned from tools that recreate real network conditions so teams can test application and network behavior before deployment, during upgrades, and while troubleshooting. This includes emulator software, appliances, and related support services sold to enterprises and service providers.
Scope exclusions: This sizing excludes general network monitoring tools, packet capture-only products, and pure simulation that does not emulate live network impairment behavior.
Segments Covered in This Report
- By Component
- Hardware
- Software
- Services
- By Application
- SD-WAN and SASE
- Cloud and Data-Centre
- IoT and Industrial
- 5G RAN and Core
- Satellite and Aerospace
- By End-user Vertical
- Telecommunication Service Providers
- Defense and Aerospace
- Banking and Financial Services
- Technology and Cloud Providers
- Automotive and Transportation
- Energy and Utilities
- Other Enterprises
- By Network Type
- 5G / LTE
- Wi-Fi 6/7
- Ethernet/IP
- LEO / GEO Satellite
- By Geography
- North America
- United States
- Canada
- Mexico
- South America
- Brazil
- Argentina
- Europe
- Germany
- United Kingdom
- France
- Italy
- Russia
- Asia Pacific
- China
- India
- Japan
- South Korea
- ASEAN
- Rest of Asia Pacific
- Middle East
- Saudi Arabia
- UAE
- Turkey
- Rest of Middle East
- Africa
- South Africa
- Rest of Africa
- North America
Data Sources, Market Sizing, and Validation
Desk Research
Desk work starts with public datasets that help frame where emulation demand shows up and how it changes across regions. We used sources such as FCC releases and ITU indicators for broadband and mobile trends, NIST and ETSI publications for testing and network function standards, and OECD digital economy statistics for broader connectivity context. For technology direction, we also referenced IETF RFCs and open standards notes that point to shifts such as Wi-Fi 6/7 capabilities and 5G core behavior.
To translate that context into a commercial view, we reviewed annual reports and investor decks of relevant testing and networking suppliers, along with earnings call commentary that often clarifies mix shifts between hardware, software licenses, and services. Patent databases were checked selectively to spot where investment was rising in areas like impairment modeling and automation. We also reviewed reputable press coverage and public tender notices when they indicated larger lab refresh cycles. These examples are not exhaustive, and other sources were used for data collection, validation, and research clarification.
Primary Interviews and Surveys
Primary work focused on validating how buyers budget for emulation and what gets counted as emulator spend versus adjacent test gear. We spoke with a mix of product leaders, lab managers, network architects, and procurement contacts across telecom operators, cloud and technology providers, defense-linked users, and enterprise IT teams. Coverage across major regions was used to pressure-test assumptions and reduce obvious overcounts.
Distribution of primary research fieldwork respondents
| Company type | Respondent position | Region |
|---|---|---|
| Top tier: 31% | CXOs: 18% | APAC: 45% |
| Mid tier: 48% | Functional/Unit leaders: 24% | EMEA: 30% |
| Smaller Players: 21% | Managers: 58% | Americas: 25% |
Market-Sizing & Forecasting
Sizing is built using a top-down and bottom-up approach, where global and regional demand is reconstructed from the installed base of networks and test labs that actively validate performance under impaired conditions. That demand pool is translated into spending using adoption rates for emulation in key use cases and an average selling price path that reflects the split between appliances, software licenses, and services.
Inputs used in the model include indicators such as 5G rollout intensity and core modernization timing, Wi-Fi 6/7 enterprise refresh patterns, cloud and data center traffic growth expectations, the share of testing tied to SD-WAN and SASE projects, and the expansion of IoT and industrial deployments that require latency and jitter validation. In practice, totals are checked with selective bottom-up approximations such as sampled pricing for common configurations, channel conversations on deal size ranges, and revenue mix commentary from supplier disclosures. Where direct signals were weak, we handled gaps using conservative penetration bands.
For forecasting, we rely mainly on scenario analysis linked to network upgrade cycles, with variables adjusted based on expert feedback about procurement lead times and lab refresh frequency. Scenarios are then blended into a base case, which helps keep the five-year view realistic when telecom capex or enterprise IT spend is expected to shift.
Data Validation & Update Cycle
Validation is done through repeated cross-checks, not a single pass. Model outputs are compared against independent signals such as telecom upgrade timing, public standards activity, and the observed shift from hardware-led labs to software-defined testing. Variances are reviewed to confirm they have a clear explanation. If a number appears off for a region or end-user group, we re-check the underlying assumptions and, when needed, re-contact sources to confirm what is being purchased and how it is budgeted.
Before sign-off, the work is reviewed in steps so that logic, inputs, and arithmetic are checked separately, followed by a final sanity check against recent news and financial disclosures. Reports are refreshed annually, and interim updates are triggered when material events occur, such as major product changes, pricing shifts, or demand shocks. Right before delivery, an analyst performs a fresh pass so clients receive the latest updated view.
Mordor Intelligence's Network Emulator Market Size Compared With Other Published Estimates
Published market values for network emulators can differ even when the topic name appears similar, because each estimate chooses its own boundary for what counts as emulator revenue and which buyers are included. Differences also come from how pricing is assumed to evolve for software-based tools, and whether growth is tied to actual network upgrade timelines or to a smoother trendline.
Shipment and lab refresh signals tied to 5G core work, SD-WAN and SASE testing activity, and cloud and data center performance validation are used to keep Mordor Intelligence's 2026 total aligned to emulator-specific spend rather than broader test and measurement budgets. Gaps usually show up when one study includes adjacent performance monitoring tools, or when services and support are treated inconsistently across regions. Currency conversion timing and the chosen starting year also affect the number, particularly in a market still shifting from appliances to licenses.
Benchmark comparison
| Source | Market Size | Gaps in Research Methodology |
|---|---|---|
| Mordor Intelligence | USD 0.33 B (2026) | |
| Global Consultancy A | USD 0.29 B (2024) | Uses an earlier base year and may apply a narrower inclusion of emulator spending, with some test categories treated as separate lines, which reduces the observed total. |
| Industry Publisher B | USD 0.34 B (2026) | Reports a similar year but tends to use broader regional rollups and longer-horizon trend assumptions, which can lift the figure if adjacent lab software and bundled support are counted inside emulator revenue. |
The spread in the table is mainly explained by scope boundaries and timing choices, not by disagreement on the core demand drivers. By keeping inputs tied to identifiable upgrade cycles and by separating emulator tools from nearby test categories, the resulting market value stays traceable and repeatable when the model is refreshed.
Key Questions Answered in the Report
What is driving the rapid growth of the network emulator market?
5G standalone migrations, SD-WAN & SASE roll-outs, and tighter cybersecurity mandates jointly propel a 10.21% CAGR through 2031.
Which component segment is expanding fastest?
Services, growing at a 13.89% CAGR, outpace hardware as customers shift toward subscription-based, cloud-hosted test environments.
How big is the opportunity in 5G RAN & Core testing?
5G RAN & Core is the fastest-growing application, advancing at 13.12% annually as operators validate slicing, URLLC, and non-terrestrial extensions.
Why is Asia-Pacific the hottest regional market?
Massive standalone 5G builds in China, India, and Japan plus government-backed tech programs yield a 13.05% regional CAGR.
How are mergers reshaping competitive dynamics?
VIAVI’s and Keysight’s Spirent transactions blend core, Ethernet, and security assets, creating larger portfolios that bundle hardware, software, and assurance.
What level of market concentration exists?
The market earns a score of 6 on a 1–10 scale, meaning the top five control≈60% share, leaving meaningful room for niche and regional challengers.