
Network Centric Warfare Market Size and Share
Market Overview
| Study Period | 2020 - 2031 |
|---|---|
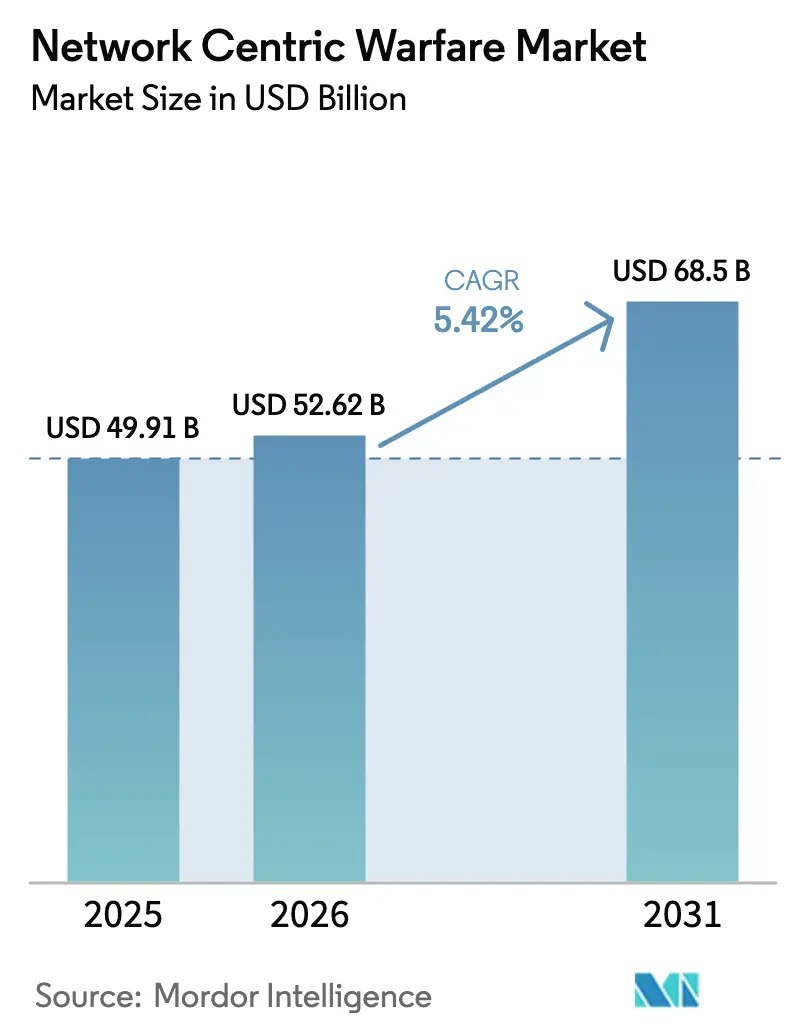
| Market Size (2026) | USD 52.62 Billion |
| Market Size (2031) | USD 68.5 Billion |
| Growth Rate (2026 - 2031) | 5.42 % |
| Fastest Growing Market | Asia-Pacific |
| Largest Market | North America |
| Market Concentration | Medium |
Major Players *Disclaimer: Major Players sorted in no particular order Image © Mordor Intelligence. Reuse requires attribution under CC BY 4.0. | |
Network Centric Warfare Market Analysis by Mordor Intelligence
The network-centric warfare (NCW) market size was valued at USD 49.91 billion in 2025 and estimated to grow from USD 52.62 billion in 2026 to reach USD 68.5 billion by 2031, at a CAGR of 5.42% during the forecast period (2026-2031). Intensifying great-power competition, multi-domain operations doctrine, and rapidly rising C4ISR budgets are accelerating adoption of data-centric architectures, artificial intelligence (AI) decision aids, and resilient communications across land, air, naval, space, and cyber domains. The US Department of Defense (DoD) alone earmarked USD 21.1 billion for command, control, communications, computers, and intelligence (C4I) programs in fiscal 2025, a clear signal of funding priority. Battlefield experience—from NATO’s Steadfast Defender 2024 exercises to combat in Ukraine—confirms that forces with secure, real-time data links and automated analytics gain decisive advantages in targeting precision and operational tempo. Hardware still underpins the NCW market, but software-defined capabilities, AI tools, and open modular systems architecture (MOSA) compliance drive the fastest incremental spending, creating new opportunities for agile vendors able to meet zero-trust cybersecurity mandates and coalition interoperability requirements.
Key Report Takeaways
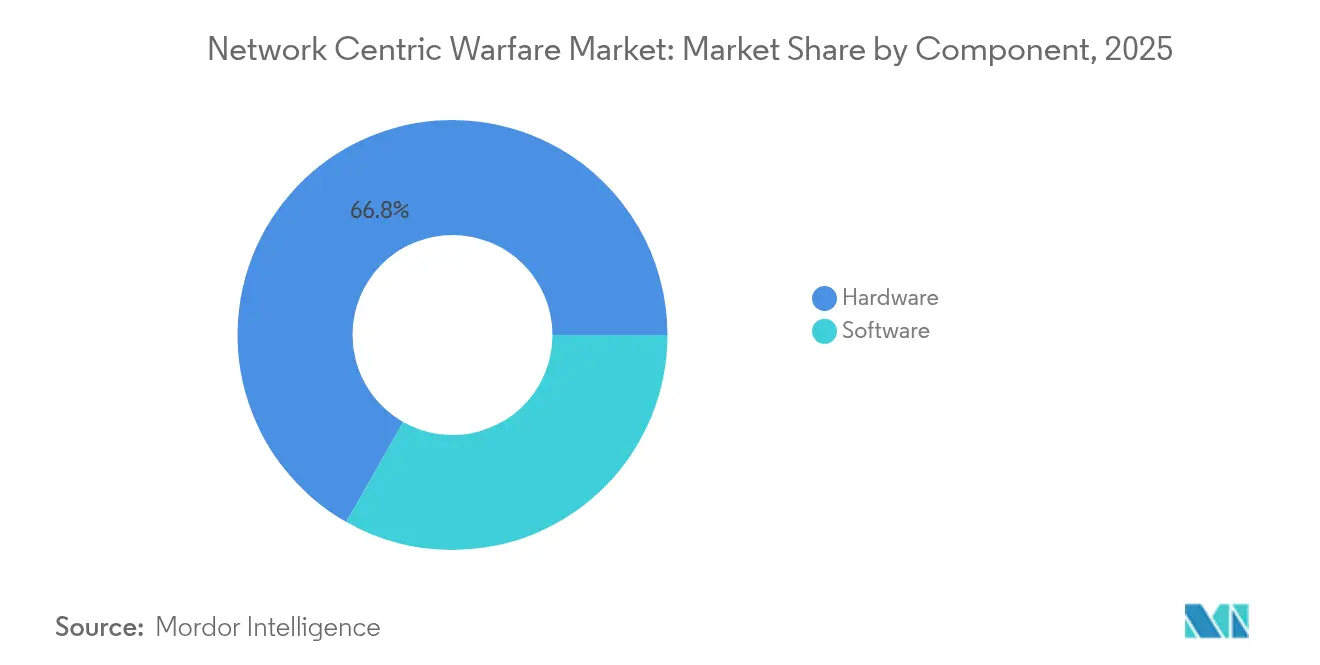
- By component, hardware captured 66.78% of the NCW market share in 2025, while software is forecasted to post the highest CAGR at 6.12% to 2031.
- By platform, land systems commanded 53.64% of the NCW market size in 2025; naval applications are projected to grow fastest at a 6.28% CAGR through 2031.
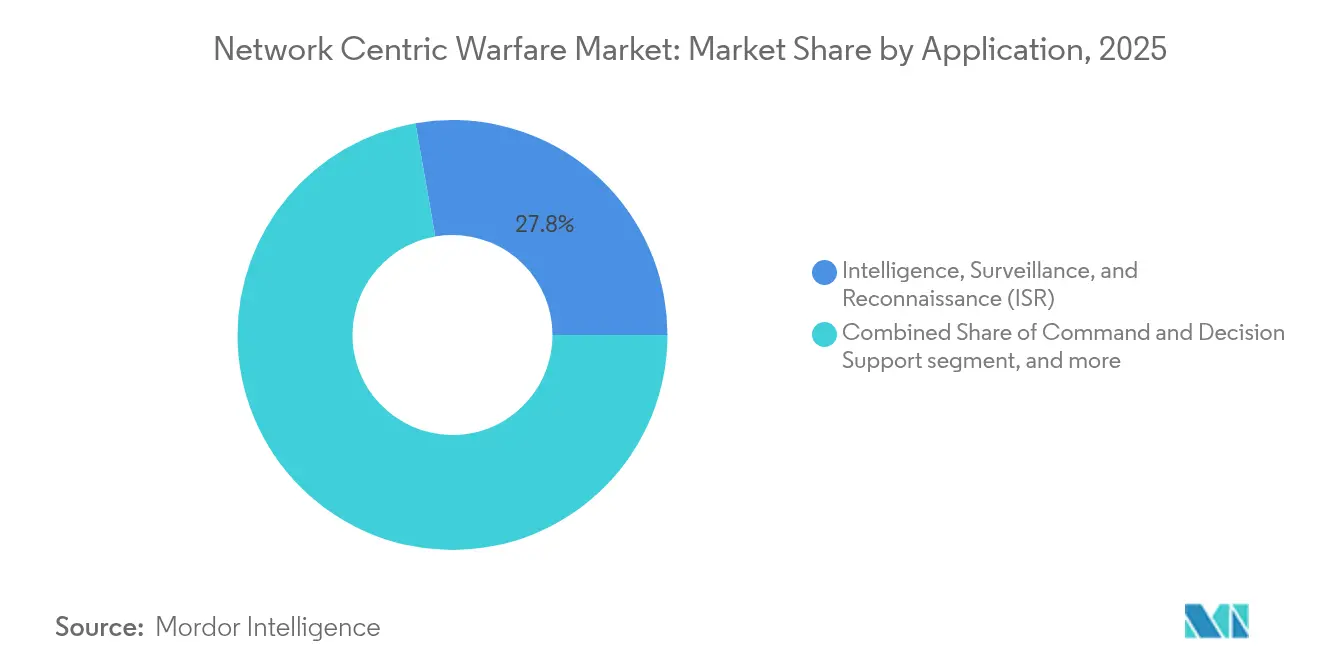
- By application, ISR led with 27.76% revenue share in 2025; electronic and cyber warfare is advancing at the highest 6.6% CAGR to 2031.
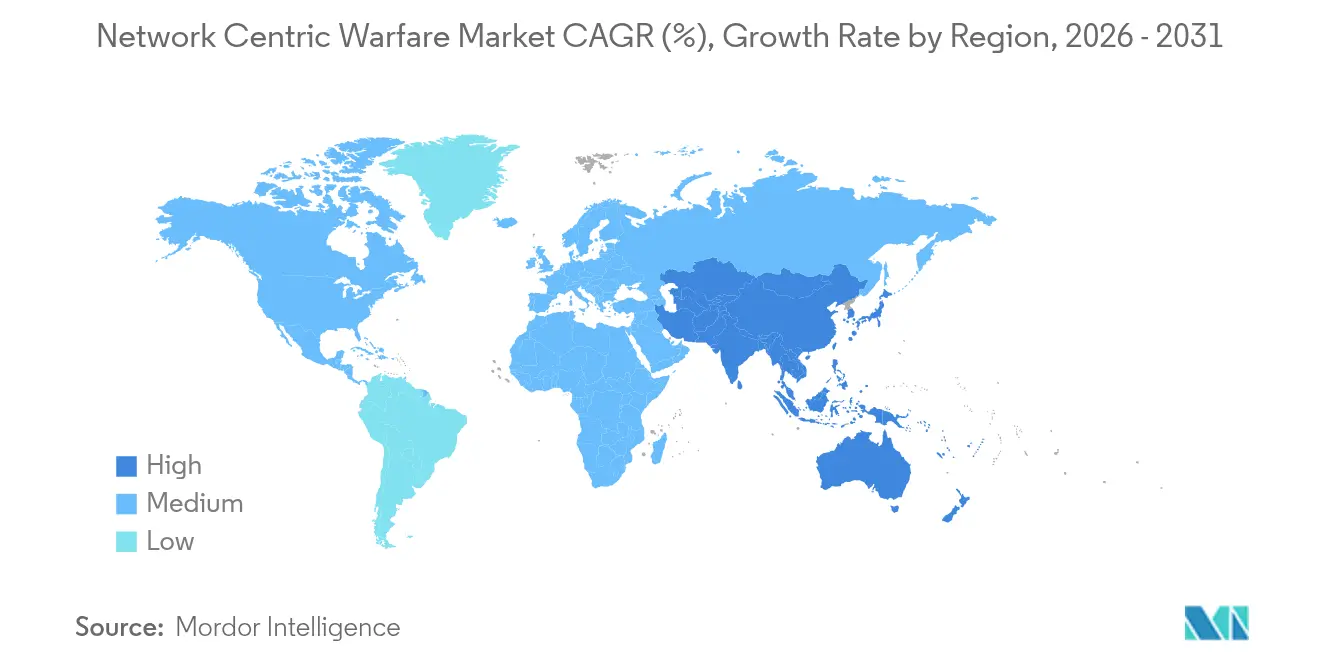
- By geography, North America held 38.21% of the NCW market size in 2025, whereas Asia-Pacific is set to expand at the quickest 6.41% CAGR during the forecast period.
Note: Market size and forecast figures in this report are generated using Mordor Intelligence’s proprietary estimation framework, updated with the latest available data and insights as of 2026.
Market Trends and Insights
Drivers Impact Analysis of Network Centric Warfare Market*
| Driver | (~) % Impact on CAGR Forecast | Geographic Relevance | Impact Timeline |
|---|---|---|---|
| Rising defense budget allocations for C4ISR modernization | +1.8% | Global, led by North America and Europe | Medium term (2-4 years) |
| Growing demand for real-time situational awareness and interoperable command and control (C2) | +1.5% | Asia-Pacific, NATO partners | Short term (≤ 2 years) |
| Increased integration of unmanned and autonomous defense platforms | +1.2% | North America, Europe, Asia-Pacific | Medium term (2-4 years) |
| Transition to open MOSA and software-defined architectures | +0.9% | Global, spearheaded by US DoD | Long term (≥ 4 years) |
| Adoption of commercial LEO constellations for resilient communications | 0.7% | Global, with early adoption in North America and Europe | Short term (≤ 2 years) |
| Battlefield-proven success of CJADC2 accelerating global adoption | 0.6% | NATO allies, AUKUS partners, Indo-Pacific coalition members | Medium term (2-4 years) |
| Source: Mordor Intelligence | |||
Rising Defense Budget Allocations for C4ISR Modernization
Steady budget growth anchors the NCW market as governments elevate information superiority to a strategic imperative. Fiscal 2025 US spending assigns USD 21.1 billion to C4I, a material uplift that underwrites tactical data link upgrades, edge cloud nodes, and AI-enabled fusion engines. Germany is on track to devote 3.5% of GDP to defense by 2029, and the EU’s SAFE facility will mobilize EUR 150 billion (USD 176.06 billion) for industrial reinforcement. Higher outlays accelerate procurement cycles, shorten fielding timelines, and cement long-term demand for secure, interoperable networks that bind sensors, shooters, and commanders across domains.
Growing Demand for Real-Time Situational Awareness and Interoperable Command and Control (C2)
NATO’s Steadfast Defender 2024 proved that mission partner kits and data-centric platforms can push intelligence to 32 allied nations in seconds, driving coalition demand for jam-resistant waveforms and common data fabrics.[1] The Ukraine conflict highlighted the vulnerability of legacy radios, spurring rapid adoption of Low Earth Orbit (LEO) satellite back-haul and protected tactical waveforms. Programs like Australia’s Land 4140 aim to deliver 5G-class connectivity to maneuver units from 2025 onward, pushing network-centric capabilities to the tactical edge.
Increased Integration of Unmanned and Autonomous Defense Platforms
Autonomous air, surface, and ground vehicles add distributed sensors and weapons nodes, reshaping kill chains across the Network Centric Warfare market. US policy now prioritizes domestic drone procurement, fast-tracking hundreds of systems and reallocating savings toward additional buys. Anduril Industries secured over USD 800 million in 2024 contracts, including USD 642 million for Marine Corps counter-UAS solutions, underscoring commercial entrants’ ability to deliver AI-enabled autonomy at pace. Multinational exercises show swarming drones feeding data to joint command nodes, extending reach while compressing decision times.
Transition to Open MOSA and Software-Defined Architectures
Modular open systems break vendor lock-in, letting militaries upgrade by software patch rather than hardware rip-and-replace. Lockheed Martin’s USD 4.1 billion C2BMC-Next missile-defense award stresses software-configurable elements that can adapt to threat evolution through code updates. The US Army’s Handheld, Manpack, and small Form Fit radios pivot to waveform-agnostic designs, easing coalition interoperability and lowering lifecycle costs. Adoption curves will steepen as zero-trust baselines demand continuous cyber hardening, best delivered through agile software pipelines.
Restraints Impact Analysis of Network Centric Warfare Market*
| Restraint | (~) % Impact on CAGR Forecast | Geographic Relevance | Impact Timeline |
|---|---|---|---|
| Complexity and cost of integrating legacy systems | -1.4% | NATO members with extensive legacy assets | Long term (≥ 4 years) |
| Rising cybersecurity and zero-trust compliance challenges | -1.1% | North America, Europe | Medium term (2-4 years) |
| Semiconductor supply chain disruptions affecting secure radios and ASICs | -0.8% | Global, with concentrated impact on Asia-Pacific supply chains | Short term (≤ 2 years) |
| Spectrum congestion and vulnerability to EW and jamming | -0.6% | Regional hotspots including Eastern Europe, Indo-Pacific contested areas | Medium term (2-4 years) |
| Source: Mordor Intelligence | |||
Complexity and Cost of Integrating Legacy Systems
Decades-old radios and command posts remain operational, forcing militaries to field gateways that translate between analog and IP, classified and unclassified, and coalition and national networks. The US Government Accountability Office warns that MOSA implementation often incurs higher near-term costs than anticipated, straining budgets for new capability inserts.[2] European armies confront similar hurdles as diverse national systems must interoperate under NATO standards, exemplified by Germany’s extensive bridging of SINCGARS-era radios with Soveren digital sets. These integration burdens can delay modernization schedules and dilute available resources for next-generation buys, tempering overall NCW market growth.
Rising Cybersecurity and Zero-Trust Compliance Challenges
Zero-trust architectures mandate continuous verification of every user, device, and data transaction, creating latency and bandwidth overhead that can impair time-sensitive targeting. The US Air Force’s roadmap details thousands of endpoints requiring identity and device attestation, encryption, and micro-segmentation, all under contested bandwidth conditions AF.MIL. Contractors must certify against NIST 800-171 and CMMC 2.0, adding documentation workloads and personnel costs that small businesses struggle to absorb. Coalition operations further complicate the picture, as disparate national cyber standards hinder information sharing and joint planning.
*Our forecasts treat driver/restraint impacts as directional, not additive. The impact forecasts reflect baseline growth, mix effects, and variable interactions.
Network Centric Warfare Market Segment Analysis
By Component:
Software Momentum Reshapes Capability IntegrationHardware accounted for 66.78% of the NCW market size in 2025, dominated by tactical radios, data links, sensors, and rugged servers that anchor fielded networks. Yet software revenue is expanding at a 6.12% CAGR—outpacing the overall NCW market—as defense organizations pivot toward AI algorithms, data-fusion engines, and application-layer security updates. Lockheed Martin’s C2BMC-Next illustrates the value of deploying new threat libraries via software push, while L3Harris’s AN/PRC-163 radio receives waveform patches that unlock advanced coalition interoperability.
Software’s appeal stems from rapid iteration cycles, lower hardware dependence, and alignment with MOSA and zero-trust mandates. Developers can field resiliency features and cyber counter-measures in weeks instead of multiyear hardware refreshes, a crucial advantage against agile peer adversaries. Hardware demand persists, but supply-chain shocks in semiconductors and RF components elongate lead times, tilting budget allocation toward adaptable code solutions. This divergence reinforces a structural up-shift toward software-centric procurement across the NCW market.

By Platform:
Naval Growth Accelerates Under Maritime CompetitionLand forces retained 53.64% of the NCW market size in 2025 due to the digitization of brigades and the explosion of edge computing at the tactical level. The US Army’s Project Convergence and Australia’s Land 4140 exemplify the race to embed robust, mobile networks into maneuver formations. Air platforms continue to absorb investment for long-range ISR and strike networking, including MQ-4C Triton’s maritime surveillance feeds.
Naval programs, however, show the fastest 6.28% CAGR as Indo-Pacific tensions amplify the need for distributed maritime operations. BAE Systems’ USD 85 million Network Tactical Common Data Link upgrade will equip carriers and Constellation-class frigates with secure, full-motion video and voice sharing at sea. Similar initiatives in Canada and Japan deploy multi-band data links and LEO SATCOM pipes aboard surface combatants. Growing reliance on unmanned surface and subsurface vehicles further boosts maritime networking demand, reinforcing naval momentum within the broader NCW market.
By Application:
Electronic and Cyber Warfare Gains Strategic PriorityISR captured a 27.76% share in 2025, reflecting the value of persistent sensing and AI-powered exploitation. Capabilities range from overhead satellites to unattended ground sensors feeding common operational pictures. Command and decision-support platforms mix cloud-based analytics, machine-learning models, and enterprise data fabrics to compress planning cycles and enhance kill-chain velocity.
Electronic and cyber warfare, however, leads growth at a 6.6% CAGR as near-peer competitors demonstrate sophisticated jamming and cyber intrusion tools. Russia’s GPS denial tactics in Ukraine exposed vulnerabilities in precision-guided munitions (PGMs), prompting urgent investment in anti-jam antennas, spectrum management, and cognitive electronic warfare (EW) suites. L3Harris’s protected tactical waveform experiments with LEO satellites show how commercial space assets help harden Link 16 against interference. As adversaries weaponize the electromagnetic spectrum, spending on offensive disruption tools and defensive resiliency solutions will keep EW at the forefront of the NCW market.
Geography Analysis
North America Network Centric Warfare Market
North America retained 38.21% of the NCW market size in 2025 on the strength of US Department of Defense programs such as CJADC2 and Open DAGIR, alongside Canada’s tactical data-link modernization. Multibillion-dollar awards—for example, Lockheed Martin’s USD 4.1 billion C2BMC-Next and Palantir’s Maven Smart System—anchor a mature industrial base and secure year-to-year funding lines. Ongoing zero-trust rollouts and software-defined radios (SDRs) will sustain regional demand even as budgets plateau post-2026.
Europe Network Centric Warfare Market
Europe is accelerating digital command capabilities under NATO interoperability mandates and escalating regional threats. Defense mergers and acquisitions hit USD 2.3 billion in 1H 2025—a 35% year-on-year surge—as primes acquire niche cyber and AI firms to close technology gaps. Germany’s Digitalisation of Land-Based Operations program and France’s laser optical communications initiatives illustrate continental commitment to hardened networks and sovereign industrial capacity.
APAC Network Centric Warfare Market
Asia-Pacific represents the fastest 6.41% CAGR growth region, driven by China’s Information Support Force formation in 2024 and allied responses through 5G-grade battlefield networks and space-enabled situational awareness. Australia’s Integrated Battlefield Telecommunications Network reached final operational capability in 2024, while Japan and India expand joint ISR architectures to counter regional coercion. These programs and rising domestic content rules create a multi-billion-dollar runway for local integrators and US allies across the Network Centric Warfare market.
Regulatory Landscape
Network-centric warfare programs operate within defense acquisition, cybersecurity, and interoperability policy frameworks that increasingly bake data-sharing and open architecture requirements into solicitations. In the United States, the Department of Defense CJADC2 strategy and related guidance place oversight with the Chief Digital and Artificial Intelligence Officer (CDAO), reinforcing enterprise-level direction for data, AI, and cross-domain integration that shapes requirements for C2, ISR, and communications programs.
Independent oversight and audit activity also feeds into compliance expectations. A GAO review (GAO-25-106454) calls for a comprehensive framework to align investments with CJADC2 goals, while a DoD Inspector General evaluation (DODIG-2025-126) examines a CJADC2 line of effort focused on mission partner information sharing, highlighting coalition interoperability and controlled data release as core governance topics for NCW architectures.
Value Chain Analysis
The NCW value chain runs from mission and requirements definition (defense ministries and joint commands) to architecture and standards bodies that set interoperability expectations, then to prime-led systems integration that connects sensors, networks, data platforms, and effectors. Major contractors such as Lockheed Martin, Northrop Grumman, RTX, BAE Systems, and Thales anchor solution design and integration, while subsystem suppliers provide tactical radios, data links, sensors, rugged compute, crypto, and networking components that feed platform and command-post upgrades.
Value increasingly shifts to software-defined layers, including data mesh services, AI-enabled fusion and decision tools, and security controls that support cross-domain integration and coalition data sharing. That shift expands integration work across DoD and Intelligence Community data sources and elevates the role of DevSecOps pipelines, identity and access controls, and gateway solutions that bridge legacy networks, while procurement and inter-service coordination continue to constrain rollout pace end to end.
Competitive Landscape
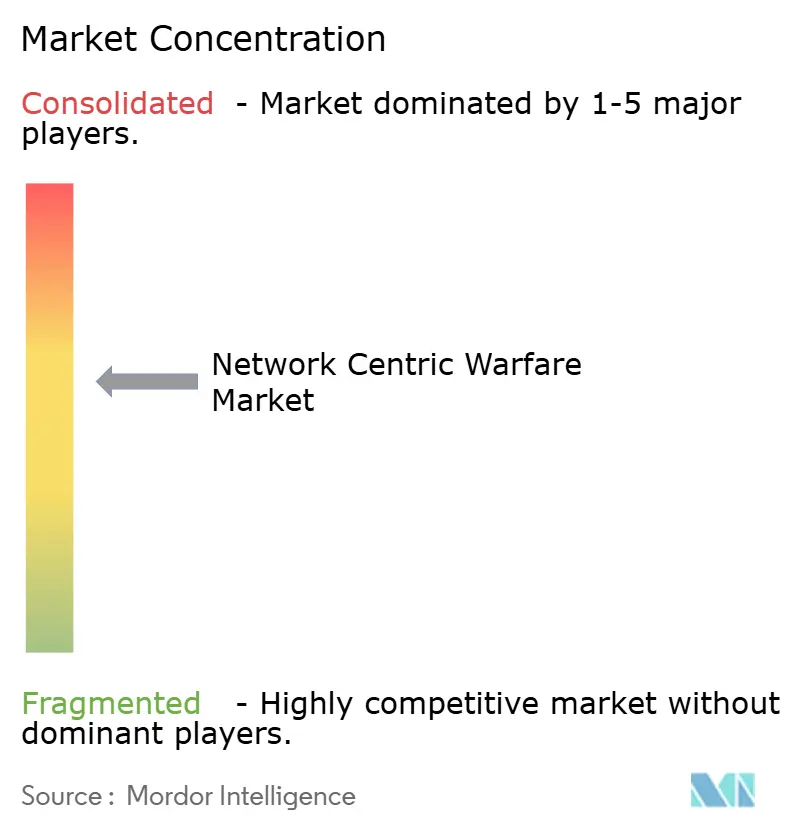
The NCW market features moderate concentration. Five prime contractors—Lockheed Martin Corporation, Northrop Grumman Corporation, RTX Corporation, BAE Systems plc, and Thales Group—maintain leading positions through systems integration breadth and long-standing customer relationships. Emerging technology firms are eroding share by specializing in data analytics, autonomy, and cloud architectures.
Consolidation trends intensify as incumbents acquire capabilities to fill gaps quickly. Simultaneously, cooperative research agreements pair primes with small innovators on quantum-secure cryptography, AI-enabled spectrum sensing, and commercial-military space fusion. Differentiation hinges on meeting MOSA, zero-trust, and rapid-upgrade requirements at lower total ownership cost—a shift that favors software subscriptions and DevSecOps pipelines over hardware platform counts.
Regulatory scrutiny in the US and EU can delay large mergers, steering firms toward minority investments and joint ventures. Nonetheless, rising geopolitical risk and the imperative to field integrated, cyber-resilient solutions will keep deal flows active across the NCW market.
Network Centric Warfare Industry Leaders
-
Northrop Grumman Corporation
-
Lockheed Martin Corporation
-
RTX Corporation
-
Thales Group
-
BAE Systems plc
- *Disclaimer: Major Players sorted in no particular order
Network Centric Warfare Market Companies Covered in this Report
- Lockheed Martin Corporation
- Northrop Grumman Corporation
- RTX Corporation
- Thales Group
- BAE Systems plc
- L3Harris Technologies, Inc.
- Leonardo S.p.A.
- Elbit Systems Ltd.
- Saab AB
- CACI International Inc.
- HENSOLDT AG
- Indra Sistemas, S.A.
- Rheinmetall AG
- Israel Aerospace Industries Ltd.
- Singapore Technologies Engineering Ltd.
- Rohde & Schwarz GmbH & Co. KG
- Meshdynamics, Inc.
Market Opportunities and Future Outlook
One clear opportunity is CJADC2-aligned development, experimentation, and scaling of data-centric architectures, where funding visibility depends on formal budget lines and enterprise oversight. The US DoD FY26 budget request includes USD 297.8 million for JADC2 Development and Experimentation Activities under the CDAO, supporting a pipeline for vendors offering data fabrics, AI-enabled decision tools, integration middleware, and test and instrumentation capabilities that move prototypes into fieldable joint solutions.
Coalition and mission-partner interoperability also creates whitespace around governed data sharing, cross-domain integration, and common operational picture services that operate within national caveats and differing cyber standards. The CJADC2 line of effort assessed in DODIG-2025-126 places mission partner information sharing as an execution focus, which increases demand for policy-compliant information exchange, releasability tooling, and zero-trust-aligned security implemented in software-defined network architectures (including Open DAGIR-oriented approaches) that can be adapted across platforms and theaters.
Recent Industry Developments in Network Centric Warfare Market
- July 2026: Lockheed Martin demonstrated software-driven command and control integration during Valiant Shield 2026, connecting sensors, weapons, and command nodes including C2BMC alongside systems such as Aegis Guam, THAAD, and IBCS. The event highlighted multi-domain integration workflows and the practical role of open, software-centric interfaces in speeding integration across heterogeneous air and missile defense assets.
- April 2026: The UK Ministry of Defence and Lockheed Martin Skunk Works conducted Exercise Babel Fish to demonstrate interoperability by sharing F-35 data into the NEXUS command-and-control environment and linking it to British Army ground effectors. The demonstration reinforced the market pull for mission partner kits, open data standards, and cross-domain integration that connect air platforms to land-based C2 and fires.
- July 2024: The US Navy purchased Persistent Systems networking devices to support expeditionary littoral operations and improve resilient communications in distributed environments. The procurement underscored continued investment in tactical networking hardware and mesh capabilities that extend data sharing to the edge for dispersed units.
Network Centric Warfare Market Report Scope and Research Methodology
Market Definition and Coverage
For this study, the market covers defense spending on network centric warfare capabilities that connect platforms, sensors, and command nodes, so information can be shared securely and used for faster decisions during operations.
Scope exclusions: It excludes general purpose IT infrastructure that is not procured or budgeted as a defense NCW, C4ISR, or mission network capability.
Segments Covered in This Report
- By Component
- Hardware
- Software
- By Platform
- Land
- Air
- Naval
- By Application
- Intelligence, Surveillance, and Reconnaissance (ISR)
- Command and Decision Support
- Communications and Data Links
- Targeting and Fire Control
- Electronic and Cyber Warfare
- By Geography
- North America
- United States
- Canada
- Mexico
- Europe
- United Kingdom
- France
- Germany
- Italy
- Rest of Europe
- Asia-Pacific
- China
- India
- Japan
- South Korea
- Rest of Asia-Pacific
- South America
- Brazil
- Rest of South America
- Middle East and Africa
- Middle East
- Saudi Arabia
- United Arab Emirates
- Rest of Middle East
- Africa
- South Africa
- Rest of Africa
- Middle East
- North America
Data Sources, Market Sizing, and Validation
Desk Research
Desk research was used to set the demand context and build clean reference points for defense budgets, procurement priorities, and modernization roadmaps that influence NCW adoption. We typically anchor these inputs using public sources such as SIPRI military expenditure data, IISS defense spending summaries, US DoD budget justification documents, NATO interoperability and capability publications, and ITU spectrum and communications references.
To avoid overcounting, the desk phase also tracks how programs are described across public announcements, contract notices, and parliamentary or congressional documents, then checks against annual reports and investor presentations where available. For select tasks such as contract award tracking, shipment cues, patent signals, and defense tender monitoring, paid subscriptions are used where they add traceable structure without changing the market definition. The sources named here are illustrative only, and many additional public and paid references are reviewed to collect, validate, and clarify the data.
Primary Interviews and Surveys
Primary work was carried out through expert interviews and structured surveys with defense program stakeholders, system integrators, domain specialists, and procurement informed respondents across major buying regions. This step helped confirm what is funded as NCW capability versus what is being trialed, and it reduced uncertainty around deployment timelines, refresh cycles, and the split between hardware and software spending.
Distribution of primary research fieldwork respondents
| Company type | Respondent position | Region |
|---|---|---|
| Top tier: 39% | CXOs: 15% | APAC: 40% |
| Mid tier: 46% | Functional/Unit leaders: 42% | EMEA: 33% |
| Smaller Players: 15% | Managers: 43% | Americas: 27% |
Market-Sizing & Forecasting
Market sizing starts from a top-down reconstruction that follows defense outlays into mission network, C4ISR, and digitization funding pools, then filters those pools using adoption and integration intensity across land, air, and naval forces. Once these pools are shaped, we cross-check totals using selective bottom-up approximations such as sampled contract values, program family rollups, and volume estimates based on typical unit pricing for key equipment classes.
Key model inputs include annual defense and C4ISR related budget lines, modernization and readiness priorities, platform upgrade cycles, the pace of data-link and secure communications rollouts, and reported activity in electronic and cyber warfare programs. Because multi-year programs can shift between approval and execution, gaps are handled with timing adjustments based on procurement lead times and delivery schedules shared by interviewees.
Forecasting uses scenario analysis supported by trend smoothing. The base case spending growth is linked to budget outlooks and validated demand indicators. Assumptions are reviewed with primary respondents so growth is not derived only from headline budgets, but also from realistic integration capacity and doctrine adoption pace.
Data Validation & Update Cycle
Validation is done through repeated cross-checks so one data stream does not determine the final number. We compare model output with independent signals such as defense budget movement, major program milestones, and the cadence of contract announcements, then investigate variances that fall outside expected ranges.
Before sign-off, the work goes through multi-step analyst reviews, with re-contact triggers when assumptions change materially, such as a large procurement delay, a new doctrine push, or a major budget reallocation. Reports are refreshed annually, with interim updates for material events, and a final pre-delivery review is completed so clients receive the latest updated view.
Mordor Intelligence's Network Centric Warfare Market Size Measured Against Other Published Estimates
Published market values for network centric warfare can differ even when they sound similar, because the spending line items are not labeled consistently across countries and program stages. Differences also come from whether estimates follow awarded and funded programs, or whether they additionally count aspirational roadmaps that have not moved into procurement.
The spread is usually explained by scope choices, year of currency conversion, and how fast pricing and software content are assumed to rise over time. Some sources roll adjacent categories like broader command and control and non-mission enterprise networks into the total, while others take a narrower view that only counts defense mission network investments tied to ISR, communications and data links, and targeting related workloads, which is the approach used by Mordor Intelligence.
Benchmark comparison
| Source | Market Size | Gaps in Research Methodology |
|---|---|---|
| Mordor Intelligence | USD 52.62 B (2026) | |
| Global Research Publisher A | USD 51.20 B (2021) | Uses an earlier base year and mixes pandemic period spend patterns with longer term growth, which can compress the mid-cycle upgrade rebound and shift the level lower when translated to later years. |
| Strategic Research Firm B | USD 63.70 B (2028) | Reports a different time point and may include broader C4ISR adjacent spending and regional program bundles, which can lift the total when platform and application boundaries are not separated clearly. |
Looking across the table, the main differences come from the base year chosen and how closely the model ties demand to funded mission programs versus broader modernization themes. By keeping inputs traceable to budget signals, platform upgrade cadence, and validated procurement timing, the final number stays explainable and repeatable for planning use cases.
Key Questions Answered in the Report
What is the 2026 value of the Network Centric Warfare market?
The Network Centric Warfare (NCW) market size reached USD 52.62 billion in 2026.
How fast will spending on network-centric naval platforms grow through 2031?
Naval programs are forecasted to register a 6.28% CAGR, the fastest among platform categories.
Which component segment is expanding quickest?
Software solutions lead growth with a 6.12% CAGR, driven by AI, MOSA compliance, and zero-trust security updates.
Why is Asia-Pacific the fastest-growing region?
China’s information warfare investments and allied counter-modernization push regional CAGR to 6.41% through 2031.
Who are the leading companies in this space?
Lockheed Martin Corporation, Northrop Grumman Corporation, RTX Corporation, BAE Systems plc, and Thales Group hold prominent positions.