
Netherlands Used Car Market Size and Share
Market Overview
| Study Period | 2020 - 2031 |
|---|---|
| Forecast Data Period | 2026 - 2031 |
| Base Year Market Size (2025) | USD 39.71 Billion |
| Market Size (2026) | USD 41.46 Billion |
| Market Size (2031) | USD 51.45 Billion |
| Growth Rate (2026 - 2031) | 4.41 % |
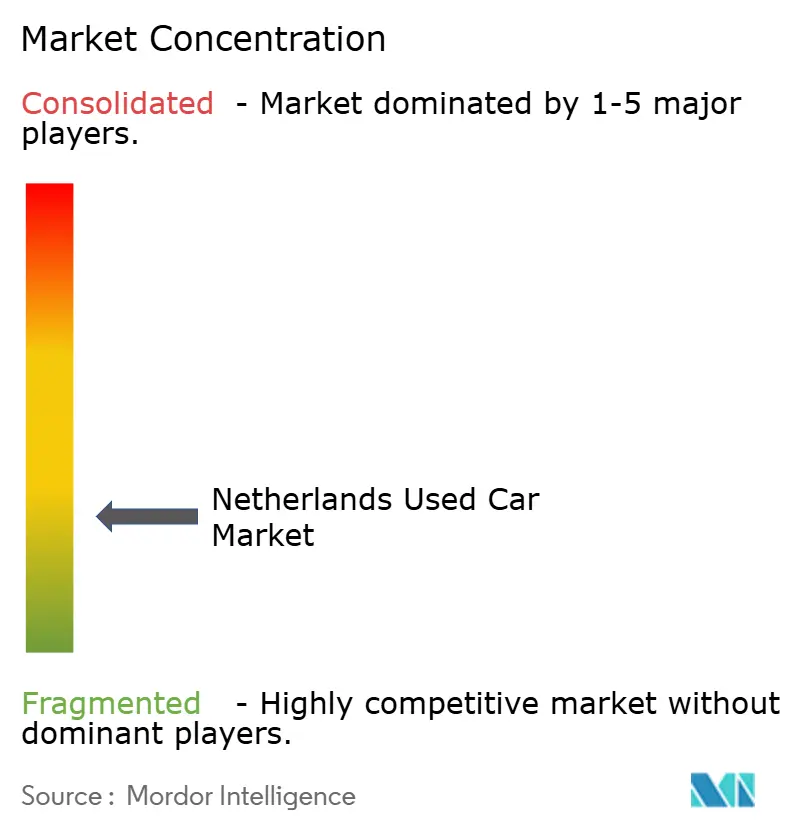
| Market Concentration | Low |
Major Players *Disclaimer: Major Players sorted in no particular order Image © Mordor Intelligence. Reuse requires attribution under CC BY 4.0. | |
Netherlands Used Car Market Analysis by Mordor Intelligence
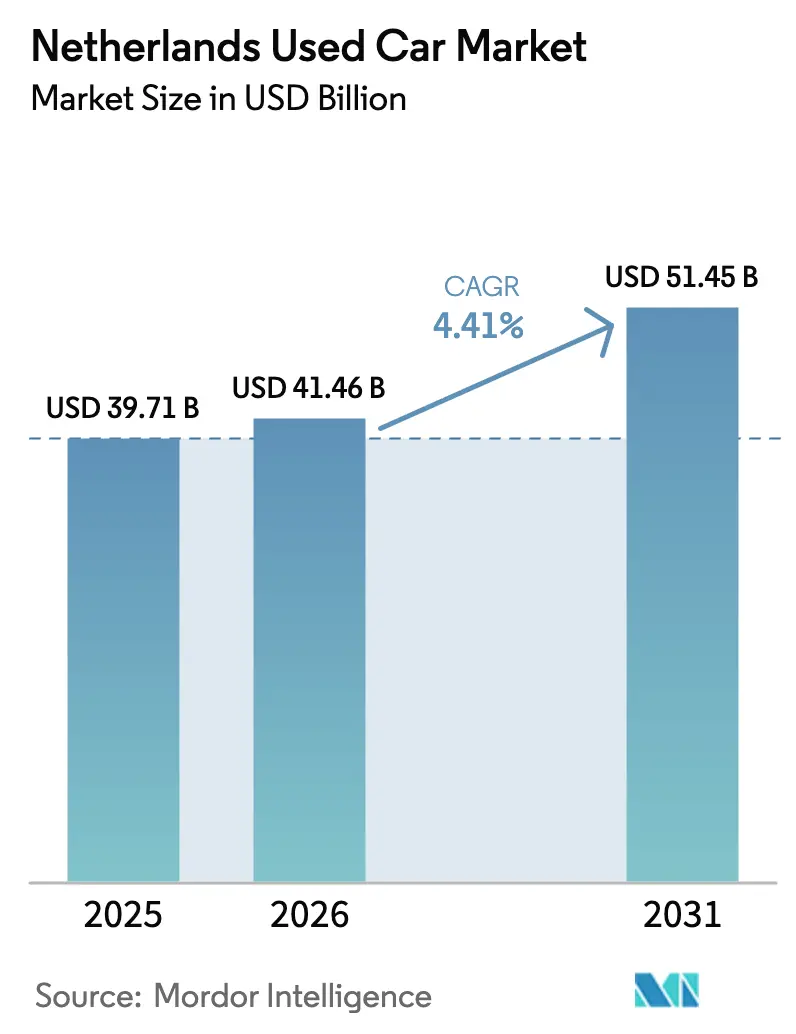
The Netherlands' used car market size in 2026 is estimated at USD 41.46 billion, growing from 2025 value of USD 39.71 billion with 2031 projections showing USD 51.45 billion, growing at 4.41% CAGR over 2026-2031. Sustained demand for affordable mobility, a steady influx of nearly-new corporate fleet vehicles, and robust digital retail infrastructure form the core growth engine. Regulatory milestones such as zero-emission zones across 29 municipalities reshape replacement cycles while WLTP-driven fleet tax changes expand late-model supply. Hatchbacks anchor volume, yet the SUV cohort expands faster due to lifestyle preferences and electric-ready platforms. Dealer consolidation, the rise of omnichannel storefronts, and embedded-finance APIs compress transaction friction, allowing vendors to tap broader audiences without geographic limits. Market risks include high financing costs, odometer fraud in parallel imports, and technological obsolescence in older models.
Key Report Takeaways
- By vehicle type, hatchbacks led with 43.85% of the Netherlands' used car market share in 2025, whereas SUVs are projected to log the fastest 8.78% CAGR to 2031.
- By vendor type, the organized dealer channel held 58.74% share of the Netherlands used car market size in 2025 and is expanding at a 6.83% CAGR through 2031.
- By fuel type, petrol cars accounted for 52.66% share of the Netherlands' used car market size in 2025, while battery electric vehicles are climbing at a 10.25% CAGR to 2031.
- By vehicle age, the 3-5 year bracket captured 31.44% of the Netherlands' used car market share in 2025, and the 0-2 year segment is forecast to widen at a 9.05% CAGR through 2031.
- By price segment, the USD 11,501-17,500 band commanded 21.45% share of the Netherlands used car market size in 2025, whereas cars priced above USD 35,000 are set to rise at an 7.74% CAGR.
- By sales channel, online platforms contributed 43.02% to the Netherlands' used car market size in 2025, and pure-play e-retailers are scaling at a 9.36% CAGR.
Note: Market size and forecast figures in this report are generated using Mordor Intelligence’s proprietary estimation framework, updated with the latest available data and insights as of 2026.
Netherlands forms part of a network that extends across countries and regions, each contributing to a shared international environment. The global used car market outlook by Mordor Intelligence consolidates those connections.
Netherlands Used Car Market Trends and Insights
Drivers Impact Analysis*
| Driver | (~) % Impact on CAGR Forecast | Geographic Relevance | Impact Timeline |
|---|---|---|---|
| Rising Consumer Demand for Affordable Mobility Amidst Inflation | +1.2% | Netherlands, spillover to Belgium and Germany | Short term (≤ 2 years) |
| Rapid Digitalization and Omnichannel Retail Models | +1.1% | Netherlands, leading EU digital transformation | Medium term (2-4 years) |
| Expansion of OEM-Backed Certified-Pre-Owned (CPO) Programs | +0.8% | Netherlands, with early adoption in Randstad region | Medium term (2-4 years) |
| Zero-Emission-Zone (2025) Policy Accelerating ICE Replacement | +0.8% | Netherlands, 29 municipalities with ZE-zones | Short term (≤ 2 years) |
| Corporate-Fleet Churn From WLTP Tax Changes Boosting Nearly-New Supply | +0.7% | Netherlands, with secondary effects in EU markets | Short term (≤ 2 years) |
| Embedded-Finance APIs Enabling Instant Credit and Insurance Bundling | +0.6% | Netherlands, early fintech adoption markets | Long term (≥ 4 years) |
| Source: Mordor Intelligence | |||
Rising Consumer Demand for Affordable Mobility Amidst Inflation
Inflation pushes new-car prices beyond reach for many households, steering purchasers toward quality used cars that trim the total cost of ownership. Fleet operators are offloading internal-combustion assets ahead of tighter environmental rules, swelling nearly-new supply at compelling price points. Dutch BPM tax revisions scheduled for 2025 further accelerate this rotation by erasing key exemptions for commercial vehicles. Financing patterns adjust in tandem, with lenders stretching terms so customers can hold monthly payments steady while stepping into higher-spec models.
Expansion of OEM-Backed Certified Pre-Owned Programs
Automakers strengthen brand affinity and margin control through warranties and refurbishment standards that lift consumer trust. Organized dealers gain momentum because CPO inventory sits within their partner network. The ten largest dealer groups, which own new-car throughput, deploy centralized reconditioning hubs and real-time inventory tools that small independents cannot replicate. Connected-car telematics adds another layer of transparency by confirming mileage and maintenance history, a key antidote to odometer fraud.
Rapid Digitalization and Omnichannel Retail Models
Online platforms accounted for more unit transfers in 2024, and pure-play e-retailers are scaling at double-digit speed. Dutch broadband penetration and high digital literacy clear the path for end-to-end online journeys that combine virtual showrooms with home delivery. Dealers introduce artificial-intelligence pricing engines and image-based condition scans to keep pace with 24-hour consumer research cycles. Many buyers consult the web before any physical lot visit, forcing legacy franchises to invest in CRM, live chat, and embedded-finance widgets that approve credit within minutes. These integrated systems widen the Netherlands' used car market to time-pressed urbanites and semi-urban buyers.
Zero-Emission-Zone 2025 Policy Accelerating ICE Replacement
Since January 2025, municipalities in the Netherlands have been extended the privilege to designate urban areas where only zero-emission vehicles can operate. These zones restrict access to ICE-driven commercial vans and trucks, allowing only electric vehicles (EVs) and hydrogen-powered vehicles for business purposes. Fleets and small businesses retire non-compliant vehicles early to avoid penalties, releasing fresh stock into secondary channels. Amsterdam and several other municipalities mandate that newly registered taxis be zero-emission by 2025, creating predictable disposal waves that benefit 0-2 year inventory.[1]“Uitstootvrije Zone 2025,” Gemeente Amsterdam, amsterdam.nlRegional price gaps emerge as restricted vehicles migrate to provinces without zone coverage, embedding arbitrage opportunities for data-savvy wholesalers.
Restraints Impact Analysis*
| Restraint | (~) % Impact on CAGR Forecast | Geographic Relevance | Impact Timeline |
|---|---|---|---|
| High Interest-Rate Environment Raising Financing Costs | -1.1% | Netherlands, synchronized with ECB monetary policy | Short term (≤ 2 years) |
| Odometer-Tampering Risk in Parallel Imports Eroding Buyer Trust | -0.9% | Netherlands, cross-border transactions with Germany/Belgium | Short term (≤ 2 years) |
| Older Vehicles Lack Advanced ADAS / Connectivity Features | -0.8% | Netherlands, affecting vehicles over 5 years old | Long term (≥ 4 years) |
| Stricter EU End-of-Life-Vehicle Directive Increasing Dealer Compliance Costs | -0.6% | Netherlands, EU-wide regulatory harmonization | Medium term (2-4 years) |
| Source: Mordor Intelligence | |||
Older Vehicles Lack Advanced ADAS and Connectivity Features
Cars over five years old often miss driver-assistance systems and smartphone integration. Dutch drivers do not get ADAS briefings at purchase, while 40% of sellers feel under-informed, and knowledge gaps widen, blunting the demand for older stock.[2]J. Doornbos et al., “Consumer Knowledge Gaps on ADAS Functions,” Accident Analysis & Prevention, sciencedirect.com Insurance discounts and safety incentives increasingly tilt toward tech-rich cars, reducing price elasticity for the 6-8 and 9-12 age brackets. Technology-light vehicles drift to budget niches as automakers standardize over-the-air updates and semi-autonomous functions.
High Interest-Rate Environment Raising Financing Costs
Sub-EUR 15,000 shoppers must now extend loan terms to match pre-rate-hike monthly outlays. Cash deals inch upward, slowing turnover for dealers reliant on captive-finance penetration. Fleet buyers face similar headwinds as corporate borrowing costs climb, triggering longer retention cycles. The Netherlands carries high household debt, so rising mortgage payments squeeze discretionary vehicle budgets first.
*Our forecasts treat driver/restraint impacts as directional, not additive. The impact forecasts reflect baseline growth, mix effects, and variable interactions.
Segment Analysis
By Vehicle Type: Hatchbacks Dominate but SUVs Set the Pace
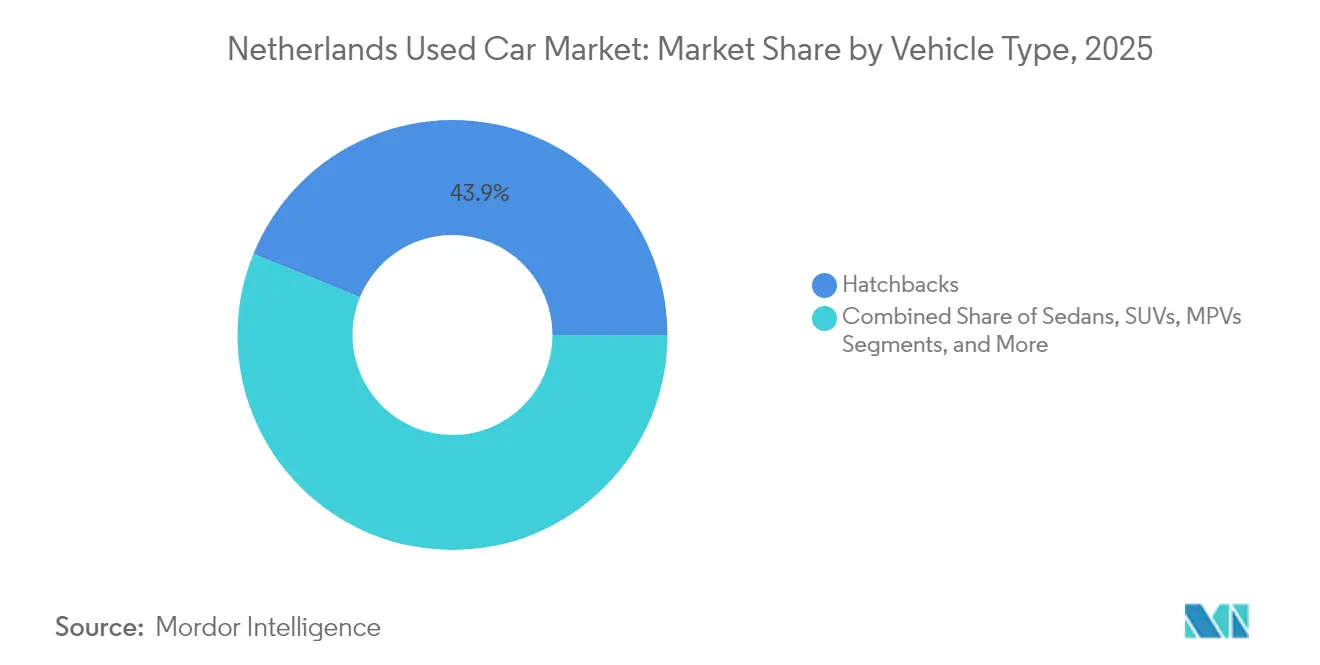
Hatchbacks secured 43.85% of the Netherlands' used car market share in 2025, cementing their role as price-efficient urban transport. Yet, growth tilts toward SUVs, which are projected to register a 8.78% CAGR to 2031. The Netherlands' used car market size for SUVs expands as consumers prioritize elevated seating, perceived safety, and compatibility with electric powertrains. Fleet disposals historically favored compact body styles, but the zero-emission-zone rules make higher-roof BEV crossovers attractive replacements. Residual value resilience further lifts SUV uptake, balancing higher purchase prices with predictable exit prices.
The "others" category, convertibles, coupes, niche sports cars, and crossovers, captures a moderate share in the market, propelled by crossover sub-segments that blur hatchback and SUV cues. MPVs keep a steady share, appealing to larger families seeking cabin versatility. Corporate tax changes encourage businesses to pivot from sedan company cars to compact crossovers that meet new WLTP brackets, thus reshaping future feedstock for retail channels.


By Vendor Type: Organized Dealers Leverage Digital Scale
Organized dealerships controlled 58.74% of the Netherlands' used car market size in 2025 and are slated to grow 6.83% annually to 2031. Digital storefronts, warranty extensions, and integrated financing solidify their edge. The Netherlands used car market size handled by the top 10 groups climbs as they pool refurbishment centers, lowering per-unit reconditioning cost and shortening days-to-sale. Certified pre-owned lines further differentiate stock, granting these sellers a pricing premium while shielding buyers from fraud risk.
Unorganized vendors remain relevant in rural provinces and for older, low-price inventory. Yet regulatory compliance layers such as the tightened End-of-Life Vehicle directive raise overhead, prompting smaller outfits to outsource recycling and documentation. Digital marketplaces give independents national visibility but cannot fully bridge the gap in warranty, logistics, and finance facilitation that large dealer networks deliver.
By Fuel Type: Electrics Accelerate Transformation
Petrol cars retained 52.66% of the Netherlands' used car market share in 2025, but their expansion slowed as environmental policy intensified. Battery electric vehicles enjoy a 10.25% CAGR forecast as corporate leases expire into retail pools. The Netherlands' used car market size for BEVs is expected to strengthen, due to an increase in BEV share in new-vehicle registrations in 2024, half of which were corporate, guaranteeing a sizeable rollout to secondary buyers within typical three-to-four-year cycles. Diesel demand fades under zone restrictions and negative sentiment, while hybrids serve as a transitional bridge for consumers wary of charging limitations.
Range confidence is buttressed by more than 120,000 public charging points nationwide. The high initial cost of battery electric vehicles produces short-term uncertainty, yet leaves the long-run cost equation favorable relative to petrol.
By Vehicle Age: Nearly-New Cars Gain Traction
Vehicles aged 3-5 years own 31.44% of the Netherlands' used car market size in 2025, balancing modern tech with moderate depreciation. The 0-2 year niche, fed by corporate fleet churn, is the fastest climber with a 9.05% CAGR through 2031. Companies dispose of cars sooner to sidestep zero-emission penalties, so nearly-new volumes and trim levels improve. Warranty overlap and lower mileage enhance buyer confidence, cutting time-to-sale across digital channels.
Older slices, 6-8 years and 9-12 years, remain viable for budget seekers but face value drag from missing ADAS. Vehicles over 12 years old contend with insurance surcharges and zone restrictions that limit city access. Financing mirrors the risk curve: lenders offer favorable rates on under-five-year cars, whereas loans for older inventory demand higher down-payments and shorter maturities, constraining affordability.
By Price Segment: Middle Market Anchors Volume
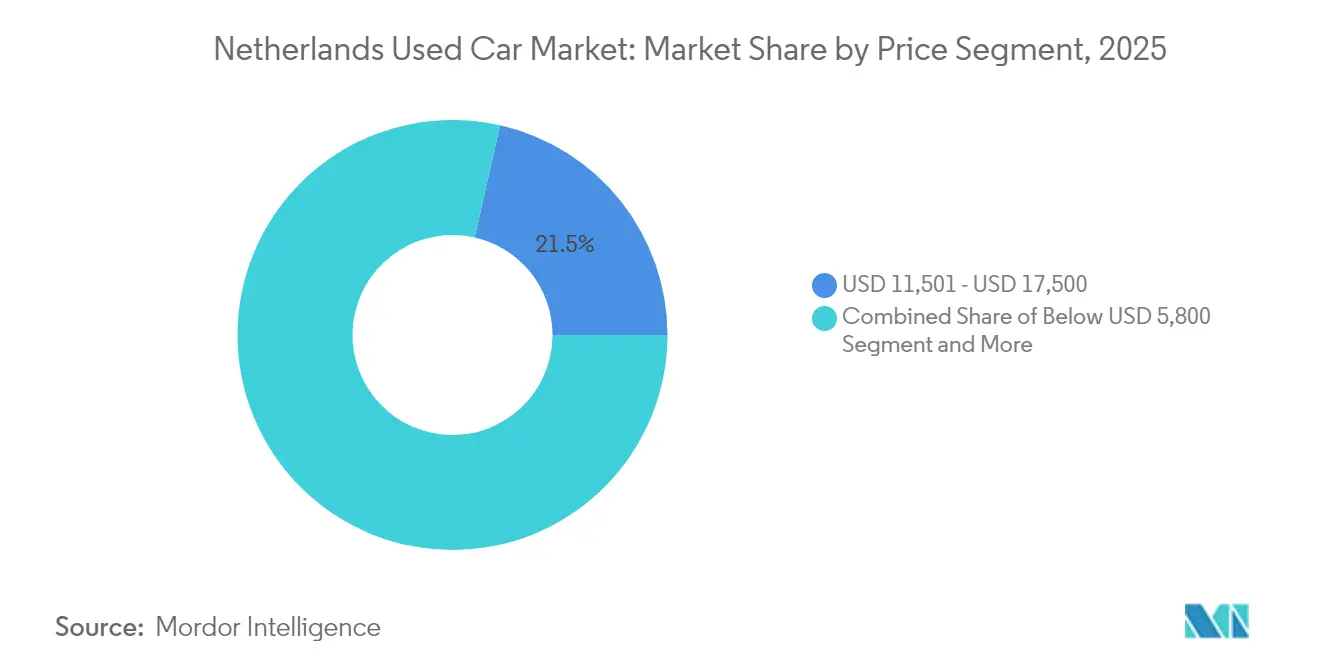
The USD 11,501-17,500 accounted for 21.45% of the Netherlands' used car market share in 2025 as households seek a balance of features and manageable debt loads. In contrast, the Netherlands' used car market share above USD 35,000 shows the sharpest value growth, riding an 7.74% CAGR propelled by wealth concentration and accelerated luxury depreciation. Sub-USD 5,800 lots cater to cash-constrained buyers and last-mile service providers.
Mid-tier brackets (USD 17,501-23,100 and USD 23,101-35,000) will have more transactions as purchasers stretch budgets for infotainment upgrades or electrified powertrains. Interest-rate sensitivity is acute in these zones because term extensions directly affect affordability metrics.
By Sales Channel: Digital Platforms Reshape Access
Online outlets captured 43.02% of the Netherlands' used car market share in 2025, and their prevalence in the Netherlands' used car market will climb as omni-journeys normalize. Pure-play e-retailers record a 9.36% CAGR by combining nationwide inventory, algorithmic pricing, and logistics networks that offer doorstep delivery within 48 hours. Offline OEM franchise dealers retain a sizeable footprint through showroom test drives and same-day service packages, but increasingly plug into centralized digital marketplaces for lead generation.
Multi-brand independents leverage localized trust and after-sales proximity, yet now mirror the digital toolsets of broader rivals. Physical auctions lose share to online auction rooms where wholesalers bid in real time. Augmented-reality walk-arounds and 360-degree imaging temper buyer hesitation around remote purchases.
Geography Analysis
The Randstad arc—Amsterdam, Rotterdam, The Hague, and Utrecht—concentrated the Netherlands' used car market value in 2024, owing to its dense population, higher disposable income, and above-national digital adoption rates. Zero-emission zones in these cities intensify the turnover of older ICE cars, pushing compliant supply into secondary towns. Their buyers prize utility over prestige, so hatchbacks and light vans dominate inventory mixes.
Southern regions Noord-Brabant and Limburg benefit from proximity to Belgian and German borders. Although odometer fraud is common among incoming German imports, cross-border arbitrage thrives, prompting countermeasures such as mandatory mileage verification at transfer. Charging density remains a differentiator. Urban areas host most of the nation's charging public points, whereas rural drivers cite range anxiety as a barrier to BEV acquisition. Embedded-finance penetration also skews urban, where fintech lenders approve credit on mobile, while rural residents rely on traditional bank networks. Dutch tax policy, digital literacy, and reliable logistics make the country a net exporter of lightly used BEVs, especially toward Germany, where incentives remain stronger. Consequently, domestic sellers monitor foreign exchange and policy shifts to time cross-border listings for maximum margin.
Mordor Intelligence delivers a comprehensive view of the used car market across all major regions such as Africa, alongside country-level analysis for Finland, Norway, Nigeria, Ethiopia, Hong Kong, New Zealand, Myanmar, and Switzerland, each offering a view of the local market realities.
Regulatory Landscape
The Netherlands used-car market is tightly governed by the Netherlands Vehicle Authority (RDW). RDW oversees vehicle registration, identity verification, and formal transfer of ownership, including requirements for importing vehicles from EU/EFTA countries and associated documentation such as BPM tax declarations for imports. Roadworthiness is anchored by the mandatory periodic technical inspection (APK), which shapes dealer reconditioning standards and the resale ability of older inventory.
Policy measures are also reshaping replacement and compliance behavior. Since January 2025, municipalities have been enabled to designate zero-emission zones, which accelerates turnover of non-compliant ICE light commercial vehicles and shifts the mix of vehicles entering secondary channels. At EU level, tightening end-of-life vehicle and emissions-related compliance increases documentation and recycling obligations for market participants, while the Dutch policy agenda continues to discuss reforms to automotive taxation and affordability measures (including workstreams referenced under Actieagenda Auto and parliamentary correspondence during 2026).
Value Chain Analysis
Supply in the Netherlands used-car market is fed by corporate lease and fleet defleets, trade-ins at OEM-franchised and multi-brand dealers, and cross-border inflows (notably from nearby EU markets) that require RDW import and registration steps. Vehicles then flow into wholesale remarketing, including auction channels and B2B trades, or into retail through organized dealerships, independent dealers, and consumer-to-consumer sales supported by digital classifieds and lead aggregators.
Downstream value creation centers on inspection, refurbishment, and compliance documentation, including APK readiness, mileage and identity checks, and import-related tax and registration paperwork. Data and merchandising layers sit on top of this chain: platforms such as viaBOVAG.nl and major portals improve discoverability and price transparency, while industry data partners such as RDC support market statistics and pricing intelligence. BOVAG-reported market structure highlights the scale of the professional channel, with 2025 used-car sales of about 2.12 million units and dealerships accounting for roughly two-thirds of volume, reinforcing the role of organized players that can industrialize reconditioning, warranties, and financing attachments.
Competitive Landscape
Dealer concentration tightens each year. The 100 largest groups sell nearly all new cars and redirect their procurement muscle into used operations. They acquire smaller independents to pool inventory, negotiate financing kickbacks, and invest in AI-driven repricing engines. The Netherlands' used car market consequently sees unit margins stabilize, even as price transparency increases through comparison portals.
Pure-play digital retailers raise capital to establish inspection hubs that reassure consumers through certified condition reports and return windows. Some expand into strategic partnerships with charging station operators to bundle energy subscriptions with electric-vehicle purchases. Traditional franchises respond by embedding same-day delivery and live video walk-throughs, blurring the line between online and offline propositions.
White-space entrants specialize in niche services: battery-health certification, ADAS retrofitting, and high-end vehicle authentication. EU scrutiny over anti-recycling collusion, underscored by the EUR 458 million (USD 540 million) fine in April 2025, nudges OEMs to outsource end-of-life compliance to transparent recyclers. Dealers that align early with certified dismantlers gain reputational leverage and smoother inventory rotation.
Netherlands Used Car Industry Leaders
Marktplaats
AutoScout24
AutoTrack
ViaBOVAG
Gaspedaal
- *Disclaimer: Major Players sorted in no particular order

Market Opportunities and Future Outlook
A key opportunity sits at the intersection of policy-driven fleet churn and rising consumer openness to electrified used vehicles. Zero-emission zones introduced from January 2025 in multiple municipalities are pushing businesses to replace older ICE assets earlier, and the resulting disposal waves deepen supply of young used vehicles, particularly in the 0-2 and 3-5 year brackets where buyers value warranty overlap and modern safety and infotainment features. Industry signals also point to ongoing public discussion of measures to stimulate the secondary market for fully electric cars, which supports broader normalization of used-BEV ownership at mass-market price points.
Another opportunity is trust infrastructure for cross-border and digital transactions. Odometer-tampering risk in parallel imports keeps demand concentrated around channels that can substantiate provenance, creating room for standardized mileage verification, battery-health reporting for used BEVs, and clearer refurbishment and maintenance promises. BOVAG activity around additional occasion labels (including import-focused checks and maintenance coverage) and continued scale in online discovery through platforms such as viaBOVAG.nl support new service layers that monetize transparency, faster financing decisions, and logistics-enabled remote delivery without changing the report scope or segmentation.
Recent Industry Developments
- July 2026: AutoZoWeg platform reached a milestone of over 1,000 completed vehicle sales within its verified dealer network. The milestone strengthens the network effects for online used car transactions and signals growing trust in digital storefronts. Market efficiency increases as more volume moves through certified dealer channels, reducing friction in the NL used-car market.
- April 2026: Eccasion raised 3.2 million euros in funding to scale its online-only dealership for ex-lease electric vehicles. The financing accelerates supply of ex-lease EVs and strengthens the digital-first used-EV ecosystem.
- March 2026: BearingPoint and autobiz announced a partnership to integrate autobiz residual value data into BearingPoint's asset-based funding platform for European financial institutions. The use of residual value data in used-car financing in NL context improves financing options and risk assessment for used-car purchases, supporting market liquidity.


Research Methodology Framework and Report Scope
Market Definition and Coverage
For this methodology, the Netherlands used car market is the total value generated from transactions of passenger vehicles that are sold as pre-owned within the country, across dealer and consumer channels, during the study period.
Scope exclusions: New car retail sales, standalone maintenance and repair services, insurance, road tax, and fuel retail are excluded from the market value.
Segmentation Overview
- By Vehicle Type
- Hatchbacks
- Sedans
- Sports Utility Vehicles (SUVs)
- Multi-Purpose Vehicles (MPVs)
- Others (Convertibles, Coupes, Crossovers, Sports Cars)
- By Vendor Type
- Organised
- Unorganised
- By Fuel Type
- Petrol
- Diesel
- Hybrid (HEV & PHEV)
- Battery-Electric (BEV)
- LPG / CNG / Others
- By Vehicle Age
- 0 - 2 Years
- 3 - 5 Years
- 6 - 8 Years
- 9 - 12 Years
- Above 12 Years
- By Price Segment (USD)
- Below 5,800
- 5,800 - 11,500
- 11,501 - 17,500
- 17,501 - 23,100
- 23,101 - 35,000
- Above 35,000
- By Sales Channel
- Online Digital Classified Portals
- Pure-Play E-Retailers
- OEM-Certified Online Stores
- Offline OEM-Franchised Dealers
- Multi-brand Independent Dealers
- Physical Auction Houses
Data Sources, Market Sizing, and Validation
Desk Research
Desk research was used to set the market boundaries and build the first set of volume and pricing assumptions for used passenger vehicles in the Netherlands. We mainly referenced public datasets that show how many cars change ownership and what the vehicle fleet looks like, and then mapped those signals into a revenue pool.
Typical sources included national transport and registration statistics, such as RDW publications, Statistics Netherlands (CBS) releases, and mobility and emissions updates from relevant Dutch ministries. We also reviewed association and market-monitor publications such as BOVAG and VWE, along with selected customs and trade indicators where re-exports can influence domestic supply. Company annual reports, investor presentations, and trusted news coverage were used to sense-check dealership activity, inventory trends, and financing conditions, while paid subscriptions for company financials, news and financials, and vehicle park and sales were used to validate directional movement and timing. The sources mentioned here are illustrative and not exhaustive, since many other references were also used for collection, cross-checking, and clarification.
Primary Interviews and Surveys
Primary work focused on aligning secondary signals with what is happening in day to day used car transactions, especially on price movement and channel mix. Interviews and surveys typically covered dealer groups, independent retailers, online intermediaries, fleet remarketing participants, and finance or warranty related experts, so gaps around volumes, margins, and consumer preferences could be closed with real market context. Since this is a single-country market, respondents were selected to reflect different operating footprints inside the Netherlands, including urban and non-urban demand patterns.
Distribution of primary research fieldwork respondents
| Company type | Respondent position |
|---|---|
| Top tier: 33% | CXOs: 13% |
| Mid tier: 45% | Functional/Unit leaders: 37% |
| Smaller Players: 22% | Managers: 50% |
Market-Sizing & Forecasting
The market was sized using a top-down build that starts from Netherlands passenger vehicle ownership and transfer activity, and then reconstructs annual used-car transaction value using average selling price bands by age and fuel type. To keep the total realistic, we then checked the result with selective bottom-up approximations such as sampled dealer throughput, observed online listing price ranges, and channel checks on how many cars are sold through organized retailers versus informal routes, and then adjusted assumptions where gaps were persistent.
Key inputs in the model included used-car ownership transfer volumes, the circulating passenger car parc by fuel type, the mix shift toward SUVs and newer used inventory, and the typical age profile of cars being sold. Pricing was informed by trends in average transaction values and by how quickly prices normalize when new-car supply, interest rates, and consumer affordability change. For forecasting, scenario analysis was used to translate these drivers into forward demand and pricing paths, and then validated with expert views on how regulation and zero-emission zone timelines may influence replacement decisions. Where direct data was thin, we used clearly stated proxies, such as mapping age bands to price decay curves, and then stress-tested them against observed year to year market movement.
Data Validation & Update Cycle
Validation was done by comparing the modeled revenue totals against independent signals that should move in the same direction, such as ownership transfer trends, fleet age movement, and documented shifts in vehicle fuel mix. Large variances were investigated, and assumptions were revisited when pricing or volume changes looked inconsistent with known market events and interview feedback.
Before sign-off, the model and written conclusions pass through multi-step internal reviews, and follow-up outreach is triggered when a key input changes or a conflict appears between sources. Reports are refreshed annually, and interim updates are made when material events occur, such as sharp pricing swings or policy changes that impact used-car availability. Right before delivery, a final analyst pass is completed so clients receive the latest updated view.
Mordor Intelligence's Netherlands Used Car Market Size Compared With Other Published Estimates
Different publishers can arrive at different market sizes for the Netherlands used car space because they do not always count the same transactions, or they apply different pricing and timing assumptions. The biggest differences usually come from whether the estimate is based on ownership transfers versus broader automotive resale activity, how online listings are treated versus completed sales, and whether values are converted and inflated using consistent reference years.
Key gap drivers also include how each study handles imports and re-exports, which can inflate apparent market activity if not filtered to domestic end-use, and how quickly average selling prices are refreshed when financing rates and supply normalize. By tracking ownership transfer volumes and observed price bands (and refreshing them during model reviews), Mordor Intelligence keeps the estimate tied to completed Netherlands transactions rather than advertised listings or bundled mobility spend.
Benchmark comparison
| Source | Market Size | Gaps in Research Methodology |
|---|---|---|
| Mordor Intelligence | USD 41.46 B (2026) | |
| Trade Publisher A | USD 37.74 B (2024) | Uses an earlier base year with limited clarity on whether values reflect final transaction prices or blended asking prices, and it may not fully separate domestic sales from cross-border flows. |
| Research Outlet B | USD 51.71 B (2033) | Longer forecast horizon and different CAGR and price progression assumptions can compound the end value, especially if higher used EV and SUV pricing is assumed without matching volume checks. |
The table shows that the spread is mostly explained by base year selection, what is counted as a completed sale, and how pricing is carried forward during the forecast window. When scope and pricing logic are stated in a repeatable way, the final market number is easier to trace back to real volumes and realistic transaction values, which helps decision-makers compare scenarios on a like for like basis.


Key Questions Answered in the Report
What is the current value of the Netherlands used car market?
The market is worth USD 41.46 billion in 2026 and is projected to climb to USD 51.45 billion by 2031.
Which vehicle type is growing the fastest in Dutch used-car sales?
SUVs lead growth with a 8.78% CAGR forecast to 2031, driven by lifestyle shifts and electric-ready chassis designs.
Why are battery electric vehicles gaining ground in the secondary market?
Corporate fleets register nearly half of new BEVs, and these low-mileage cars enter the market after lease expiry, while robust public charging network boost buyer confidence.
What impact will zero-emission zones have on used-car prices?
Zones make older Euro 4 and Euro 5 ICE models less desirable in affected cities, encouraging accelerated disposal and producing regional price differentials favoring compliant vehicles.
How does the high interest-rate environment affect buyers?
Higher ECB rates raise monthly loan costs, prompting longer terms for mid-priced cars and greater reliance on cash deals in budget segments, which can slow overall transaction velocity.
Page last updated on:


 Your data is secure and never sold or shared.


