
Market Overview
| Study Period | 2020 - 2031 |
|---|---|
| Forecast Data Period | 2026 - 2031 |
| Base Year Market Size (2025) | USD 10.66 Billion |
| Market Size (2026) | USD 11.45 Billion |
| Market Size (2031) | USD 16.36 Billion |
| Growth Rate (2026 - 2031) | 7.39 % |
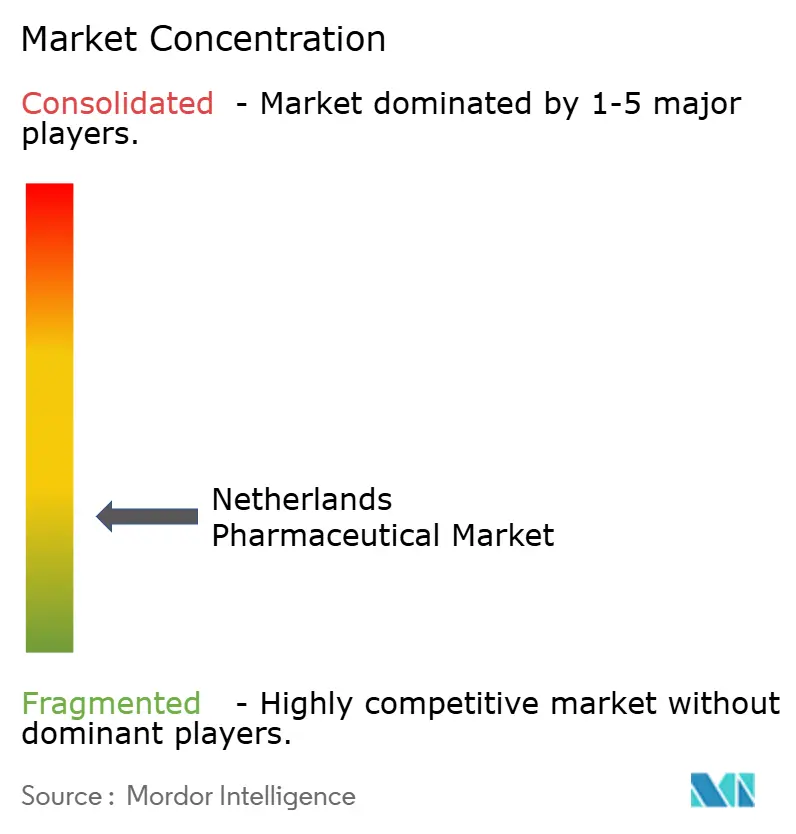
| Market Concentration | Low |
Major Players *Disclaimer: Major Players sorted in no particular order Image © Mordor Intelligence. Reuse requires attribution under CC BY 4.0. | |
Netherlands Pharmaceutical Market Analysis by Mordor Intelligence
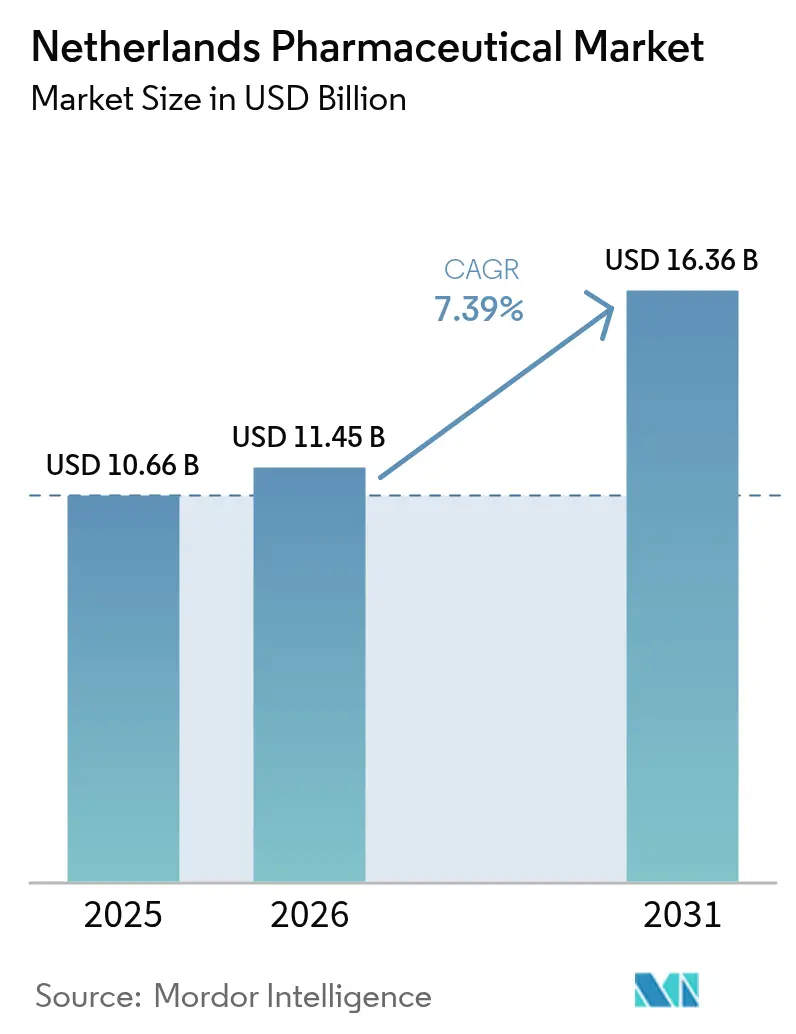
The Netherlands pharmaceutical market size in 2026 is estimated at USD 11.45 billion, growing from 2025 value of USD 10.66 billion with 2031 projections showing USD 16.36 billion, growing at 7.39% CAGR over 2026-2031. Strong public investment, rapid uptake of advanced therapies, and a coordinated life-sciences ecosystem position the Netherlands pharmaceutical market as a pivotal European growth engine. Momentum stems from rising chronic-disease prevalence, sustained investment in biotech clusters, and the European Medicines Agency’s 2019 relocation to Amsterdam. An innovation-friendly policy mix that includes a €1.3 billion National Growth Fund commitment, coupled with Europe’s lowest antimicrobial-resistance rates, underpins investor confidence. Yet persistent drug-shortage incidents, aggressive insurer preference policies, and escalating R&D costs temper the otherwise favorable outlook.
Key Report Takeaways
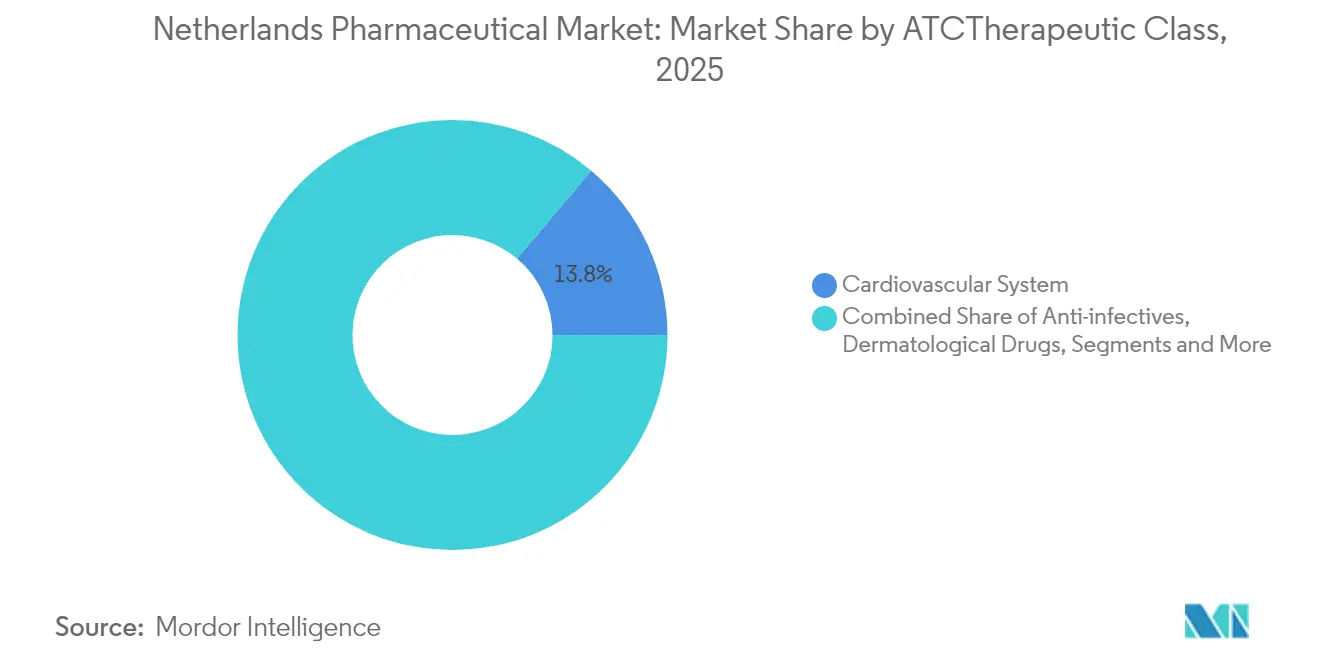
- By ATC/Therapeutic class, cardiovascular system drugs held 13.84% of the Netherlands pharmaceutical market share in 2025, while antineoplastic and immunomodulating agents are projected to expand at an 8.12% CAGR through 2031.
- By molecule type, branded medicines commanded 55.02% share of the Netherlands pharmaceutical market size in 2025; biosimilars record the fastest growth at an 8.63% CAGR over 2026-2031.
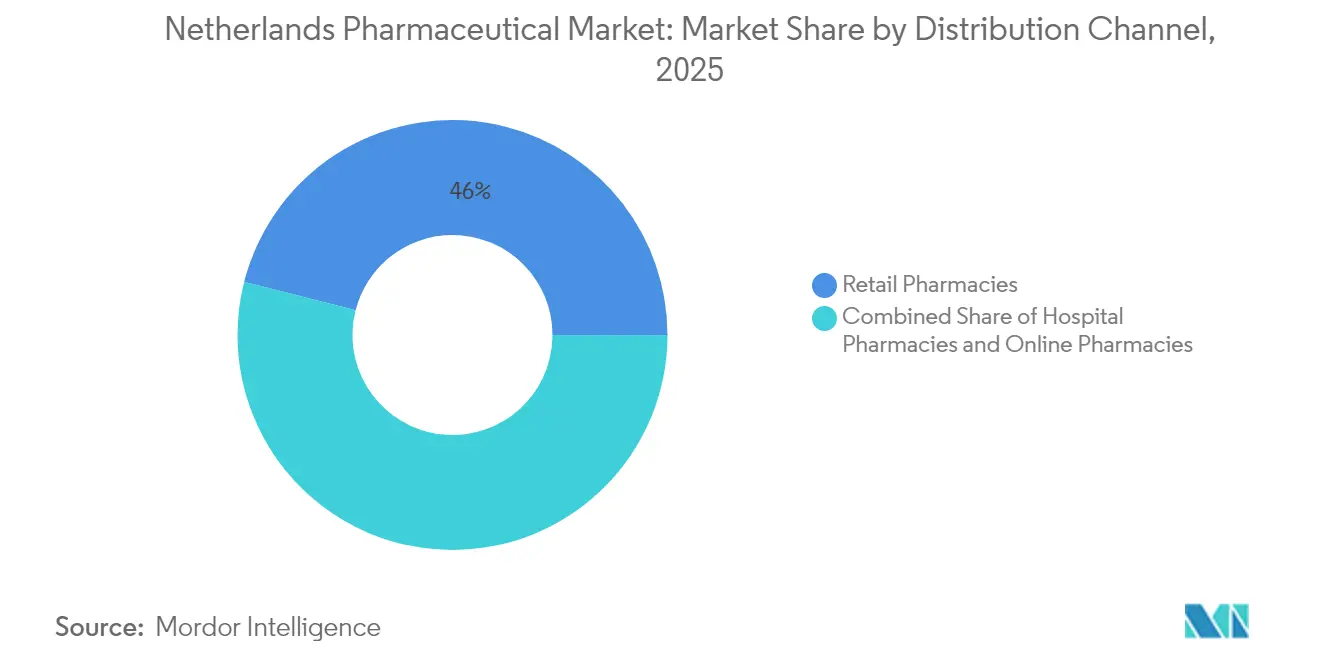
- By distribution channel, retail pharmacies accounted for 46.02% revenue in the Netherlands pharmaceutical market size in 2025, whereas online pharmacies lead growth at an 8.48% CAGR to 2031.
- By mode of dispensing, prescription products represented 87.33% of the Netherlands pharmaceutical market share in 2025, while OTC medicines are advancing at a 8.87% CAGR through 2031.
Note: Market size and forecast figures in this report are generated using Mordor Intelligence’s proprietary estimation framework, updated with the latest available data and insights as of 2026.
Market Trends and Insights
Drivers Impact Analysis of Netherlands Pharmaceutical Market*
| Driver | (~ ) % Impact on CAGR Forecast | Geographic Relevance | Impact Timeline |
|---|---|---|---|
| Innovation-friendly government & research institutes | +1.2% | National, Leiden–Amsterdam corridor | Long term (≥ 4 years) |
| Rising prevalence of chronic diseases | +1.8% | National | Medium term (2-4 years) |
| Robust biotechnology clusters | +1.0% | Regional spillover | Long term (≥ 4 years) |
| Universal reimbursement system | +0.9% | National | Short term (≤ 2 years) |
| Expansion of hospital advanced-therapy centers | +0.7% | Academic medical centers | Medium term (2-4 years) |
| Early-access & compassionate-use programs | +0.4% | National, EU-aligned | Short term (≤ 2 years) |
| Source: Mordor Intelligence | |||
Innovation-Friendly Government & World-Class Research Institutes
The National Technology Strategy channels €5.7 billion in annual funding toward ten key enabling technologies, with molecules and cells enjoying top priority. This long-range commitment stimulates commercialization pathways for personalized medicines and advanced biologics. The €1.3 billion National Growth Fund allocation boosts domestic manufacturing capacity and reduces reliance on external supply chains. Academic centers such as Leiden University Medical Center translate bench innovation into GMP-compliant pluripotent stem-cell lines ready for clinical application, while multinational firms like Bristol Myers Squibb locate Europe’s first CAR-T production plant in Leiden. Collectively, these initiatives elevate the Netherlands pharmaceutical market as a magnet for late-stage clinical trials, high-value biologics, and tech-enabled discovery [1].
Rising Prevalence of Chronic Diseases
Chronic conditions affect 10.4 million residents, creating durable demand across multiple therapeutic classes. Dementia and osteoarthritis cases are projected to double by 2050, intensifying the need for neurology and musculoskeletal interventions. Cardiovascular disease remains the leading mortality driver, though shorter hospital stays signal therapeutic progress. Obesity trends add urgency to metabolic treatments, including GLP-1 receptor agonists, despite reimbursement gaps that widen health-equity concerns. This large patient pool ensures that the Netherlands pharmaceutical market retains stable volume drivers even as high-margin specialty categories accelerate.
Robust Biotechnology Clusters in Leiden & Amsterdam
Leiden Bio Science Park hosts more than 200 companies and 18,000 life-sciences employees, generating substantial licensing revenue and attracting contract-development projects. Amsterdam’s life-sciences hub complements discovery activity with translational research strengths, aided by the European Medicines Agency’s proximity. Facilities such as Lonza’s Gene-edited Cell Therapy plant in Geleen and QurAlis’s European headquarters reflect growing foreign direct investment. The tight geographic footprint fosters rapid knowledge transfer, making the Netherlands pharmaceutical market a prototype for cluster-based innovation[2].
Strong Universal Reimbursement System Accelerating Patient Access
Dutch universal coverage ensures rapid uptake of cost-effective breakthroughs while using drug-sluice mechanisms to phase in high-cost treatments. Recent inclusion of dostarlimab for uterine cancer following Health Technology Assessment highlights balanced access. Budget optimization trims total pharmaceutical outlays to €4.5 billion in 2025, yet early-access and compassionate-use channels keep innovative medicines within reach. Insurer preference policies drive generic substitution, lowering costs but intensifying margin pressures for originators.
Expansion of Hospital Advanced-Therapy Centers (Cell & Gene)
Academic centers in Utrecht, Leiden, and Groningen expand GMP suites to manage autologous and allogeneic cell-therapy production. New CAR-T infusion sites reduce patient travel time and shorten treatment queues. Early real-world evidence supports outcome-based contracting, which aligns payer risk with therapeutic performance. Growing installed capacity helps the Netherlands pharmaceutical market absorb rising demand for personalized oncology solutions.
Early Access & Compassionate-Use Programs Post-COVID
COVID-19 accelerated regulatory agility, allowing clinicians to use investigational drugs under strict monitoring. These frameworks persist, shortening the time between EMA approval and Dutch market entry from nearly one year to under six months for priority medicines. Pharmaceutical firms leverage early-access data to build real-world evidence packages that support broader reimbursement engagements.
Restraints Impact Analysis of Netherlands Pharmaceutical Market*
| Restraint | (~ ) % Impact on CAGR Forecast | Geographic Relevance | Impact Timeline |
|---|---|---|---|
| High R&D failure rates & escalating costs | -0.8% | Global, Dutch spillover | Long term (≥ 4 years) |
| Stringent insurer preference policy | -1.1% | National | Medium term (2-4 years) |
| Litigation-led push for drug-price transparency | -0.6% | National, EU-aligned | Medium term (2-4 years) |
| Supply-chain pressure from FMD compliance | -0.9% | EU-wide | Short term (≤ 2 years) |
| Source: Mordor Intelligence | |||
High R&D Failure Rates and Escalating Development Costs
Average out-of-pocket R&D outlays surpass USD 1 billion per novel entity, and only 1 in 10 candidates entering Phase I achieves market authorization. The Netherlands’ 2.3% R&D-to-GDP ratio trails the EU’s 3% target, widening the funding gap for capital-intensive drug programs. Midsize firms face cash-burn constraints, exemplified by consolidation such as Medios’s purchase of Ceban Pharmaceuticals. Artificial-intelligence platforms promise savings but require large, curated data sets and regulator guidance to scale, limiting near-term relief [3].
Stringent Insurer “Preference Policy” Driving Price Erosion
Mandatory tendering and one-winner formularies suppress prices up to 60% below EU averages. Pharmaceutical firms often reduce Dutch supply volumes to avoid parallel trade arbitrage, contributing to 2,292 reported shortages in 2023. While biosimilar uptake soars, innovators wrestle with diminished returns, raising concerns over launch sequencing and willingness to supply niche drugs.
*Our forecasts treat driver/restraint impacts as directional, not additive. The impact forecasts reflect baseline growth, mix effects, and variable interactions.
Netherlands Pharmaceutical Market Segment Analysis
By ATC/Therapeutic Class:
Cardiovascular Leadership Drives VolumeCardiovascular system drugs accounted for 13.84% of 2025 revenue, maintaining the largest slice of the Netherlands pharmaceutical market. Uptake of PCSK9 inhibitors and next-generation anticoagulants offsets price decline in statins. The antineoplastic and immunomodulating agents segment is forecast to grow at an 8.12% CAGR, propelled by PD-1/L1 immunotherapies and targeted small-molecule launches. Alimentary-tract medicines gain from double-digit diabetes incidence, while blood-forming organ therapies expand via novel oral anticoagulants. Dermatology and genitourinary categories post stable mid-single-digit gains underpinned by lifestyle-driven demand. Antibiotics remain below EU volume averages, reflecting stringent stewardship, yet steady sales of reserve antibiotics address resistant pathogens. Musculoskeletal and nervous-system classes benefit from an aging society, whereas systemic hormonal products leverage improved diagnostic pathways.
Emerging GLP-1 analogs and gene-silencing therapies blur traditional class boundaries, presenting cross-segment growth pockets. Hospital formularies negotiate indication-specific pricing, linking reimbursement to real-world outcomes. Academic centers conduct combination-therapy trials that elevate oncology’s share of the Netherlands pharmaceutical market size and set a precedent for future value-based frameworks. Specialty-pharmacy services align with intricate dosing regimens, enhancing adherence and generating data for pharmacoeconomic modeling.

By Molecule Type:
Branded Dominance Faces Biosimilar DisruptionBranded products held 55.02% of total sales in 2025, underscoring sustained value capture from innovative launches. However, the patent cliff for monoclonal antibodies, including ustekinumab, unlocks space for biosimilar entrants. The Netherlands pharmaceutical market size for biosimilars is predicted to climb 8.63% annually through 2031 as tender-friendly policies accelerate switching. Generics preserve meaningful volume share through automatic substitution at retail pharmacies, supported by insurer mandates. Originators respond with lifecycle extensions such as subcutaneous formulations, digital companion apps, and real-world evidence studies demonstrating superior persistence.
Manufacturers partner with local contract-development organizations to streamline dossier preparation in anticipation of centralized EMA filings, shortening time-to-tender. Patient-support programs focusing on home infusion and remote monitoring add differentiation beyond molecular equivalence. Despite margin compression, predictable biosimilar uptake stabilizes payer budgets, fostering headroom for premium advanced-therapy medicinal products, thereby reinforcing the dual-speed nature of the Netherlands pharmaceutical market.
By Distribution Channel:
Retail Strength Meets Digital InnovationRetail pharmacies captured 46.02% revenue in 2025, cementing their role as primary medication-dispensing hubs and frontline health advisors. The PHOENIX group’s 340-store BENU network illustrates ongoing chain consolidation that affords negotiating power with suppliers. Online pharmacies grow at an 8.48% CAGR, capitalizing on pandemic-induced e-commerce familiarity, same-day delivery offerings, and e-prescription integration. Hospital pharmacies manage high-complexity biologics and advanced-therapy medicinal products that require on-site compounding and close clinical supervision.
Hybrid “click-and-collect” models bridge digital and physical spheres, enabling patients to order online and pick up in store, reinforcing relationship continuity. EU Falsified Medicines Directive scanners at points of dispense enhance trust, while blockchain pilots explore end-to-end provenance tracking. Channel strategies increasingly incorporate telepharmacy counseling and remote adherence monitoring, broadening the Netherlands pharmaceutical market’s service layer and deepening data insights for population-health management.
By Mode of Dispensing:
Prescription Dominance Reflects Regulatory RigorPrescription medicines represented 87.33% of 2025 turnover, reflecting a system that favors physician oversight and evidence-based selection. Controlled OTC expansion at a 8.87% CAGR arises from prescription-to-OTC switches in allergy, gastrointestinal, and dermatology categories. Self-care momentum aligns with digital symptom-triaging tools, yet pharmacists’ independent-prescribing scope remains limited to collaborative protocols, ensuring clinical governance.
E-prescription penetration approaches full national coverage, facilitating refill automation and dosage-reminder services. Micro-fulfillment centers linked to community pharmacies enable 24-hour locker pickup, serving shift workers and rural customers. Future regulatory proposals consider pharmacist vaccination authority and chronic-therapy initiation under strict algorithms, potentially nudging the Netherlands pharmaceutical industry toward broader pharmacist clinical roles without compromising patient safety.
Geography Analysis
The Netherlands pharmaceutical market benefits from compact geography that concentrates R&D, regulatory, and manufacturing assets within the Randstad corridor. Leiden’s biotechnology focus, Amsterdam’s clinical-research and regulatory depth, and Utrecht’s veterinary-health specialization create complementary capabilities. EMA’s presence elevates Amsterdam’s visibility, drawing multinational regulatory-affairs units and accelerating centralized-procedure familiarity. Post-Brexit adjustments channel company relocations to Dutch sites to safeguard EU market access.
Export competitiveness remains robust; port infrastructure in Rotterdam and air-cargo facilities at Schiphol facilitate cold-chain throughput for biologics and cell therapies destined across Europe and North America. Government cluster policies provide tax incentives and streamlined permitting, catalyzing additional investment in greenfield GMP manufacturing. Regional development funds prioritize cell-and-gene manufacturing capacity in peripheral provinces, distributing economic benefits beyond the Randstad.
Cross-border collaboration with Belgium and Germany nurtures a tri-national life-sciences belt that pools clinical-trial participants and harmonizes ethics approvals. Digital-health startups orbit around academic medical centers, leveraging open-data initiatives and interoperability standards to pilot AI-driven diagnostic tools, further enriching the Netherlands pharmaceutical market ecosystem.
Regulatory Landscape
The Netherlands regulates medicines primarily through the Medicines Act (Geneesmiddelenwet). The Medicines Evaluation Board (CBG-MEB) assesses and monitors the quality, safety, and efficacy of medicinal products under the Ministry of Health, Welfare and Sport (VWS). Manufacturing, import, and wholesale activities require permits issued via Farmatec, while compliance oversight spans Good Manufacturing Practice (GMP) and Good Distribution Practice (GDP) expectations, alongside EU-wide requirements such as the Falsified Medicines Directive at points of dispense.
Affordability and market access are shaped by the Medicine Prices Act (Wet geneesmiddelenprijzen), which sets maximum prices using external reference countries (Belgium, France, Germany, and the United Kingdom). Reimbursement mechanisms and payer measures influence tendering and substitution. The regulator has also updated operational guidance for specific supply routes, including the CBG-MEB publishing an updated policy document in April 2026 (MEB 14) on parallel import marketing authorization and maintenance, indicating continued tightening of documentation and lifecycle obligations for parallel-traded products.
Value Chain Analysis
The Netherlands pharmaceutical value chain spans globally sourced raw materials and intermediates, domestic and EU-based manufacturing, secondary packaging/serialization, and a distribution layer dominated by permitted wholesalers and pharmacy channels. Manufacturing and wholesale operations operate within a permitting and inspection framework (Farmatec permits and IGJ supervision), with GDP and GMP compliance embedded across handoffs. Policy instruments such as the 2024 stockholding rule for prescription medicines, requiring marketing authorization holders to hold six weeks of stock and wholesalers two weeks, formalize buffer inventory as a resilience lever.
Cluster and logistics advantages concentrate activity around the Leiden-Amsterdam corridor and connect to European gateways through Rotterdam and nearby cross-border routes. Recent capability upgrades show where value is being added, including contract packaging and cold-chain handling for injectables and biologics, as well as scale manufacturing investments linked to major projects in the Leiden Bio Science Park area. The chain remains sensitive to shortages and small-batch complexity, which makes serialization-ready packaging capacity, validated temperature-controlled warehousing, and compliant parallel import processes important differentiators for suppliers serving hospital and retail demand.
Competitive Landscape
The market exhibits moderate concentration, with the top five players controlling roughly 45% of branded-drug sales. Multinationals dominate high-value oncology and immunology niches, while domestic and regional biotechs carve focused pipelines in metabolic and infectious-disease areas. Bristol Myers Squibb’s CAR-T plant and Pfizer’s RNA-manufacturing collaboration underscore inward investment trends. Innovative SMEs like Leyden Labs and NewAmsterdam Pharma raise sizable late-stage financing rounds, challenging incumbents in pandemic preparedness and cardiovascular lipoprotein modulation.
Strategic alliances proliferate as large firms license local discovery assets to expand modality coverage. Digital-therapeutic add-ons accompany specialty launches, enhancing adherence and feeding real-world data into post-marketing effectiveness dossiers. EMA’s 2024 AI reflection paper offers a clear governance framework, prompting accelerated deployment of machine-learning drug-design platforms.
Generic and biosimilar competitors, led by Teva, Sandoz, and Viatris, successfully leverage insurer tenders, capturing share in off-patent monoclonal antibodies and inhalation therapies. Margin compression spurs cost-optimization initiatives such as multi-country packaging and shared serialization hubs. Specialty wholesalers deepen value by bundling pharmacovigilance services and at-home infusion support, extending influence along the supply chain.
Netherlands Pharmaceutical Industry Leaders
-
Abbott Laboratories
-
AbbVie Inc.
-
AstraZeneca Plc
-
Novartis AG
-
F. Hoffmann-La Roche AG
- *Disclaimer: Major Players sorted in no particular order
Netherlands Pharmaceutical Market Companies Covered in this Report
- Abbott Laboratories
- Abbvie
- Amgen
- Astellas Pharma
- AstraZeneca
- Bayer
- Boehringer Ingelheim
- Eli Lilly and Company
- Roche
- GlaxoSmithKline (GSK) plc
- Johnson & Johnson
- Merck
- Novartis
- Novo Nordisk
- Pfizer
- Sanofi
- Takeda Pharmaceuticals
- Teva Pharmaceutical Industries
- Viatris
- Zentiva Group
Market Opportunities and Future Outlook
Manufacturing and packaging capacity build-outs create tangible whitespace in high-value modalities and supply-chain services, particularly for oral solid dose, biologics, and injectables handling. Evidence of capital moving into the Netherlands includes Eli Lilly's plans for a USD 3 billion oral medicines manufacturing facility in Katwijk (Leiden Bio Science Park), supported by a July 2026 provincial commitment of EUR 31 million for related infrastructure. Additional investments aim to expand specialized packaging and assembly capabilities, including Sharp Services expansion work at its Heerenveen site. These moves point to demand for local GMP manufacturing labor, qualified-person services, validation, and temperature-controlled logistics tied to advanced therapies and specialty medicines.
Policy and regulatory change also shapes opportunities, as companies adapt pricing, reimbursement, and evidence-generation approaches to Dutch cost-containment tools and evolving EU frameworks. The CBG-MEB's science-policy priorities for 2025-2029 emphasize data-driven assessment and personalized medicine, while preparations for new EU pharmaceutical legislation and related critical-medicines initiatives push manufacturers and distributors toward compliance-ready supply strategies, including stockholding and more robust documentation for parallel trade. Together, these dynamics support service niches in real-world evidence generation, market access support, and compliant supply resilience across branded, generic, and biosimilar portfolios operating under insurer preference policies.
Recent Industry Developments in Netherlands Pharmaceutical Market
- July 2026: The Province of Zuid-Holland approved a EUR 31 million contribution for traffic and related infrastructure measures in Katwijk to facilitate Eli Lillys planned pharmaceutical manufacturing site. The decision supports a major greenfield project linked to expanding medicine production capacity, while also signaling the role of regional authorities in enabling large-scale life-sciences industrial development.
- July 2025: Ampersand Capital Partners acquired CurTec, expanding capabilities in high-performance packaging used across pharmaceutical and specialty applications. The transaction strengthens packaging supply options that support regulated distribution and product protection needs in the Dutch market.
- April 2024: The CBG-MEB published its Strategic Business Plan 2024-2028, outlining priorities such as data-driven assessment and readiness for upcoming EU pharmaceutical legislation. The plan provides a clearer operating direction for developers and authorization holders planning dossiers, post-marketing obligations, and evidence generation in the Netherlands.
Netherlands Pharmaceutical Market Report Scope and Research Methodology
Market Definition and Coverage
For this study, the market covers the value of prescription and over the counter medicines supplied to patients in the Netherlands through retail and hospital channels, stated at manufacturer level revenues and converted to USD for consistency.
Scope exclusions: This sizing excludes medical devices, diagnostics, hospital services, and non-drug pharmacy services.
Segments Covered in This Report
- By ATC / Therapeutic Class
- Alimentary Tract & Metabolism
- Blood & Blood-Forming Organs
- Cardiovascular System
- Dermatological Drugs
- Genitourinary System & Reproductive Hormones
- Systemic Hormonal
- Anti-infectives
- Antineoplastic & Immunomodulating Agents
- Musculoskeletal System
- Nervous System
- Others
- By Molecule Type
- Branded
- Generic
- Biosimilar
- By Distribution Channel
- Hospital Pharmacies
- Retail Pharmacies
- Online Pharmacies
- By Mode of Dispensing
- Prescription
- OTC
Data Sources, Market Sizing, and Validation
Desk Research
To build the initial demand and pricing picture, we used public health spending and utilization statistics that show how much medicine is used and paid for in the Netherlands. Examples include Statistics Netherlands (CBS) releases on health expenditure, National Health Care Institute (Zorginstituut Nederland) dashboards on reimbursed medicines, and OECD health statistics for prescription and OTC spending benchmarks.
We also reviewed regulatory and product availability signals that affect volumes and launches. For example, we used the European Medicines Agency (EMA) for approvals and safety updates, and Dutch policy inputs from the Ministry of Health, Welfare and Sport (VWS) for reimbursement and pricing rules. Company annual reports and investor presentations were also used to map the portfolio mix and exposure to the Netherlands, with reputable press serving as a supplementary check for notable changes. Where needed, we referenced paid subscriptions for company financials and patent and shipment context to cross-check assumptions. These are illustrative sources, and many other public and paid references were also consulted for data collection, validation, and clarification.
Primary Interviews and Surveys
Primary work was used to test what secondary data could not fully explain, including therapy-level growth drivers, the pace of generic uptake, and realistic price movement after reimbursement decisions. We spoke with a mix of manufacturers, distributors, and pharmacy and hospital channel stakeholders, plus payer or policy informed experts across the Netherlands. We then used these inputs to confirm modeling choices and remove obvious overstatements.
Distribution of primary research fieldwork respondents
| Company type | Respondent position |
|---|---|
| Top tier: 35% | CXOs: 12% |
| Mid tier: 49% | Functional/Unit leaders: 30% |
| Smaller Players: 16% | Managers: 58% |
Market-Sizing & Forecasting
The core build starts from a top-down demand pool that reconstructs pharmaceutical consumption from national spending and reimbursement signals, and then distributes it across key therapy areas using observed mix shifts and expert confirmation. Once that structure was stable, we ran selective bottom-up checks using supplier revenue disclosures, channel checks, and sampled volume by average price points to see if any part of the total looked overstated or understated.
Inputs tracked include medicine spending levels and growth, the balance of prescription versus OTC demand, generic and biosimilar penetration expectations, launch cadence for new therapies, and expected price movement shaped by reimbursement and tender dynamics. When data was not available at a fine level, gaps were handled by using proxy ratios from closely related therapy groups, then stress-testing those ratios in interviews.
For forecasting, we used scenario analysis supported by simple trend smoothing on the more stable series, and then adjusted the forward curve based on expert views on pipeline timing, switching behavior to higher cost therapies, and the likely speed of policy pass-through into prices and volumes. The output is repeatable from clear inputs, and it can be explained step by step on a client call.
Data Validation & Update Cycle
Results are checked through triangulation across spending signals, channel patterns, and company exposure, followed by variance checks to spot breakpoints that do not match known policy or launch events. If an anomaly is found, assumptions are revisited, and targeted re-contacts are used to confirm whether the deviation is real or driven by the model.
Before sign-off, the file is reviewed in multiple steps, including an independent sense-check against adjacent healthcare indicators and year-over-year movement that would be expected for the Netherlands. Reports are refreshed annually, with interim updates when material events occur, and a final pre-delivery pass so clients receive the latest updated view.
Mordor Intelligence's Netherlands Pharmaceutical Market Sizing Compared With Other Published Estimates
Published market values often do not match because people count different medicine categories, price points, and channels. They may also anchor the model to different base years. We keep the logic simple and traceable so the number can be followed back to real demand and payment signals.
Key gaps usually come from whether hospital dispensed drugs are fully included, whether OTC is treated as part of the same pool, and how currency conversion timing is handled when a euro market is reported in USD. Another driver is refresh cadence, since policy shifts and switches to higher priced therapies can change the total quickly. For that reason, CBS and reimbursement trend checks are used to keep Mordor Intelligence's estimate aligned with the observed spend direction.
Benchmark comparison
| Source | Market Size | Gaps in Research Methodology |
|---|---|---|
| Mordor Intelligence | USD 10.66 B (2025) | |
| Industry Association A | USD 9.90 B (2025) | This figure appears to lean on reimbursed outpatient prescriptions only, which can undercount hospital channel value and may exclude parts of OTC and private-pay demand. |
| Global Consultancy B | USD 12.40 B (2025) | The total likely expands scope by folding in adjacent pharmacy related revenues or applying a higher assumed price inflation path without enough channel level validation for the Netherlands. |
The spread across sources is mainly explained by what is counted as pharma value in the Netherlands and how quickly prices and mix are assumed to change. Our approach keeps the total linked to spending and reimbursement signals, then uses grounded cross-checks to prevent the model from drifting too optimistic or too conservative.
Key Questions Answered in the Report
How big is the Netherlands Pharmaceutical Market?
The Netherlands Pharmaceutical Market size is expected to reach USD 11.45 billion in 2026 and grow at a CAGR of 7.39% to reach USD 16.36 billion by 2031.
Which therapeutic class currently generates the highest revenue?
Cardiovascular system drugs hold the largest share at 13.84% of 2025 revenue.
Who are the key players in Netherlands Pharmaceutical Market?
Abbott Laboratories, AbbVie Inc., AstraZeneca Plc, Novartis AG and F. Hoffmann-La Roche AG are the major companies operating in the Netherlands Pharmaceutical Market.
How fast is the biosimilar segment expected to grow?
Biosimilars are projected to expand at an 8.63% CAGR between 2026 and 2031.