
Market Overview
| Study Period | 2020 - 2031 |
|---|---|
| Forecast Data Period | 2026 - 2031 |
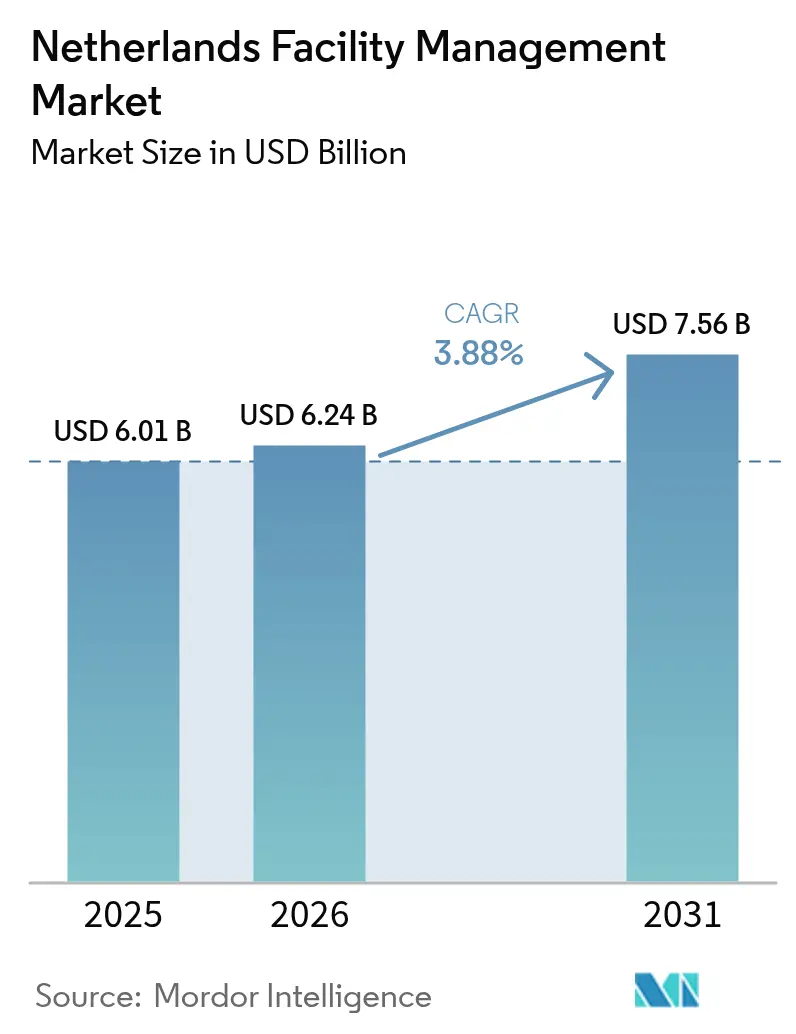
| Base Year Market Size (2025) | USD 6.01 Billion |
| Market Size (2026) | USD 6.24 Billion |
| Market Size (2031) | USD 7.56 Billion |
| Growth Rate (2026 - 2031) | 3.88% CAGR |
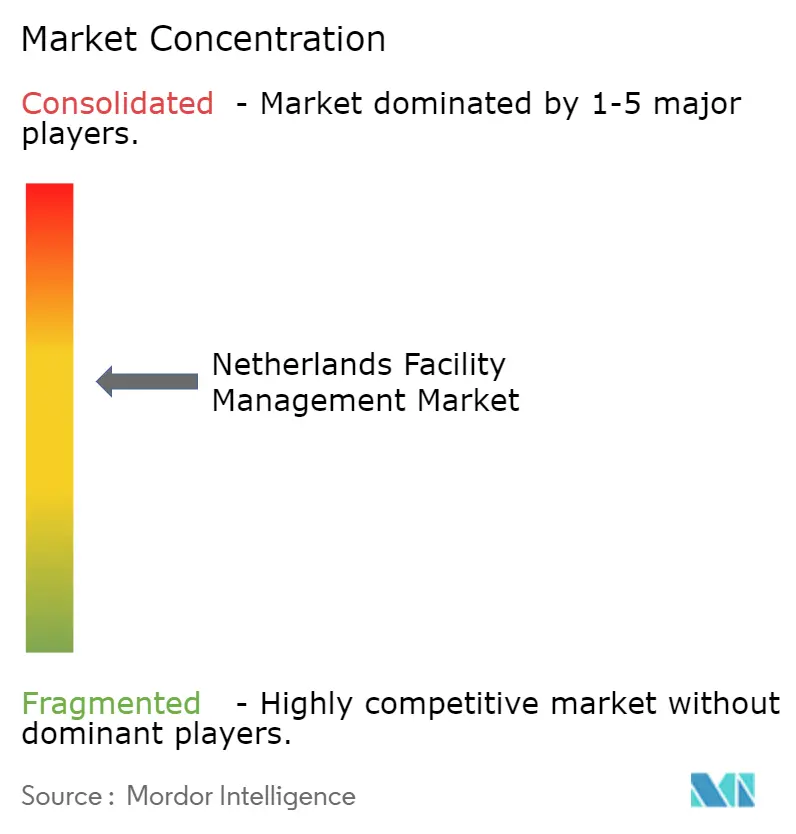
| Market Concentration | Medium |
Major Players *Disclaimer: Major Players sorted in no particular order Image © Mordor Intelligence. Reuse requires attribution under CC BY 4.0. | |
Netherlands Facility Management Market Analysis by Mordor Intelligence
The Netherlands facility management market size was valued at USD 6.01 billion in 2025 and estimated to grow from USD 6.24 billion in 2026 to reach USD 7.56 billion by 2031, at a CAGR of 3.88% during the forecast period (2026-2031). This trajectory signals a mature yet steadily expanding arena where decarbonization mandates, digital building platforms, and hybrid working patterns combine to generate recurrent demand. Spending shifts toward outcome-based contracts, together with the 2025 launch of the Corporate Sustainability Reporting Directive (CSRD), are encouraging firms to procure integrated solutions that document Scope 1-3 emissions and verify energy-efficiency paybacks. Providers able to embed IoT sensors, AI analytics, and digital-twin oversight into core hard-service routines are capturing share as asset owners target operating-cost reductions and BREEAM-NL certification premiums. Inflationary pressure on wages and materials is simultaneously nudging clients to outsource non-core activities, pushing the outsourced slice of the Netherlands facility management market past two-thirds of overall revenues. Competitive intensity remains moderate; multinationals leverage scale while regional specialists win on local labor networks and project agility.
Key Report Takeaways
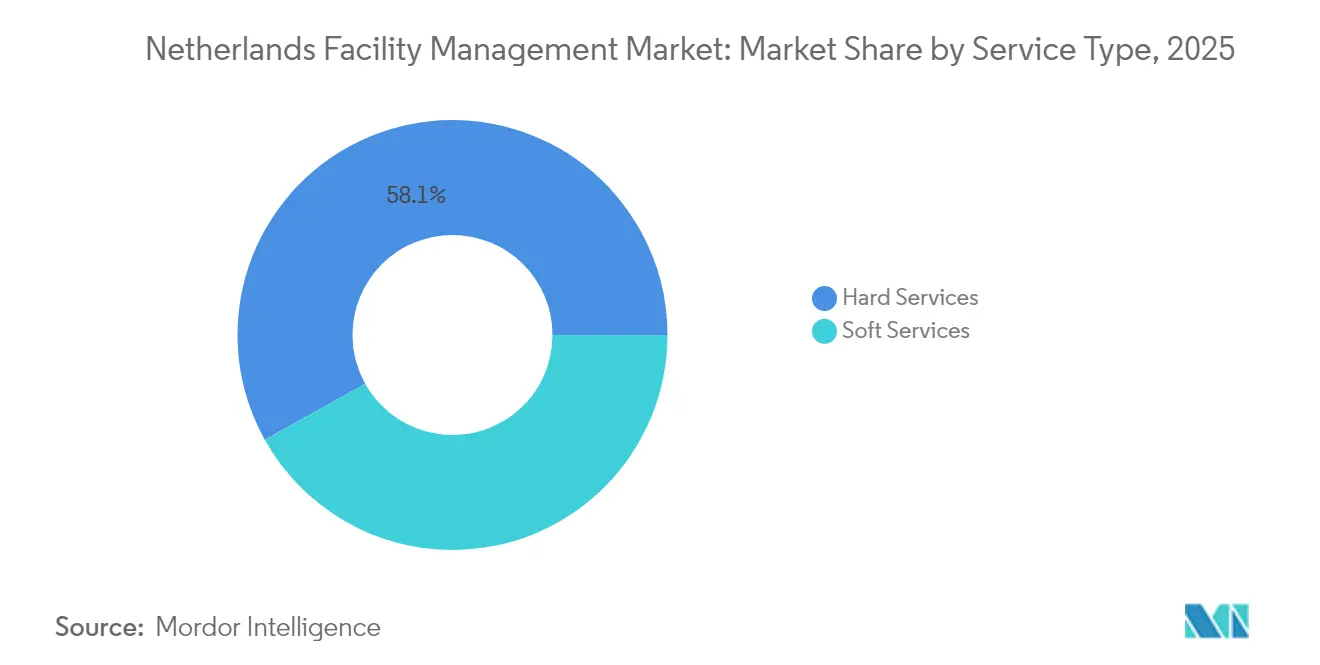
- By service type, hard services led with 58.10% of Netherlands facility management market share in 2025 while soft services are advancing at a 4.02% CAGR through 2031.
- By offering, the outsourced model accounted for 65.35% of the Netherlands facility management market size in 2025 and is projected to post a 3.92% CAGR to 2031.
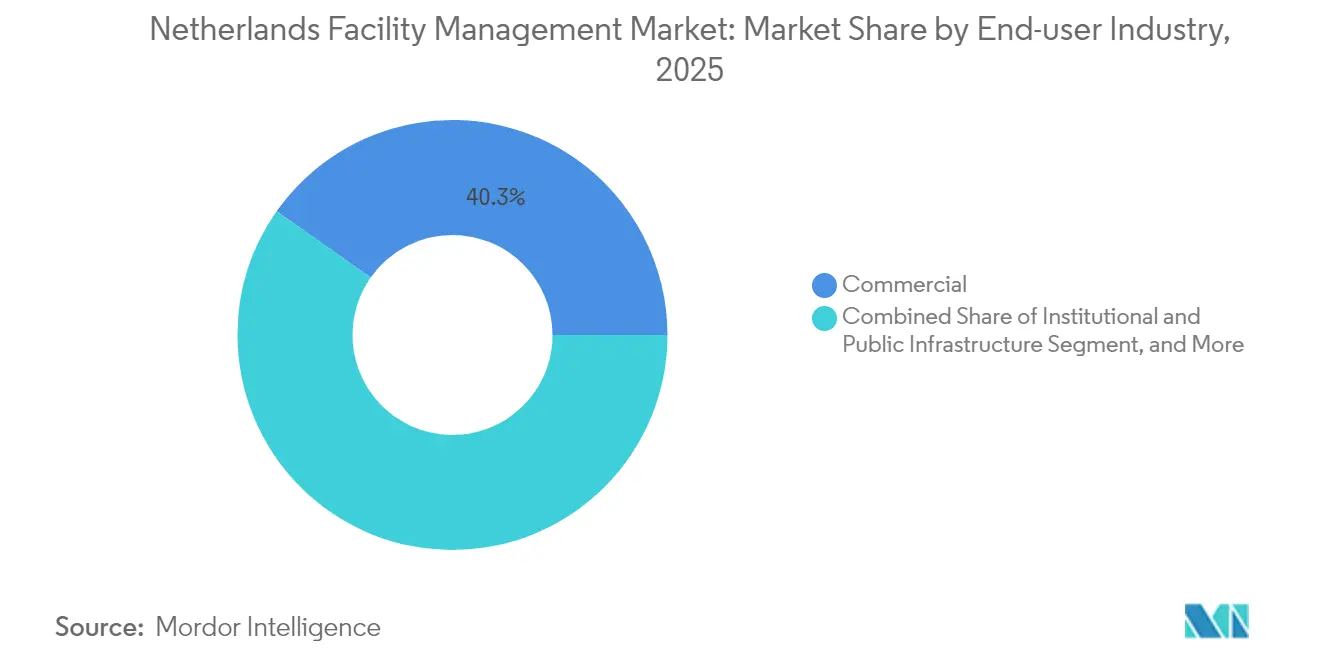
- By end-user industry, commercial facilities commanded 40.25% of the Netherlands facility management market size in 2025, whereas institutional and public infrastructure segments are expanding at a 4.46% CAGR to 2031.
Note: Market size and forecast figures in this report are generated using Mordor Intelligence’s proprietary estimation framework, updated with the latest available data and insights as of 2026.
Netherlands Facility Management Market Trends and Insights
Drivers Impact Analysis*
| Driver | (~) % Impact on CAGR Forecast | Geographic Relevance | Impact Timeline |
|---|---|---|---|
| Sustainability Drives Transformation in Facility Operations | +0.8% | National, with concentration in Amsterdam, Rotterdam, The Hague | Medium term (2-4 years) |
| Technology Integration Reshapes Service Delivery | +0.7% | National, with early adoption in Zuidas and Eindhoven tech corridors | Short term (≤ 2 years) |
| Hybrid Working Transforms Space Utilization | +0.6% | National, with highest impact in Amsterdam and Utrecht office markets | Short term (≤ 2 years) |
| Rising Outsourcing Trend Reshapes Service Models | +0.5% | National, with government sector leading adoption | Medium term (2-4 years) |
| Circular Economy Regulations Foster Demand for Resource-Efficient FM | +0.4% | National, with construction sector concentration | Long term (≥ 4 years) |
| Aging Building Stock Spurs Renovation and Maintenance Outsourcing | +0.9% | National, with 425,000 buildings requiring foundation repairs | Long term (≥ 4 years) |
| Source: Mordor Intelligence | |||
Sustainability Drives Transformation in Facility Operations
Mandatory Energy Label C for offices above 100 m² has turned regulatory compliance into the single largest catalyst for the Netherlands facility management market.[1]Loyens & Loeff, “Energy Labels Required for Office Buildings as of 2023,” loyensloeff.com Facility managers must implement measures with paybacks under 10 years, accelerating demand for energy audits, heat-pump retrofits, and building-fabric upgrades. BREEAM-NL certifications now influence asset valuations across prime districts, motivating owners to embed continuous commissioning and waste-minimization clauses in contracts.[2]Dutch Green Building Council, “Wat is BREEAM-NL,” breeam.nl The CSRD roll-out in 2025 obliges roughly 2,500 Dutch companies to disclose ESG KPIs, placing facility data capture at the heart of corporate reporting.[3]Coolset, “Dutch Implementation Proposal of the CSRD,” coolset.com Suppliers therefore promote green cleaning chemicals, circular-economy materials, and ISO 14001 workflows as differentiators. In parallel, government allocations of EUR 1 billion for emission-free construction stimulate retrofits that prioritize low-carbon concrete, modular façades, and cradle-to-cradle asset management.[4]Atradius, “Nederlandse bouwsector groeit 1.6% in 2025,” atradius.nl
Technology Integration Reshapes Service Delivery
IoT gateways connected to HVAC, lighting, and security assets deliver live telemetry that underpins predictive maintenance, cutting failure-related call-outs by up to 35% in pilot portfolios. Buildings such as The Edge in Amsterdam demonstrate electricity consumption 70% lower than comparable offices after digitized controls, occupancy analytics, and AI-driven optimization went live. Providers extend these learnings via digital-twin platforms capable of simulating alternative retrofit scenarios and benchmarking carbon footprints against BENG norms. Investment moves-Edge’s stake in TPEX International or IFS’s acquisition of ULTIMO-underscore how software ecosystems are becoming core to Netherlands facility management market competitiveness. Contracts are shifting from prescriptive task lists to outcome-based agreements promising kWh-savings or uptime thresholds, aligning supplier remuneration with measurable performance metrics.
Hybrid Working Transforms Space Utilization
Dutch office attendance stabilized near 56% in 2024, down from pre-pandemic peaks yet up from 2022 troughs. Government workforce surveys reveal 36% of employees prefer onsite presence only twice weekly, prioritizing work-life balance and commute reduction. These patterns compel facility teams to toggle air-handling volumes, cleaning routes, and security staffing in line with daily occupancy data. Space-booking apps, desk sensors, and digital reception kiosks enable service scaling that prevents resource wastage without sacrificing user experience. Soft-service suppliers are broadening mandates to include WELL-standard air quality monitoring and ergonomic furniture rotation, embedding employee satisfaction scores into KPIs. The result is a Netherlands facility management market where client value is judged by wellness metrics as much as by square-meter cleanliness.
Aging Building Stock Spurs Renovation and Maintenance Outsourcing
An estimated 425,000 properties across the country suffer subsidence-related foundation damage, creating sustained structural remediation outlays that favor external specialist contractors. Buildings erected before 1980 often rely on obsolete HVAC and electrical systems that fall short of current BENG and MPG efficiency rules, driving multi-year modernization pipelines. Because many owners lack in-house engineering depth, integrated facility managers capture long-term contracts covering structural repairs, façade renewal, and lifecycle asset planning. Funding support through the National Heat Fund and energy-saving grants further enlarges project scope. Consequently, capital-project advisory services are converging with traditional maintenance lines, broadening revenue bases for the Netherlands facility management market.
Restraints Impact Analysis*
| Restraint | (~) % Impact on CAGR Forecast | Geographic Relevance | Impact Timeline |
|---|---|---|---|
| Rising Costs Pressure Operational Efficiency | -0.4% | National, with highest impact in Amsterdam and Rotterdam metropolitan areas | Short term (≤ 2 years) |
| Labor Shortages Challenge Service Delivery | -0.6% | National, with critical shortages in skilled manual labor | Medium term (2-4 years) |
| Fragmented Supplier Ecosystem Limits Standardization | -0.3% | National, with regional variations in service quality | Medium term (2-4 years) |
| Stringent Tendering Processes Favor Lowest Bids Over Quality | -0.2% | National, with government sector concentration | Long term (≥ 4 years) |
| Source: Mordor Intelligence | |||
Rising Costs Pressure Operational Efficiency
Construction inflation eased in 2025 yet remains above historic norms after a 2.8% sector contraction in 2024 and a modest 1.6% rebound forecast this year. Facility managers now juggle elevated wage agreements, higher insurance premiums, and escalating material prices linked to global supply volatility. Simultaneously, compliance costs for CSRD reporting and Energy Performance Certificates raise overheads. Firms respond by automating workflow scheduling, clustering service routes, and renegotiating energy tariffs through collective-buying pools. Outcome-based pricing that ties fees to energy-savings ratios helps shield margins while justifying capital-expenditure outlays. Nevertheless, cost headwinds trim overall Netherlands facility management market CAGR by an estimated 0.4 percentage points.
Labor Shortages Challenge Service Delivery
McKinsey projects Dutch labor gaps could reach 1.4 million positions by 2030, with 100,000 vacancies in skilled manual roles foundational to facilities trade services. Tight talent pools inflate wages for electricians, HVAC technicians, and cleaning operatives, prompting providers to adopt robotics (e.g., autonomous scrubbers) and smart-glasses field support to stretch existing headcounts. Enforcement against false self-employment pushes freelancers toward salaried arrangements, pressuring small subcontractors reliant on flexible labor. Large multinationals answer with in-house academies, apprenticeship alliances, and migrant recruitment pipelines, yet onboarding lags still jeopardize tender compliance. Persistent shortages subtract a 0.6 percentage-point drag from the Netherlands facility management market growth outlook.
*Our forecasts treat driver/restraint impacts as directional, not additive. The impact forecasts reflect baseline growth, mix effects, and variable interactions.
Segment Analysis
By Service Type: Hard Services Drive Infrastructure Modernization
Hard services generated 58.10% of Netherlands facility management market share in 2025 on the back of structural remediation, HVAC upgrades, and fire-system lifecycle programs. The Netherlands facility management market size tied to hard services benefits from government subsidy schemes rewarding heat-pump adoption and low-carbon materials. Providers integrate IoT sensors into chillers and boilers to shift from reactive to predictive repairs, curbing downtime penalties and extending asset life. Aging post-war housing blocks and subsidence-affected canalside properties require foundation-jack stabilization, a niche where local specialists partner with larger FM integrators to meet safety timelines. Over the forecast, spending transitions from one-off refurbishments to rolling performance contracts that guarantee kilowatt reductions.
Soft services, while smaller, are forecast to grow 4.02% annually as hybrid working elevates employee-experience KPIs. Smart-dispensing cleaning robots help providers manage labor scarcity while ensuring consistent hygiene across fluctuating occupancy profiles. Concierge, catering, and security packages increasingly bundle wellness analytics to score biophilic design elements and indoor-air parameters against WELL benchmarks. The convergence of data streams allows suppliers to cross-sell energy coaching and waste-segregation advisory within their soft-service remit, cementing integrated positioning inside the Netherlands facility management market.


By Offering Type: Outsourcing Accelerates Through Specialization
Outsourced contracts captured 65.35% of Netherlands facility management market size in 2025 and are slated to climb at a 3.92% CAGR through 2031 as clients divest non-core support functions. Integrated FM (IFM) packages dominate new tenders, blending technical maintenance, soft services, and ESG reporting under single master agreements. Multinational landlords prize IFM providers that maintain ISO 55000 asset-management credentials and deliver cross-border governance compliance, including DORA cyber-resilience stipulations. Bundled FM contracts remain popular among mid-market portfolios seeking price efficiency through volume pooling, whereas single FM retains relevance for mission-critical environments such as data centers requiring domain-specific technicians.
In-house models persist within heavily regulated sectors like defense or nuclear medicine, yet budget austerity and skills constraints drive hybrid solutions where strategic oversight stays internal while field operations shift to external partners. As-a-service pricing structures-ranging from “lighting-as-a-service” to “energy-savings-as-a-service”-gain ground, shifting capital expenditures onto providers’ balance sheets. These structures align cost with measurable benefits, reinforcing the competitive moat of experienced suppliers inside the Netherlands facility management market.
By End-user Industry: Commercial Sector Leads While Public Infrastructure Accelerates
Commercial real estate, spanning offices, retail, and data hubs, accounted for 40.25% of Netherlands facility management market size in 2025, reflecting heavy demand for tenant-experience upgrades and net-zero carbon roadmaps. Landlords in Amsterdam’s Zuidas adopt digital twins to manage ventilation in real time, while retail chains deploy centralized BMS platforms to optimize refrigeration loads. IT, telecom, and co-working operators contract IFM providers able to deliver 24/7 uptime plus robust cybersecurity frameworks.
Institutional and public-infrastructure segments post the fastest expansion at 4.46% CAGR to 2031, buoyed by municipal circular-economy ordinances requiring resource-efficient maintenance of schools, hospitals, and transport nodes. Healthcare facilities adopt smart-ward cleaning robots and negative-pressure HVAC retrofits to meet infection-control guidelines, while the Ministry of Infrastructure’s renovation of waterways invites long-term FM alliances covering lock automation and predictive component swap-outs. Industrial sites demand intersectional expertise across safety, ATEX compliance, and energy management, creating high-margin niches for vertically specialized providers in the Netherlands facility management industry.
Geography Analysis
Amsterdam, Rotterdam, The Hague, Utrecht, and Eindhoven anchor more than two-thirds of Netherlands facility management market revenue, owing to dense commercial floorplates and advanced sustainability codes. Amsterdam’s Edge-led smart-building cluster sets energy benchmarks that ripple across national portfolios, reinforcing demand for high-tech FM services. Rotterdam’s port complex and petrochemical sites require integrated asset-integrity support blending corrosion monitoring, fire safety, and environmental permits. The Hague’s concentration of ministries drives security-cleared service contracts focusing on access control and classified waste disposal.
Beyond the Randstad, secondary hubs such as Groningen embrace standardized IFM solutions to maximize economies of scale across university campuses and energy-transition labs. Nationwide, 425,000 units of foundation-affected housing spur remediation frameworks funded partly through regional subsidies, distributing work evenly across provinces. Public-sector renovation aims to create 120,000 new homes by repurposing existing stock by 2030, further widening the Netherlands facility management market footprint.
Compact geography allows suppliers to centralize help-desk operations while deploying mobile engineering pods capable of reaching any major city within 90 minutes, compressing response-time SLAs. The government’s EUR 1 billion budget for clean construction technologies encourages providers to extend low-emission machinery and electric vehicle fleets, ensuring compliance across all Dutch regions. Climatic challenges such as sea-level rise and increased precipitation accelerate maintenance on dikes and pumping stations, reinforcing the strategic role of facility managers in national resilience planning.
Regulatory Landscape
Facility management in the Netherlands operates under a tightening building-performance and reporting framework shaped by national transpositions of EU rules and local execution via municipalities. The Environment and Planning Act (Omgevingswet), in force since 1 January 2024, consolidates permitting and compliance workflows through the digital Omgevingsloket, which affects retrofit planning, maintenance interventions, and documentation for building owners and their FM partners. In parallel, sustainability reporting has become a procurement driver following the 2025 CSRD roll-out referenced in the market overview, pushing clients to require auditable facility data and supplier documentation for Scope 1-3 reporting.
Energy-automation obligations are becoming more prescriptive for non-residential portfolios. From 1 January 2026, the Besluit bouwwerken leefomgeving (Bbl) requires building automation and control systems (GACS/BACS) for non-residential buildings above the 290 kW heating or air-conditioning threshold, which supports demand for continuous energy monitoring, performance verification, and interoperable controls. For government-occupied offices, the Rijksvastgoedbedrijf has reinforced technical expectations via HIB version 3.0 (2025), including ICT housing and cabling specifications that influence fit-out, power, and resilience requirements in serviced buildings. On the digital risk side, the Cyberbeveiligingswet (Cbw) and Wet weerbaarheid kritieke entiteiten (Wwke) take effect on 15 August 2026 under the supervision of the Rijksinspectie Digitale Infrastructuur (RDI) for relevant sectors, raising expectations for cybersecurity and resilience practices in FM delivery at critical and digital-infrastructure sites.
Value Chain Analysis
The Netherlands facility management value chain begins with upstream OEMs and distributors for HVAC, electrical, fire safety, security, cleaning equipment, and consumables, then moves through system integrators and software providers (CAFM, IWMS, EAM) that connect asset telemetry, work orders, and reporting. Service delivery is executed by integrated FM providers and specialized subcontractors (MEP, building envelope, cleaning, security, waste, and compliance testing), increasingly coordinated via digital platforms that support outcome-based SLAs around uptime, energy intensity, and user experience. Public and large-enterprise buyers also shape specifications through standards and templates, with NEN-EN-ISO 41000 used as a reference management-system standard in FM programs.
Downstream, the chain is being reorganized around asset data capture and auditable ESG evidence. The Rijksvastgoedbedrijf go-live of its Asset and Maintenance Management platform (supporting more than 410,000 assets) and the start of Planon Managed Services support in January 2026 show how central portfolios are shifting to standardized workflows that cascade to contractors, spare-parts channels, and field-service scheduling. On the procurement side, CSRD-aligned traceability is filtering into materials and consumables purchasing, as shown by Facility Trade Group adopting digital product passports to track CO2, water, and energy attributes across manufacturing-linked inputs used in FM operations. Dutch logistics strength supports national parts availability and rapid dispatch, while labor tightness keeps providers focused on automation, self-service portals, and tighter vendor-management controls to stabilize service levels across multi-site contracts.
Competitive Landscape
The Netherlands facility management market balances scale economies of global groups with the domain depth of regional specialists. ISS, Sodexo, and CBRE leverage multinational procurement, proprietary tech stacks, and cross-sector expertise to secure complex IFM mandates. Facilicom, Vebego, and Unica differentiate on local labor networks, circular-economy know-how, and sector-specific engineering. Mid-tier outfits such as Asito and Dolmans exploit niche verticals—air-terminal clean-ing or heritage-building maintenanceunattractive to larger rivals.
Digital capability increasingly dictates win probabilities. ISS’s cloud-based data lake harmonizes energy and occupancy metrics across 1,600 properties after its 2024 acquisition of gammaRenax, reinforcing European service depth Vebego’s 2023 turnover of EUR 1.48 billion funds expansion of robotics pilots and brand consolidation strategies aimed at unified customer touchpoints. IFS’s purchase of ULTIMO embeds SaaS EAM into field-service scheduling, promising predictive insights that unlock 18% global EAM market share under the combined entity.
Strategic alliances flourish: Edge collaborates with TPEX International to manage 1,000 high-performance buildings via digital twins, while Renew Holdings’ Full Circle takeover primes entry into onshore-wind maintenance. ESG consulting bolt-ons and AI-powered analytics platforms represent prized acquisition targets as buyers seek differentiated IP. Despite consolidation sparks, market fragmentation endures, granting agile local providers capacity to outmaneuver larger peers on bespoke, short-cycle projects within the Netherlands facility management market.
Netherlands Facility Management Industry Leaders
Apleona GmbH
Vebego International BV
Hago Netherlands BV
DW Facility Group BV
Fortrus
- *Disclaimer: Major Players sorted in no particular order

Market Opportunities and Future Outlook
A prominent opportunity is compliance-led modernization of non-residential building operations around mandatory automation and continuous performance management. The Bbl-driven requirement effective 1 January 2026 for GACS/BACS in non-residential buildings above the 290 kW threshold expands the addressable scope for FM providers that can bundle controls integration, ongoing system maintenance, and data-driven energy optimization into hard-service contracts, including offices, warehouses, and industrial facilities. This regulatory pull fits the market shift toward outcome-based agreements described in the report context, where measured kWh savings, uptime, and verified efficiency improvements become contractual deliverables rather than optional add-ons.
A second whitespace area is ESG-grade data capture and auditable supply-chain documentation packaged within IFM. With CSRD reporting in-market since 2025 for a large set of Dutch companies, buyers increasingly request facility-level evidence across energy, waste, chemicals, and supplier inputs; the use of digital product passports by Facility Trade Group is one example of how upstream documentation is being productized to support reporting needs. In the public estate and large institutional portfolios, platform-driven standardization also creates room for providers that can integrate with client systems at scale, as reflected by the Rijksvastgoedbedrijf AMM program managing over 410,000 assets and supported by Planon Managed Services from January 2026. These shifts increase the value of FM offerings that combine technical maintenance, software integration, and governance-ready reporting in a single delivery model.
Recent Industry Developments
- April 2026: Vebego Facility Solutions renewed its contract with Stichting Altrecht GGZ for facility services, covering activities such as cleaning, catering, and waste management. The continuation reinforces multi-service, healthcare-oriented delivery capabilities where hygiene, continuity, and sustainability requirements shape tender outcomes.
- February 2025: IFS completed its acquisition of Netherlands-based ULTIMO, expanding its SaaS enterprise asset management footprint across a large installed base. The combination strengthens digital workflows for maintenance planning and field execution, which supports the market shift toward data-driven, outcome-based FM contracts.
- January 2024: The Environment and Planning Act (Omgevingswet) entered into force, consolidating environmental and building-related permitting processes and moving execution into the digital Omgevingsloket. The change reshaped how retrofit, renovation, and compliance documentation is organized, which raises the importance of providers that can manage permit-led project coordination and audit-ready records across dispersed portfolios.


Research Methodology Framework and Report Scope
Market Definition and Coverage
For this study, the Netherlands facility management market is defined as the value of outsourced and in-house services that keep buildings and sites running safely and efficiently. The scope covers hard services (maintenance, MEP, HVAC, safety systems) and soft services (cleaning, catering, security, office support).
Scope exclusions: real estate asset ownership, property development income, and pure construction or major renovation project revenues are excluded from the market value.
Segmentation Overview
- By Service Type
- Hard Services
- Asset Management
- MEP and HVAC Services
- Fire Systems and Safety
- Other Hard FM Services
- Soft Services
- Office Support and Security
- Cleaning Services
- Catering Services
- Other Soft FM Services
- Hard Services
- By Offering Type
- In-house
- Outsourced
- Single FM
- Bundled FM
- Integrated FM
- By End-user Industry
- Commercial (IT and Telecom, Retail and Warehousing)
- Hospitality (Hotels, Eateries and Restaurants)
- Institutional and Public Infrastructure (Government, Education, Transport)
- Healthcare (Public and Private Facilities)
- Industrial and Process (Manufacturing, Energy, Mining)
- Other End-user Industries (Multi-housing, Entertainment, Sports and Leisure)
Data Sources, Market Sizing, and Validation
Desk Research
Desk research started with mapping the service universe and demand pool for facility management across commercial, institutional, healthcare, hospitality, and industrial sites in the Netherlands. We used public sources such as Statistics Netherlands (CBS) for sector activity and labor context, Eurostat for consistent macro series, and the European Commission for building and energy policy direction that affects FM buying.
To anchor service intensity and cost drivers, we reviewed materials from Dutch and European facility and workplace associations, including FMN publications, relevant public procurement portals for contract language and typical scopes, and peer-reviewed papers on building operations and maintenance practices. Company annual reports, investor presentations, and reputable press were also used to understand outsourcing mixes and service bundling trends. Where helpful, we referenced paid subscriptions for company financials and news to cross-check turnover ranges and event timing. These sources are illustrative, and many other references were used for data collection, validation, and clarification.
Primary Interviews and Surveys
Primary work focused on interviews and structured surveys with FM service providers, subcontractors, procurement teams, and site and building operations leaders across the Netherlands. Respondent input was mainly used to confirm typical scope boundaries (hard versus soft), how bundled and integrated contracts are priced, and what changes in energy rules and sustainability reporting are doing to contract sizes.
Distribution of primary research fieldwork respondents
| Company type | Respondent position | Region |
|---|---|---|
| Top tier: 39% | CXOs: 13% | |
| Mid tier: 46% | Functional/Unit leaders: 35% | |
| Smaller Players: 15% | Managers: 52% |
Market-Sizing & Forecasting
The sizing logic uses a top-down approach where national demand is reconstructed from the active building and site base and the expected service spend intensity by end-user type, then translated into annual value for hard and soft FM. To keep the totals realistic, we corroborated with selective bottom-up checks, such as sampled contract values by service bundle and cross-checks against reported FM-related revenue exposure for a set of suppliers.
Key inputs in the model included outsourced versus in-house adoption rates, the mix of single-service, bundled, and integrated contracts, typical contract durations and renewal behavior, wage and input-cost movement for labor-heavy services (cleaning, security, catering), and energy-efficiency related maintenance activity that influences hard-service spend. Where gaps appeared in smaller-provider coverage, we used conservative extrapolations from regional provider density and contract-size ranges validated by interviews. For forecasting, scenario analysis was applied around inflation pass-through, sustainability compliance spend, and office occupancy normalization, and then smoothed with trend-based time series checks so the final path stays consistent year to year.
Data Validation & Update Cycle
Validation was handled through multiple checks that compare model outputs with independent signals, including outsourcing penetration feedback from interviews, public procurement award patterns, and broad labor and service activity indicators. If an assumption creates a sharp step-up or drop, it is flagged and reviewed, and we re-contact sources when the variance cannot be explained by a clear market event.
Before sign-off, the full model and key assumptions go through an analyst review sequence so arithmetic, unit logic, and scope interpretation stay consistent. Reports are refreshed annually, and interim updates are done when material events change service demand or pricing, for example major regulation changes or a sudden shift in input costs. Right before delivery, a final update pass is completed so clients receive the latest view available.
Mordor Intelligence's Netherlands Facility Management Market Size Compared With Other Published Estimates
Published market sizes for facility management in the Netherlands often do not match because different studies count different items and apply different pricing and coverage assumptions. The main drivers are what is treated as facility services versus real estate value, whether in-house activity is counted, and how contract bundles are converted into annual revenue.
In this market, one common gap is that some figures are built from a broader "facility and workplace" lens that may fold in real estate or workplace-related categories, which pushes totals higher even when the service activity is similar. Differences can also come from the year used for currency conversion, how inflation pass-through is handled in catering and cleaning, and whether integrated contracts are split into hard and soft parts or kept as one block.
Benchmark comparison
| Source | Market Size | Gaps in Research Methodology |
|---|---|---|
| Mordor Intelligence | USD 6.01 B (2025) | |
| Industry Association A | USD 43.60 B (2024) | Uses a broader facility and workplace total that can include adjacent workplace and real-estate-linked value, and it is not aligned to an FM services-only spend view for the Netherlands. |
| Trade Journal B | USD 44.70 B (2024) | Reports a Euro-denominated Dutch facility and workplace figure excluding real estate, but it can still include wider workplace management categories and may not consistently separate in-house activity from outsourced FM service revenues. |
The spread mainly reflects what is counted as "FM services" versus broader workplace and property-linked value, plus how multi-service contracts are annualized. By keeping the total tied to hard and soft FM service delivery in the Netherlands and validating spend intensity and outsourcing mix through interviews, the estimate stays more traceable to repeatable drivers, a choice applied by Mordor Intelligence.


Key Questions Answered in the Report
What is the current size of the Netherlands facility management market?
The Netherlands facility management market size is USD 6.24 billion in 2026, with a projected CAGR of 3.88% to 2031.
Which service category leads market revenues?
Hard services dominate with 58.10% of Netherlands facility management market share due to pervasive infrastructure modernization needs.
How important is outsourcing in Dutch facility operations?
Outsourced models account for 65.35% of revenues and are expected to continue growing as compliance complexity and technology requirements rise.
Which end-user segment is expanding quickest?
Nstitutional and public-infrastructure facilities show a 4.46% CAGR, outpacing commercial and industrial segments on the back of sustainability mandates.
What technologies are reshaping facility management in the Netherlands?
IoT sensors, AI-driven analytics, and digital-twin platforms enable predictive maintenance, energy optimization, and outcome-based contracts across leading portfolios.
Page last updated on:






