| Study Period | 2018 - 2030 |
| Base Year For Estimation | 2024 |
| Forecast Data Period | 2025 - 2030 |
| Market Volume (2025) | 1.29 Thousand MW |
| Market Volume (2030) | 1.48 Thousand MW |
| CAGR | 2.66 % |
| Market Concentration | Low |
Major Players*Disclaimer: Major Players sorted in no particular order |

Netherlands Data Center Market Analysis
The Netherlands Data Center Market size is estimated at 1.29 thousand MW in 2025, and is expected to reach 1.48 thousand MW by 2030, growing at a CAGR of 2.66%. Further, the market is expected to generate colocation revenue of USD 2,153.1 Million in 2025 and is projected to reach USD 3,346.4 Million by 2030, growing at a CAGR of 9.22% during the forecast period (2025-2030).
The Netherlands continues to strengthen its position as a leading digital infrastructure hub in Europe, ranking third in the EU's 2022 Digital Economy and Society Index. This achievement reflects the country's comprehensive digital transformation strategy, which includes significant investments in emerging technologies through the National Growth Fund. The Dutch government has allocated EUR 960 million to strategic projects in quantum computing, artificial intelligence, and life sciences, demonstrating its commitment to maintaining technological leadership. This investment approach has created a robust ecosystem that attracts both domestic and international data center operators, while simultaneously fostering innovation across various sectors.
The Dutch data center market is experiencing a significant shift toward sustainability and energy efficiency, with over 80% of facilities now powered by green data center sources. This transformation aligns with the country's ambitious climate goals and the requirements of the Climate Neutral Data Centre Pact. Data center operators are increasingly implementing advanced cooling technologies, exploring waste heat utilization, and investing in renewable energy infrastructure. These initiatives are complemented by strict government regulations on energy consumption and environmental impact, particularly for new data center developments.
The financial services sector is driving substantial digital infrastructure demand, with nearly 91% of banking transactions now conducted online. This digital transformation extends beyond banking, as over 80% of Dutch businesses have adopted cloud computing solutions for their operations. The widespread adoption of digital services has led to the emergence of new requirements for data center infrastructure, particularly in terms of security, reliability, and processing capabilities. This evolution has prompted data center operators to upgrade their facilities and expand their data center services offerings to meet the sophisticated needs of modern enterprises.
The market is witnessing a notable shift in facility specifications and certifications, with 87.1% of medium-sized data center facilities now holding Tier 3 certification. This trend reflects the increasing demand for higher reliability and performance standards across the industry. Data center operators are responding by implementing advanced infrastructure solutions, including modular designs, enhanced power distribution systems, and sophisticated cooling technologies. The focus on facility optimization is further driven by the need to support emerging technologies such as edge computing, artificial intelligence, and machine learning applications, which require more robust and flexible data center infrastructure configurations.
Netherlands Data Center Market Trends
Implementation of 5G with maximum Dutch population covered by 3.5GHz 5G network till 2030 boost the market demand
- The total data traffic per smartphone in the country is expected to be 2.1 GB in 2023 and register a CAGR of 18.19% during the forecast period, reaching a value of 5.8 GB by 2029.
- Smartphones continue to be the most popular tech device among the Dutch population. For instance, the number of smartphone connections in the Netherlands increased by 695,000 (+3.5%) between 2021 and 2022. In January 2022, there were 16.50 million internet users, or 96% of the country's population, in the Netherlands.
- The adoption of 4G increased the country's use of social media platforms, owing to which the percentage of mobile usage grew by around 4%, reaching 44.05% in January 2022. For example, the Netherlands has a constantly increasing social media user base. Nearly 11.77 million people used social networks in the Netherlands in 2021, or 88% of the country's population. The Netherlands also witnessed an increased consumer expenditure on digital OTT video from 2009 to 2021, accounting for EUR 772.7 million in 2021.
- The implementation of 5G is projected to impact data traffic positively. By 2026, the country's 3.5GHz (5G) rollout is anticipated to be complete. By 2030, 60% of the Dutch population will be covered by the 3.5GHz 5G network, up from 33% in 2023. This trend may greatly encourage the usage of VOD. More servers will be required in data centers due to their increased demand and the rising adoption of digital connectivity among end users. In general, such developments may accommodate an increase in the demand for data centers.

Understand The Key Trends Shaping This Market
Download PDF
Increasing trend of ecommerce, social media and demand for internet is boosting the market demand
- The country's total number of smartphone users was 15.88 million in 2022, which is expected to record a CAGR of 2.22% during the forecast period to reach a value of 18.12 million by 2029.
- In the Netherlands, 87% of people owned a smartphone in 2020. There will be an estimated 16.12 million smartphone users in the Netherlands by 2025. From 2021 to 2025, the percentage of smartphone users increased by 3.27%. Due to the increasing amount of data generated by smartphones, the demand for storage capacity to accommodate may also increase. With a 7.6% contribution from the digital economy to the country's overall GDP of more than USD 750 billion, the Netherlands' data center market is booming.
- Global e-commerce trends are also impacting the behaviors of Dutch internet users. The "phygital" strategy, which encourages retailers to combine the physical and digital aspects of purchasing, is being promoted by Thuiswinkel, the national association of Dutch e-commerce. Such a trend has increased smartphone penetration in the country.
- The adoption rate of smartphones has been rising as more than half of Dutch adults use some form of social media, and nearly 90% of them use the internet. The two social networking sites, LinkedIn and Twitter, have the highest internet penetration rates in the Netherlands. In December 2021, Zeewolde, a town 50 km east of Amsterdam, approved Meta's plans to construct the biggest data center in the Netherlands to serve Facebook, Instagram, and Whatsapp users in Europe. Such developments suggest the growing demand for data centers.

OTHER KEY INDUSTRY TRENDS COVERED IN THE REPORT
- Development and adoption of IoT and AI applications complemented by 5G through government initiatives boost the market growth
- Increasing investment in fiber connectivity with newer partnerships is boosting the market demand
- Government spending on five Dutch European Digital Innovation Hubs (EDIH) and increase in fiber deployment boost the market demand
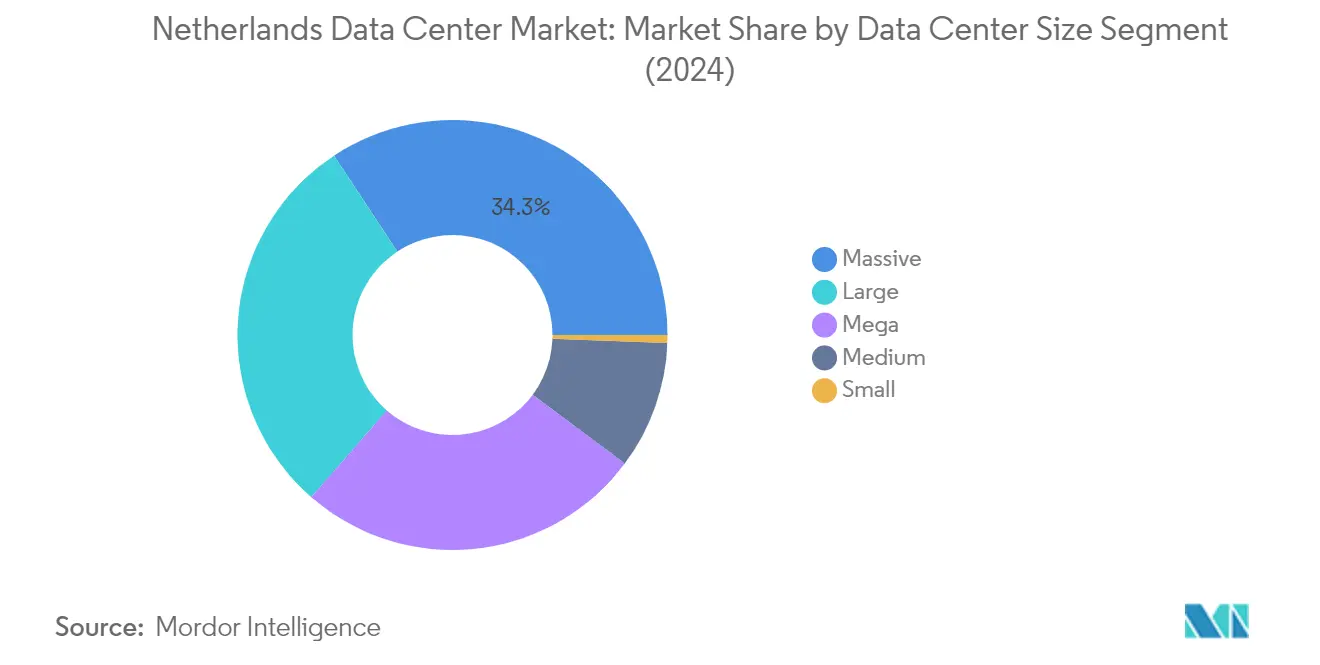
Segment Analysis: Data Center Size
Massive Segment in Netherlands Data Center Market
The massive segment dominates the Netherlands data center market, commanding approximately 34% market share in 2024. The country currently hosts 18 massive data centers with a significant concentration in Amsterdam, accounting for over 85% of massive facilities. Leading operators like Equinix Inc. and Interxion are driving this segment's growth, with Equinix Inc. contributing over 25% of the overall segment capacity through its facilities concentrated in Amsterdam. The massive segment's prominence is supported by local government incentives, tax benefits, and the strategic importance of Amsterdam as a key data center hub in Europe. These facilities primarily serve large enterprises, cloud service providers, and organizations requiring substantial computing infrastructure.
Large Segment in Netherlands Data Center Market
The large segment is experiencing the most rapid growth in the Netherlands data center market, projected to expand at approximately 5% through 2024-2029. This impressive growth is driven by several factors, including the ongoing construction of seven new large-size data center facilities in Amsterdam. Major players like e-Shelter, Switch Data Center, and NTT Ltd have announced plans to launch multiple data centers with significant capacities - e-Shelter planning three facilities with 30 MW capacity, Switch Data Center announcing three facilities with 45 MW capacity, and NTT Ltd contributing 20 MW of capacity. The segment's growth is further supported by the Netherlands' digital transformation initiatives and its position as the third-ranked country in the EU's Digital Economy and Society Index.
Remaining Segments in Data Center Size Market
The medium, mega, and small segments complete the Netherlands data center market landscape, each serving distinct market needs. The medium segment primarily caters to regional enterprises and smaller cloud service providers, with facilities spread between Amsterdam and other regions of the Netherlands. The mega segment, predominantly located in Amsterdam hotspots, serves hyperscale requirements and large-scale cloud operations. The small segment, while representing a minor portion of the market, continues to serve specific niche requirements, particularly for local businesses and organizations requiring smaller computing facilities. These segments collectively contribute to the market's diversity and ability to serve various customer requirements across different scales of operation.
Segment Analysis: Tier Type
Tier 3 Segment in Netherlands Data Center Market
The Tier 3 segment dominates the Netherlands data center market, commanding approximately 77% market share in 2024. This significant market presence is attributed to the segment's optimal balance between reliability and cost-effectiveness for most enterprise applications. The Netherlands hosts around 86 Tier 3 certified data centers, with Amsterdam accounting for over 80% of these facilities. Major players like Global Switch, Interxion (Digital Realty), and Equinix Inc. have established multiple Tier 3 facilities in the country, with several operators having announced plans for new Tier 3 data centers. These facilities are particularly attractive to cloud service providers, financial institutions, and enterprise customers who require high availability without the premium costs associated with Tier 4 infrastructure.
Tier 4 Segment in Netherlands Data Center Market
The Tier 4 segment is experiencing the most rapid growth in the Netherlands data center market, with projections indicating an expansion rate of approximately 6% during 2024-2029. This accelerated growth is driven by increasing demand for mission-critical applications and the rising adoption of high-performance computing solutions. The segment's growth is particularly notable in Amsterdam, where operators like Evoswitch and Equinix Inc. have established state-of-the-art Tier 4 facilities. The expansion is further supported by the growing presence of hyperscale cloud providers and financial institutions requiring the highest levels of redundancy and reliability. The segment's robust growth trajectory is reinforced by ongoing investments in advanced data center cooling systems, data center power redundancy, and sophisticated data center security measures.
Remaining Segments in Tier Type
The Tier 1 & 2 segment represents the basic infrastructure level in the Netherlands data center market, primarily serving small-scale operations and organizations with less demanding uptime requirements. These facilities, while offering lower redundancy levels, continue to serve specific market niches where cost-effectiveness takes precedence over high availability. The segment maintains its relevance in smaller cities and regions outside Amsterdam, particularly supporting local businesses and organizations with basic hosting needs. However, the increasing digitalization of businesses and growing reliability requirements have led to a gradual shift away from these basic tier levels, with most new developments focusing on higher tier certifications.
Segment Analysis: Absorption
Utilized Segment in Netherlands Data Center Market
The utilized segment dominates the Netherlands data center market, accounting for approximately 72% of the total IT load capacity in 2024. This segment encompasses various end-users, including cloud service providers, financial institutions, telecom operators, and e-commerce companies that are actively using data center facilities. The segment is also experiencing the strongest growth trajectory, projected to grow at around 4% from 2024 to 2029, driven by increasing digitalization across industries and the growing adoption of cloud computing services. The high utilization rates in Amsterdam, which currently stand at around 70%, demonstrate the robust demand for data center services in the country. The growth is further supported by the Dutch government's commitment to digitalization, including investments in quantum computing, artificial intelligence, and advanced digital infrastructure. Additionally, the increasing presence of hyperscale cloud providers and the expansion of existing data center operators are contributing to the segment's continued dominance in the market.
Non-Utilized Segment in Netherlands Data Center Market
The non-utilized segment represents the available capacity in data centers that is yet to be occupied by end-users. This segment plays a crucial role in the market by providing the necessary headroom for future expansion and ensuring that data centers can accommodate sudden spikes in demand. The segment includes reserve capacity maintained by operators for redundancy purposes and newly constructed facilities that are gradually being filled. Data center operators strategically maintain this unused capacity to ensure they can quickly respond to growing customer demands and maintain service quality. The presence of non-utilized capacity also helps in maintaining competitive pricing in the market and provides flexibility for businesses looking to scale their operations. Furthermore, this segment serves as a buffer that enables data centers to implement maintenance and upgrades without disrupting existing services, while also allowing them to accommodate new technologies and changing customer requirements.
Netherlands Data Center Industry Overview
Top Companies in Netherlands Data Center Market
The Netherlands data center market is characterized by continuous innovation in colocation services and infrastructure development. Companies are focusing on expanding their facilities with advanced cooling systems, enhanced power efficiency, and improved connectivity solutions. Strategic partnerships with cloud service providers and network operators have become increasingly common to strengthen market positions. Operational excellence is being pursued through automation, smart monitoring systems, and sustainable practices, with many providers committing to carbon-neutral data center operations. The market has witnessed significant expansion through both greenfield developments and facility upgrades, particularly in the Amsterdam metropolitan area. Companies are also investing heavily in edge computing capabilities and hybrid data center solutions to meet evolving customer demands.
Global Players Dominate Dutch Data Center Landscape
The Netherlands data center market exhibits a relatively concentrated structure dominated by major global infrastructure providers and telecommunications companies. These established players leverage their extensive international networks and technological capabilities to maintain strong market positions. The market has seen significant consolidation through strategic acquisitions and partnerships, particularly as global operators seek to strengthen their European presence through the Netherlands as a key digital hub. Local operators maintain competitive positions through specialized services and strong regional relationships, though their market share remains relatively limited compared to international players.
The competitive dynamics are shaped by a mix of traditional colocation providers and emerging cloud-focused operators. Market consolidation continues as larger players acquire smaller facilities and regional providers to expand their footprint and service capabilities. Recent years have seen several notable mergers and acquisitions, particularly involving American and European companies seeking to establish or strengthen their presence in the Dutch market. This trend has been driven by the Netherlands' strategic position as a digital gateway to Europe and its robust infrastructure ecosystem.
Innovation and Sustainability Drive Future Success
Success in the Dutch data center market increasingly depends on providers' ability to balance expansion with sustainability commitments. Incumbent providers are focusing on renewable energy adoption, waste heat utilization, and energy-efficient technologies to maintain their market positions while meeting stringent environmental regulations. The ability to offer comprehensive solutions that integrate colocation, connectivity, and cloud services has become crucial for market success. Companies are also investing in advanced security measures and compliance capabilities to address growing concerns about data protection and sovereignty.
For new entrants and smaller players, differentiation through specialized data center services and strategic location selection has become essential for gaining market share. The focus on secondary markets outside Amsterdam presents opportunities for growth, particularly as regulations limit hyperscale development in traditional hotspots. Success factors include the ability to forge strong partnerships with cloud providers, network operators, and local utilities. The regulatory environment, particularly regarding energy consumption and environmental impact, will continue to shape market dynamics and investment decisions. Companies must also consider the increasing demand for modular data center capabilities and the need to serve specific industry verticals with tailored solutions.
Netherlands Data Center Market Leaders
-
CyrusOne Inc.
-
EdgeConneX Inc.
-
Equinix Inc.
-
Interxion (Digital Reality Trust Inc.)
-
Iron Mountain Incorporated
- *Disclaimer: Major Players sorted in no particular order

Need More Details on Market Players and Competiters?
Download PDF
Netherlands Data Center Market News
- December 2022: A new data center was built in Eindhoven by NorthC Datacenters, a local provider of data centers in the Netherlands. In October 2023, the latest data center will open with a total surface area of nearly 4,000 sq. m.
- September 2022: Leaseweb Global announced to open three new data centers in Tokyo, Singapore, and Sydney before the year is out to increase its footprint in the Asia-Pacific region. When the new sites are live, Leaseweb will have nine data centers across the area.
- April 2022: NorthC Datacenters signed a contract to buy Netrics' Swiss data centers and connection offerings. The deal consists of three data centers with a combined floor area of around 13,000 sq. m, a power capacity of over 7.5 MW, and room for future growth, two of which are in Münchenstein (near Basel) and one in Biel.
Free With This Report
We provide a complimentary and exhaustive set of data points on the country and regional level metrics that present the fundamental structure of the industry. Presented in the form of 50+ free charts, the sections cover difficult to find data on various countries on smartphone users, data traffic per smartphone, mobile and broadband data speed, fiber connectivity network, and submarine cables.


Netherlands Data Center Market Report - Table of Contents
1. EXECUTIVE SUMMARY & KEY FINDINGS
2. REPORT OFFERS
3. INTRODUCTION
- 3.1 Study Assumptions & Market Definition
- 3.2 Scope of the Study
- 3.3 Research Methodology
4. MARKET OUTLOOK
- 4.1 It Load Capacity
- 4.2 Raised Floor Space
- 4.3 Colocation Revenue
- 4.4 Installed Racks
- 4.5 Rack Space Utilization
- 4.6 Submarine Cable
5. Key Industry Trends
- 5.1 Smartphone Users
- 5.2 Data Traffic Per Smartphone
- 5.3 Mobile Data Speed
- 5.4 Broadband Data Speed
- 5.5 Fiber Connectivity Network
-
5.6 Regulatory Framework
- 5.6.1 Netherlands
- 5.7 Value Chain & Distribution Channel Analysis
6. MARKET SEGMENTATION (INCLUDES MARKET SIZE IN VOLUME, FORECASTS UP TO 2030 AND ANALYSIS OF GROWTH PROSPECTS)
-
6.1 Hotspot
- 6.1.1 Amsterdam
- 6.1.2 Rest of Netherlands
-
6.2 Data Center Size
- 6.2.1 Large
- 6.2.2 Massive
- 6.2.3 Medium
- 6.2.4 Mega
- 6.2.5 Small
-
6.3 Tier Type
- 6.3.1 Tier 1 and 2
- 6.3.2 Tier 3
- 6.3.3 Tier 4
-
6.4 Absorption
- 6.4.1 Non-Utilized
- 6.4.2 Utilized
- 6.4.2.1 By Colocation Type
- 6.4.2.1.1 Hyperscale
- 6.4.2.1.2 Retail
- 6.4.2.1.3 Wholesale
- 6.4.2.2 By End User
- 6.4.2.2.1 BFSI
- 6.4.2.2.2 Cloud
- 6.4.2.2.3 E-Commerce
- 6.4.2.2.4 Government
- 6.4.2.2.5 Manufacturing
- 6.4.2.2.6 Media & Entertainment
- 6.4.2.2.7 Telecom
- 6.4.2.2.8 Other End User
7. COMPETITIVE LANDSCAPE
- 7.1 Market Share Analysis
- 7.2 Company Landscape
-
7.3 Company Profiles (includes Global Level Overview, Market Level Overview, Core Business Segments, Financials, Headcount, Key Information, Market Rank, Market Share, Products and Services, and Analysis of Recent Developments).
- 7.3.1 CyrusOne Inc.
- 7.3.2 EdgeConneX Inc.
- 7.3.3 Equinix Inc.
- 7.3.4 Evoswitch International BV
- 7.3.5 Global Switch Holdings Limited
- 7.3.6 Interxion (Digital Reality Trust Inc.)
- 7.3.7 Iron Mountain Incorporated
- 7.3.8 Keppel DC REIT Management Pte. Ltd
- 7.3.9 Leaseweb Global BV
- 7.3.10 NorthC Group BV
- 7.3.11 QTS Realty Trust Inc.
- 7.3.12 SD Data Center
- 7.4 LIST OF COMPANIES STUDIED
8. KEY STRATEGIC QUESTIONS FOR DATA CENTER CEOS
9. APPENDIX
-
9.1 Global Overview
- 9.1.1 Overview
- 9.1.2 Porter’s Five Forces Framework
- 9.1.3 Global Value Chain Analysis
- 9.1.4 Global Market Size and DROs
- 9.2 Sources & References
- 9.3 List of Tables & Figures
- 9.4 Primary Insights
- 9.5 Data Pack
- 9.6 Glossary of Terms
You Can Purchase Parts Of This Report. Check Out Prices For Specific Sections
Get Price Break-up Now
List of Tables & Figures
- Figure 1:
- VOLUME OF IT LOAD CAPACITY, MW, NETHERLANDS, 2018 - 2030
- Figure 2:
- VOLUME OF RAISED FLOOR AREA, SQ.FT. ('000), NETHERLANDS, 2018 - 2030
- Figure 3:
- VALUE OF COLOCATION REVENUE, USD MILLION, NETHERLANDS, 2018 - 2030
- Figure 4:
- VOLUME OF INSTALLED RACKS, NUMBER, NETHERLANDS, 2018 - 2030
- Figure 5:
- RACK SPACE UTILIZATION, %, NETHERLANDS, 2018 - 2030
- Figure 6:
- COUNT OF SMARTPHONE USERS, IN MILLION, NETHERLANDS, 2018 - 2030
- Figure 7:
- DATA TRAFFIC PER SMARTPHONE, GB, NETHERLANDS, 2018 - 2030
- Figure 8:
- AVERAGE MOBILE DATA SPEED, MBPS, NETHERLANDS, 2018 - 2030
- Figure 9:
- AVERAGE BROADBAND SPEED, MBPS, NETHERLANDS, 2018 - 2030
- Figure 10:
- LENGTH OF FIBER CONNECTIVITY NETWORK, KILOMETER, NETHERLANDS, 2018 - 2030
- Figure 11:
- VOLUME OF IT LOAD CAPACITY, MW, NETHERLANDS, 2018 - 2030
- Figure 12:
- VOLUME OF HOTSPOT, MW, NETHERLANDS, 2018 - 2030
- Figure 13:
- VOLUME SHARE OF HOTSPOT, %, NETHERLANDS, 2018 - 2030
- Figure 14:
- VOLUME SIZE OF AMSTERDAM, MW, NETHERLANDS, 2018 - 2030
- Figure 15:
- VOLUME SHARE OF AMSTERDAM, MW, HOTSPOT, %, NETHERLANDS, 2018 - 2030
- Figure 16:
- VOLUME SIZE OF REST OF NETHERLANDS, MW, NETHERLANDS, 2018 - 2030
- Figure 17:
- VOLUME SHARE OF REST OF NETHERLANDS, MW, HOTSPOT, %, NETHERLANDS, 2018 - 2030
- Figure 18:
- VOLUME OF DATA CENTER SIZE, MW, NETHERLANDS, 2018 - 2030
- Figure 19:
- VOLUME SHARE OF DATA CENTER SIZE, %, NETHERLANDS, 2018 - 2030
- Figure 20:
- VOLUME SIZE OF LARGE, MW, NETHERLANDS, 2018 - 2030
- Figure 21:
- VOLUME SIZE OF MASSIVE, MW, NETHERLANDS, 2018 - 2030
- Figure 22:
- VOLUME SIZE OF MEDIUM, MW, NETHERLANDS, 2018 - 2030
- Figure 23:
- VOLUME SIZE OF MEGA, MW, NETHERLANDS, 2018 - 2030
- Figure 24:
- VOLUME SIZE OF SMALL, MW, NETHERLANDS, 2018 - 2030
- Figure 25:
- VOLUME OF TIER TYPE, MW, NETHERLANDS, 2018 - 2030
- Figure 26:
- VOLUME SHARE OF TIER TYPE, %, NETHERLANDS, 2018 - 2030
- Figure 27:
- VOLUME SIZE OF TIER 1 AND 2, MW, NETHERLANDS, 2018 - 2030
- Figure 28:
- VOLUME SIZE OF TIER 3, MW, NETHERLANDS, 2018 - 2030
- Figure 29:
- VOLUME SIZE OF TIER 4, MW, NETHERLANDS, 2018 - 2030
- Figure 30:
- VOLUME OF ABSORPTION, MW, NETHERLANDS, 2018 - 2030
- Figure 31:
- VOLUME SHARE OF ABSORPTION, %, NETHERLANDS, 2018 - 2030
- Figure 32:
- VOLUME SIZE OF NON-UTILIZED, MW, NETHERLANDS, 2018 - 2030
- Figure 33:
- VOLUME OF COLOCATION TYPE, MW, NETHERLANDS, 2018 - 2030
- Figure 34:
- VOLUME SHARE OF COLOCATION TYPE, %, NETHERLANDS, 2018 - 2030
- Figure 35:
- VOLUME SIZE OF HYPERSCALE, MW, NETHERLANDS, 2018 - 2030
- Figure 36:
- VOLUME SIZE OF RETAIL, MW, NETHERLANDS, 2018 - 2030
- Figure 37:
- VOLUME SIZE OF WHOLESALE, MW, NETHERLANDS, 2018 - 2030
- Figure 38:
- VOLUME OF END USER, MW, NETHERLANDS, 2018 - 2030
- Figure 39:
- VOLUME SHARE OF END USER, %, NETHERLANDS, 2018 - 2030
- Figure 40:
- VOLUME SIZE OF BFSI, MW, NETHERLANDS, 2018 - 2030
- Figure 41:
- VOLUME SIZE OF CLOUD, MW, NETHERLANDS, 2018 - 2030
- Figure 42:
- VOLUME SIZE OF E-COMMERCE, MW, NETHERLANDS, 2018 - 2030
- Figure 43:
- VOLUME SIZE OF GOVERNMENT, MW, NETHERLANDS, 2018 - 2030
- Figure 44:
- VOLUME SIZE OF MANUFACTURING, MW, NETHERLANDS, 2018 - 2030
- Figure 45:
- VOLUME SIZE OF MEDIA & ENTERTAINMENT, MW, NETHERLANDS, 2018 - 2030
- Figure 46:
- VOLUME SIZE OF TELECOM, MW, NETHERLANDS, 2018 - 2030
- Figure 47:
- VOLUME SIZE OF OTHER END USER, MW, NETHERLANDS, 2018 - 2030
- Figure 48:
- VOLUME SHARE OF MAJOR PLAYERS, %, NETHERLANDS
Netherlands Data Center Industry Segmentation
Amsterdam are covered as segments by Hotspot. Large, Massive, Medium, Mega, Small are covered as segments by Data Center Size. Tier 1 and 2, Tier 3, Tier 4 are covered as segments by Tier Type. Non-Utilized, Utilized are covered as segments by Absorption.| Hotspot | Amsterdam | |||
| Rest of Netherlands | ||||
| Data Center Size | Large | |||
| Massive | ||||
| Medium | ||||
| Mega | ||||
| Small | ||||
| Tier Type | Tier 1 and 2 | |||
| Tier 3 | ||||
| Tier 4 | ||||
| Absorption | Non-Utilized | |||
| Utilized | By Colocation Type | Hyperscale | ||
| Retail | ||||
| Wholesale | ||||
| By End User | BFSI | |||
| Cloud | ||||
| E-Commerce | ||||
| Government | ||||
| Manufacturing | ||||
| Media & Entertainment | ||||
| Telecom | ||||
| Other End User | ||||
Need A Different Region or Segment?
Customize Now
Market Definition
- IT LOAD CAPACITY - The IT load capacity or installed capacity, refers to the amount of energy consumed by servers and network equipments placed in a rack installed. It is measured in megawatt (MW).
- ABSORPTION RATE - It denotes the extend to which the data center capacity has been leased out. For instance, a 100 MW DC has leased out 75 MW, then absorption rate would be 75%. It is also referred as utilization rate and leased-out capacity.
- RAISED FLOOR SPACE - It is an elevated space build over the floor. This gap between the original floor and the elevated floor is used to accommodate wiring, cooling, and other data center equipment. This arrangement assist in having proper wiring and cooling infrastructure. It is measured in square feet (ft^2).
- DATA CENTER SIZE - Data Center Size is segmented based on the raised floor space allocated to the data center facilities. Mega DC - # of Racks must be more than 9000 or RFS (raised floor space) must be more than 225001 Sq. ft; Massive DC - # of Racks must be in between 9000 and 3001 or RFS must be in between 225000 Sq. ft and 75001 Sq. ft; Large DC - # of Racks must be in between 3000 and 801 or RFS must be in between 75000 Sq. ft and 20001 Sq. ft; Medium DC # of Racks must be in between 800 and 201 or RFS must be in between 20000 Sq. ft and 5001 Sq. ft; Small DC - # of Racks must be less than 200 or RFS must be less than 5000 Sq. ft.
- TIER TYPE - According to Uptime Institute the data centers are classified into four tiers based on the proficiencies of redundant equipment of the data center infrastructure. In this segment the data center are segmented as Tier 1,Tier 2, Tier 3 and Tier 4.
- COLOCATION TYPE - The segment is segregated into 3 categories namely Retail, Wholesale and Hyperscale Colocation service. The categorization is done based on the amount of IT load leased out to potential customers. Retail colocation service has leased capacity less than 250 kW; Wholesale colocation services has leased capacity between 251 kW and 4 MW and Hyperscale colocation services has leased capacity more than 4 MW.
- END CONSUMERS - The Data Center Market operates on a B2B basis. BFSI, Government, Cloud Operators, Media and Entertainment, E-Commerce, Telecom and Manufacturing are the major end-consumers in the market studied. The scope only includes colocation service operators catering to the increasing digitalization of the end-user industries.
| Keyword | Definition |
|---|---|
| Rack Unit | Generally referred as U or RU, it is the unit of measurement for the server unit housed in the racks in the data center. 1U is equal to 1.75 inches. |
| Rack Density | It defines the amount of power consumed by the equipment and server housed in a rack. It is measured in kilowatt (kW). This factor plays a critical role in data center design and, cooling and power planning. |
| IT Load Capacity | The IT load capacity or installed capacity, refers to the amount of energy consumed by servers and network equipment placed in a rack installed. It is measured in megawatt (MW). |
| Absorption Rate | It denotes how much of the data center capacity has been leased out. For instance, if a 100 MW DC has leased out 75 MW, then the absorption rate would be 75%. It is also referred to as utilization rate and leased-out capacity. |
| Raised Floor Space | It is an elevated space built over the floor. This gap between the original floor and the elevated floor is used to accommodate wiring, cooling, and other data center equipment. This arrangement assists in having proper wiring and cooling infrastructure. It is measured in square feet/meter. |
| Computer Room Air Conditioner (CRAC) | It is a device used to monitor and maintain the temperature, air circulation, and humidity inside the server room in the data center. |
| Aisle | It is the open space between the rows of racks. This open space is critical for maintaining the optimal temperature (20-25 °C) in the server room. There are primarily two aisles inside the server room, a hot aisle and a cold aisle. |
| Cold Aisle | It is the aisle wherein the front of the rack faces the aisle. Here, chilled air is directed into the aisle so that it can enter the front of the racks and maintain the temperature. |
| Hot Aisle | It is the aisle where the back of the racks faces the aisle. Here, the heat dissipated from the equipment’s in the rack is directed to the outlet vent of the CRAC. |
| Critical Load | It includes the servers and other computer equipment whose uptime is critical for data center operation. |
| Power Usage Effectiveness (PUE) | It is a metric which defines the efficiency of a data center. It is calculated by: (𝑇𝑜𝑡𝑎𝑙 𝐷𝑎𝑡𝑎 𝐶𝑒𝑛𝑡𝑒𝑟 𝐸𝑛𝑒𝑟𝑔𝑦 𝐶𝑜𝑛𝑠𝑢𝑚𝑝𝑡𝑖𝑜𝑛)/(𝑇𝑜𝑡𝑎𝑙 𝐼𝑇 𝐸𝑞𝑢𝑖𝑝𝑚𝑒𝑛𝑡 𝐸𝑛𝑒𝑟𝑔𝑦 𝐶𝑜𝑛𝑠𝑢𝑚𝑝𝑡𝑖𝑜𝑛). Further, a data center with a PUE of 1.2-1.5 is considered highly efficient, whereas, a data center with a PUE >2 is considered highly inefficient. |
| Redundancy | It is defined as a system design wherein additional component (UPS, generators, CRAC) is added so that in case of power outage, equipment failure, the IT equipment should not be affected. |
| Uninterruptible Power Supply (UPS) | It is a device that is connected in series with the utility power supply, storing energy in batteries such that the supply from UPS is continuous to IT equipment even during utility power is snapped. The UPS primarily supports the IT equipment only. |
| Generators | Just like UPS, generators are placed in the data center to ensure an uninterrupted power supply, avoiding downtime. Data center facilities have diesel generators and commonly, 48-hour diesel is stored in the facility to prevent disruption. |
| N | It denotes the tools and equipment required for a data center to function at full load. Only "N" indicates that there is no backup to the equipment in the event of any failure. |
| N+1 | Referred to as 'Need plus one', it denotes the additional equipment setup available to avoid downtime in case of failure. A data center is considered N+1 when there is one additional unit for every 4 components. For instance, if a data center has 4 UPS systems, then for to achieve N+1, an additional UPS system would be required. |
| 2N | It refers to fully redundant design wherein two independent power distribution system is deployed. Therefore, in the event of a complete failure of one distribution system, the other system will still supply power to the data center. |
| In-Row Cooling | It is the cooling design system installed between racks in a row where it draws warm air from the hot aisle and supplies cool air to the cold aisle, thereby maintaining the temperature. |
| Tier 1 | Tier classification determines the preparedness of a data center facility to sustain data center operation. A data center is classified as Tier 1 data center when it has a non-redundant (N) power component (UPS, generators), cooling components, and power distribution system (from utility power grids). The Tier 1 data center has an uptime of 99.67% and an annual downtime of <28.8 hours. |
| Tier 2 | A data center is classified as Tier 2 data center when it has a redundant power and cooling components (N+1) and a single non-redundant distribution system. Redundant components include extra generators, UPS, chillers, heat rejection equipment, and fuel tanks. The Tier 2 data center has an uptime of 99.74% and an annual downtime of <22 hours. |
| Tier 3 | A data center having redundant power and cooling components and multiple power distribution systems is referred to as a Tier 3 data center. The facility is resistant to planned (facility maintenance) and unplanned (power outage, cooling failure) disruption. The Tier 3 data center has an uptime of 99.98% and an annual downtime of <1.6 hours. |
| Tier 4 | It is the most tolerant type of data center. A Tier 4 data center has multiple, independent redundant power and cooling components and multiple power distribution paths. All IT equipment are dual powered, making them fault tolerant in case of any disruption, thereby ensuring interrupted operation. The Tier 4 data center has an uptime of 99.74% and an annual downtime of <26.3 minutes. |
| Small Data Center | Data center that has floor space area of ≤ 5,000 Sq. ft or the number of racks that can be installed is ≤ 200 is classified as a small data center. |
| Medium Data Center | Data center which has floor space area between 5,001-20,000 Sq. ft, or the number of racks that can be installed is between 201-800, is classified as a medium data center. |
| Large Data Center | Data center which has floor space area between 20,001-75,000 Sq. ft, or the number of racks that can be installed is between 801-3,000, is classified as a large data center. |
| Massive Data Center | Data center which has floor space area between 75,001-225,000 Sq. ft, or the number of racks that can be installed is between 3001-9,000, is classified as a massive data center. |
| Mega Data Center | Data center that has a floor space area of ≥ 225,001 Sq. ft or the number of racks that can be installed is ≥ 9001 is classified as a mega data center. |
| Retail Colocation | It refers to those customers who have a capacity requirement of 250 kW or less. These services are majorly opted by small and medium enterprises (SMEs). |
| Wholesale Colocation | It refers to those customers who have a capacity requirement between 250 kW to 4 MW. These services are majorly opted by medium to large enterprises. |
| Hyperscale Colocation | It refers to those customers who have a capacity requirement greater than 4 MW. The hyperscale demand primarily originates from large-scale cloud players, IT companies, BFSI, and OTT players (like Netflix, Hulu, and HBO+). |
| Mobile Data Speed | It is the mobile internet speed a user experiences via their smartphones. This speed is primarily dependent on the carrier technology being used in the smartphone. The carrier technologies available in the market are 2G, 3G, 4G, and 5G, where 2G provides the slowest speed while 5G is the fastest. |
| Fiber Connectivity Network | It is a network of optical fiber cables deployed across the country, connecting rural and urban regions with high-speed internet connection. It is measured in kilometer (km). |
| Data Traffic per Smartphone | It is a measure of average data consumption by a smartphone user in a month. It is measured in gigabyte (GB). |
| Broadband Data Speed | It is the internet speed that is supplied over the fixed cable connection. Commonly, copper cable and optic fiber cable are used in both residential and commercial use. Here, optic cable fiber provides faster internet speed than copper cable. |
| Submarine Cable | A submarine cable is a fiber optic cable laid down at two or more landing points. Through this cable, communication and internet connectivity between countries across the globe is established. These cables can transmit 100-200 terabits per second (Tbps) from one point to another. |
| Carbon Footprint | It is the measure of carbon dioxide generated during the regular operation of a data center. Since, coal, and oil & gas are the primary source of power generation, consumption of this power contributes to carbon emissions. Data center operators are incorporating renewable energy sources to curb the carbon footprint emerging in their facilities. |
Need More Details on Market Definition?
Ask a Question
Research Methodology
Mordor Intelligence follows a four-step methodology in all our reports.
- Step-1: Identify Key Variables: In order to build a robust forecasting methodology, the variables and factors identified in Step-1 are tested against available historical market numbers. Through an iterative process, the variables required for market forecast are set and the model is built on the basis of these variables.
- Step-2: Build a Market Model: Market-size estimations for the forecast years are in nominal terms. Inflation is not a part of the pricing, and the average selling price (ASP) is kept constant throughout the forecast period for each country.
- Step-3: Validate and Finalize: In this important step, all market numbers, variables and analyst calls are validated through an extensive network of primary research experts from the market studied. The respondents are selected across levels and functions to generate a holistic picture of the market studied.
- Step-4: Research Outputs: Syndicated Reports, Custom Consulting Assignments, Databases & Subscription Platforms

Get More Details On Research Methodology
Download PDF


