| Study Period | 2017 - 2030 |
| Base Year For Estimation | 2024 |
| Forecast Data Period | 2025 - 2030 |
| Market Size (2025) | USD 3.05 Billion |
| Market Size (2030) | USD 3.64 Billion |
| CAGR (2025 - 2030) | 3.63 % |
| Market Concentration | High |
Major Players*Disclaimer: Major Players sorted in no particular order |

Nematicide Market Analysis
The Nematicide Market size is estimated at 3.05 billion USD in 2025, and is expected to reach 3.64 billion USD by 2030, growing at a CAGR of 3.63% during the forecast period (2025-2030).
The agricultural sector faces mounting challenges from plant parasitic nematodes, with over 4,100 species identified globally causing significant crop damage. These microscopic pests have become increasingly problematic due to changing climate conditions, including drought, heat waves, and humid environments that favor their proliferation. Modern farming practices such as monoculture cultivation and no-tillage methods have further exacerbated the situation by creating optimal conditions for nematode infestations. According to recent industry assessments, nematodes are responsible for approximately 14% of global crop losses annually, translating to an estimated economic impact of USD 125 billion, highlighting the critical need for effective nematicide management solutions.
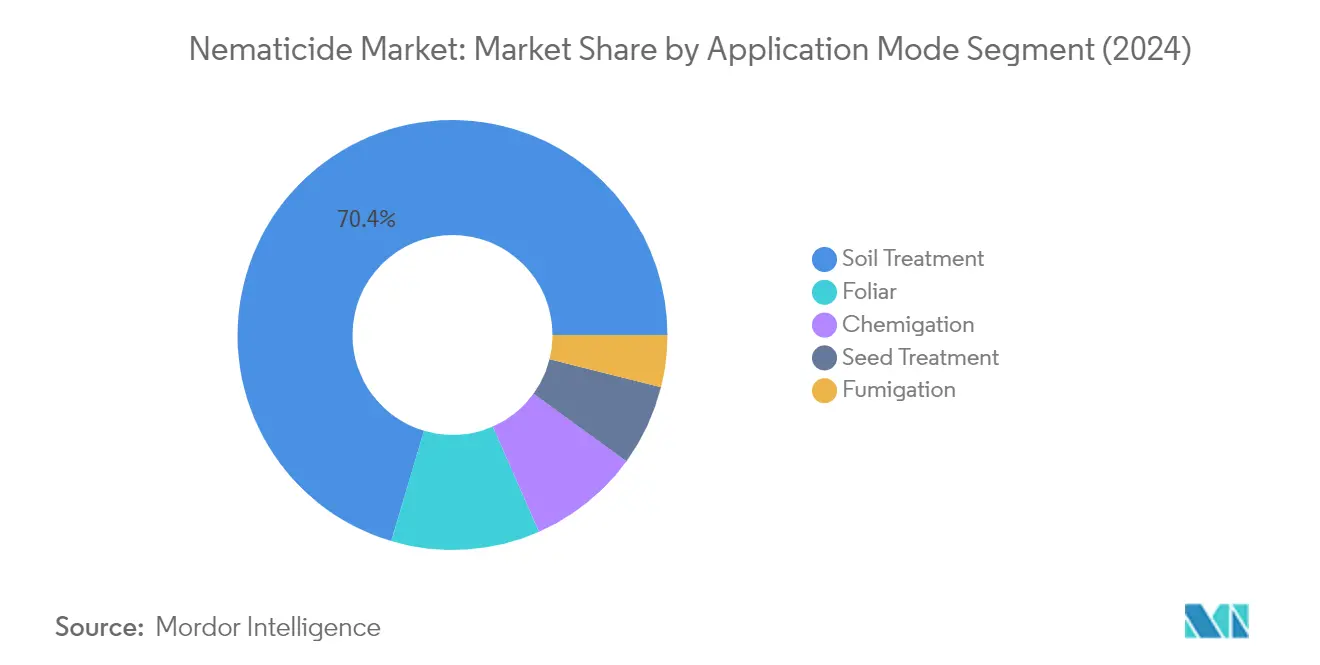
The nematicides industry has witnessed significant advancements in application technologies and methods for nematicide deployment. Soil treatment has emerged as the predominant application method, accounting for 70.3% of total applications in 2022, owing to its effectiveness in reducing soil-borne nematode populations and improving crop productivity. This method's popularity stems from its versatility in both pre-planting and post-planting applications through soil drenching, facilitating faster crop germination. Additionally, chemigation has gained traction, representing 8.5% of applications in 2022, as it enables precise management of water and nematicides quantities through advanced irrigation systems.
Technological innovation continues to reshape the nematicides market, particularly in the realm of foliar application methods. The integration of drone technology for precision application represents a significant advancement in the sector, enabling more targeted and efficient treatment of affected areas. Digital monitoring systems and smart agriculture practices are increasingly being adopted to optimize nematicide application timing and dosage, reducing waste and improving overall effectiveness. These technological developments are complemented by the emergence of new formulation technologies that enhance product efficacy while minimizing environmental impact.
The industry is experiencing a shift toward integrated pest management approaches that combine chemical nematicides with biological controls and cultural practices. This trend is driven by growing awareness of sustainable agriculture practices and the need to address resistance development in nematode populations. Root-knot nematodes, cyst nematodes, and root-lesion nematodes remain the primary targets for control measures, with various species affecting different crops and regions. The development of species-specific treatment protocols and resistance management strategies has become a key focus area for industry stakeholders, leading to more sophisticated and targeted solutions for nematode control.
Global Nematicide Market Trends
Intensive agricultural practices have increased the need for nematicide application
- The average global consumption of chemical nematicides was 2.1 kg per hectare of agricultural land in 2022. Asia-Pacific was the largest consumer of nematicides, with a per-hectare consumption of 737.02 grams in 2022. Asian countries, including Japan, commonly adopt intensive farming practices like greenhouse cultivation and monocropping. Although these methods enhance productivity, they also heighten crop vulnerability to soil-borne pests like nematodes. Consequently, farmers frequently resort to nematicides to protect their crops.
- Europe was the second largest per-hectare consumer of nematicides, with 591.7 grams per hectare in 2022. European countries are expanding the cultivation of high-value crops, including vegetables, fruits, and ornamentals, which tend to be more susceptible to nematode damage. The plant-parasitic nematodes cause an annual yield loss of 21.3%, amounting to USD 1.58 billion in European countries. As a result, the use of nematicides becomes necessary to effectively manage and control these infestations in Europe.
- South America was the third largest per-hectare consumer of nematicides, with 570.14 grams per hectare in 2022. Root-knot nematodes attack the roots and tubers of various plants, including tomatoes, potatoes, and carrots in the region. Carrots are susceptible to considerable losses, averaging up to 20.0%, while potatoes can experience even higher losses of up to 33.0% due to infestations caused by these nematode species. The nematode population in North American countries is increasing with the increasing adoption of no-tillage practices, which reduce soil disturbance and increase the retention of crop residue. These circumstances are leading to the application of nematicides globally.

Understand The Key Trends Shaping This Market
Download PDF
Changing climatic conditions and their effect on nematode infestations may raise the demand for nematicides and their prices simultaneously
- Nematicides play a crucial role in agriculture by effectively controlling plant-parasitic nematodes, protecting crops from root damage, and ensuring optimal yield and productivity.
- Flufensulfone is a nematicide belonging to the chemical class of arylsulfonates. It is used to control plant-parasitic nematodes, such as root-knot nematodes, cyst nematodes, lesion nematodes, and dagger nematodes in various agricultural crops. The mode of action of flufensulfone involves interfering with the nervous systems of nematodes, leading to paralysis and death. By targeting nematodes, flufensulfone helps reduce their populations and minimize the damage they can cause to crops. Flufensulfone was priced at USD 19.0 thousand metric ton in 2022.
- Abamectin is known for its nematocidal activity against several plant-parasitic nematodes, including the root lesion nematode (Pratylenchus penetrans), the reniform nematode (Rotylenchus reniformis), the root-knot nematode (Meloidogyne incognita), and the cyst nematodes (Heterodera schachtii). Its efficacy in controlling these nematodes makes it a valuable tool for nematode management in agricultural crops. As of 2022, the market value of abamectin was approximately USD 12.2 thousand per metric ton.
- Oxamyl is a widely used insecticide and nematicide belonging to the chemical class of carbamates. It is primarily used to control a variety of plant-parasitic nematodes in agricultural crops. Oxamyl's mode of action as an insecticide and nematicide involves inhibiting the activity of acetylcholinesterase, an enzyme essential for nerve function in insects and nematodes. By disrupting this enzyme, oxamyl causes nerve overstimulation, leading to paralysis and eventual death of the pests. It was priced at USD 8.8 thousand per metric ton in 2022.

Segment Analysis: Application Mode
Soil Treatment Segment in Nematicide Market
The soil treatment segment dominates the global nematicide market, accounting for approximately 70% of the total market value in 2024. This significant market share is primarily attributed to the method's effectiveness in directly applying nematicides to the soil, where they can remain for extended periods. This prolonged presence allows the chemical to effectively reach the plant's root systems and target soil-borne nematodes. Soil treatment enables nematicides to be concentrated in the soil where the targeted nematodes primarily reside, presenting fewer risks of exposing non-target organisms, including beneficial insects and pollinators, compared to other application methods. The segment's dominance is further strengthened by its preventive action capability, as it can inhibit nematode activity and reproduction before they cause significant damage to plants.
Seed Treatment Segment in Nematicide Market
The seed treatment segment is projected to witness substantial growth in the nematicide market during 2024-2029, with an estimated CAGR of around 4%. This growth trajectory is driven by several factors, including the increasing incidence of nematode infestations causing severe crop losses and growing knowledge among farmers about various alternatives to overcome yield losses. The segment's expansion is particularly notable in regions with strong infrastructure for agriculture and higher adoption rates of new technologies by farmers. The growth is further supported by improving regulatory environments and government initiatives promoting the adoption of seed treatment technologies across various regions. The segment's effectiveness in providing early-stage protection against nematodes, coupled with its precision application capabilities, makes it an increasingly preferred choice among farmers looking for efficient and sustainable nematode control solutions.
Remaining Segments in Application Mode
The nematicide market's application modes also include foliar application, chemigation, and fumigation, each serving specific needs in nematode control. Foliar application provides targeted control for above-ground nematode issues and offers flexibility in application timing. Chemigation combines water and nematicide application, ensuring uniform distribution while optimizing resource usage. Fumigation serves as a broad-spectrum solution, particularly effective in pre-planting scenarios. These application methods complement each other, offering farmers various options depending on their specific crop protection needs, soil conditions, and farming practices. The choice of application method often depends on factors such as crop type, nematode species, environmental conditions, and available farming infrastructure.
Segment Analysis: Crop Type
Grains & Cereals Segment in Global Nematicide Market
The Grains and Cereals segment dominates the global nematicide market, accounting for approximately 46% of the total market value in 2024. This significant market share is primarily attributed to the extensive cultivation areas and the critical role these crops play in global food security. Wheat, maize, rice, barley, rye, oats, millet, and other cereal crops are majorly grown across various regions and face substantial challenges from nematode infestations. Plant-parasitic nematodes, particularly root-knot nematodes, cyst nematodes, and root-lesion nematodes, pose significant threats to these crops, leading to increased adoption of nematicides. The segment's dominance is further reinforced by the growing global population and rising demand for cereal-based food products, necessitating effective crop protection measures.
Turf & Ornamental Segment in Global Nematicide Market
The Turf and Ornamental segment is projected to exhibit the fastest growth in the global nematicide market, with an estimated CAGR of approximately 4% during 2024-2029. This accelerated growth is driven by the increasing demand for high-quality turf in sports fields, golf courses, and landscaping applications, coupled with the growing ornamental horticulture industry. The segment's growth is further supported by rising urbanization and increasing investments in landscaping and recreational facilities. Various nematode species, including root-knot nematodes, lesion nematodes, and sting nematodes, significantly impact the aesthetic value and health of turf and ornamental plants, driving the demand for effective bio nematicides solutions.
Remaining Segments in Crop Type
The remaining segments in the bionematicides market include Pulses & Oilseeds, Fruits & Vegetables, and Commercial Crops, each serving distinct agricultural needs. The Pulses & Oilseeds segment maintains significant importance due to the increasing global demand for protein-rich foods and vegetable oils. The Fruits & Vegetables segment is crucial for high-value crops that require intensive protection against nematode infestations to maintain product quality and market value. The Commercial Crops segment, including crops like cotton, tobacco, and sugarcane, represents an important market for nematicides due to their economic significance and susceptibility to nematode damage.
Nematicide Market Geography Segment Analysis
Nematicide Market in Africa
The African agricultural sector faces significant challenges from nematode infestations across various crops. The region's diverse climate creates favorable conditions for nematode proliferation, affecting major crops including grains, fruits, vegetables, and other agricultural produce. Farmers across Africa are increasingly adopting various strategies for nematode management, with chemical nematicides becoming a crucial tool in crop protection. South Africa emerges as both the largest and fastest-growing nematicide market in the region, driven by the implementation of advanced agricultural practices and growing awareness about nematode control methods among farmers.
Nematicide Market in Asia-Pacific
The Asia-Pacific region demonstrates a strong presence in the global nematicide market, characterized by diverse agricultural practices and increasing awareness about crop protection. The region's substantial agricultural industry, with countries like China, India, Japan, and Australia being major contributors, faces significant challenges from nematode infestations. The adoption of intensive farming practices, particularly in greenhouse cultivation and monocropping, has led to increased vulnerability to nematode damage, driving the demand for effective nematicide control solutions.
Nematicide Market in China
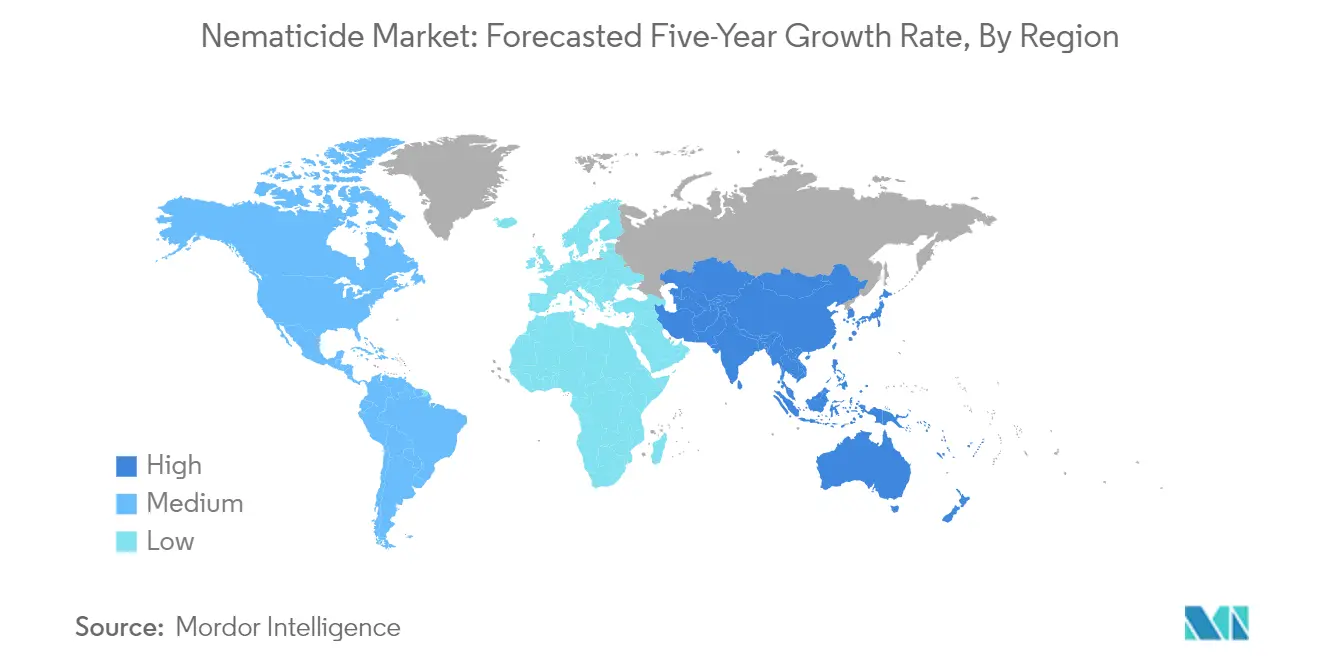
China dominates the Asia-Pacific nematicide market, holding approximately 33% market share in 2024. The country's agricultural sector faces significant challenges from various nematode species, particularly in rice and soybean cultivation. The adoption of monoculture practices and conservative agricultural approaches has intensified nematode-related issues, leading to increased demand for nematicide solutions. Chinese farmers have implemented various management strategies, including chemical nematicides, along with crop rotation and integrated pest management strategies.
Nematicide Market in Thailand
Thailand emerges as the fastest-growing market in the Asia-Pacific region, with a projected growth rate of approximately 5% during 2024-2029. The country's agricultural sector, particularly in rice cultivation, faces severe challenges from root-knot nematodes and other species. These nematodes affect over 80 species of economic field crops, vegetables, and fruits in Thailand. The severity of nematode infestations, coupled with increasing awareness among farmers about effective nematicide control measures, is driving the rapid growth of the nematicide market in the country.
Nematicide Market in Europe
The European nematicide market reflects a sophisticated approach to crop protection, supported by stringent regulatory frameworks and advanced agricultural practices. Countries across the region face varying challenges from nematode infestations, with particular concerns in high-value crops, including vegetables, fruits, and ornamentals. The market is characterized by increasing adoption of integrated pest management strategies and growing emphasis on sustainable agriculture practices.
Nematicide Market in France
France maintains its position as the largest nematicide market in Europe, commanding approximately 31% market share in 2024. The country's diverse agricultural sector, encompassing a wide range of crops from grains to high-value fruits and vegetables, faces significant challenges from nematode infestations. French farmers have adopted comprehensive approaches to nematode management, incorporating chemical nematicides as a crucial component of their crop protection strategies.
Nematicide Market in France - Growth Trajectory
France also leads the European region in terms of market growth, with a projected growth rate of approximately 5% during 2024-2029. The country's agricultural sector continues to evolve with increasing adoption of precision farming techniques and integrated pest management strategies. The growing awareness about nematode-related crop damage and the need for effective control measures drives this growth, particularly in regions with intensive agricultural practices.
Nematicide Market in North America
The North American nematicide market demonstrates advanced agricultural practices and sophisticated crop protection strategies. The region's agricultural sector faces significant challenges from various nematode species affecting major commodities like grains, fruits, vegetables, and specialty crops. The market is characterized by high adoption rates of innovative agricultural technologies and growing awareness about effective nematode management strategies.
Nematicide Market in United States
The United States dominates the North American nematicide market, holding approximately 84% market share in 2024. The country's extensive agricultural operations face significant challenges from various nematode species, including root-knot nematodes, cyst nematodes, and lesion nematodes. American farmers have adopted comprehensive approaches to nematode management, incorporating advanced technologies and integrated pest management strategies to protect their crops.
Nematicide Market in Mexico
Mexico emerges as the fastest-growing market in North America, with a projected growth rate of approximately 5% during 2024-2029. The country's agricultural sector faces challenges from various nematode species, including lesion nematodes, stem and bulb nematodes, and root-knot nematodes. Mexican farmers, particularly those focused on export-oriented agriculture, are increasingly adopting effective nematicide management strategies to meet international market standards and protect their high-value crops.
Nematicide Market in South America
The South American nematicide market plays a crucial role in protecting the region's extensive agricultural operations. The region faces significant challenges from various nematode species, particularly in soybean, corn, and other major crop productions. Brazil emerges as the largest market in the region, driven by its extensive agricultural operations and the need to protect major crops from nematode infestations. Argentina demonstrates the fastest growth potential, supported by its expanding agricultural sector and increasing adoption of advanced crop protection strategies. The region's warm climate and intensive farming practices create conditions that favor nematode proliferation, making effective control measures essential for maintaining agricultural productivity.
Get Analysis on Important Geographic Markets
Download PDF
Nematicide Industry Overview
Top Companies in Nematicide Market
The global nematicide market is characterized by continuous product innovation and strategic expansion initiatives by leading players. Companies are heavily investing in research and development to create novel nematicide formulations that offer improved efficacy while meeting environmental sustainability requirements. Operational agility is demonstrated through the establishment of regional manufacturing facilities and distribution networks to better serve local agricultural needs. Strategic moves predominantly involve partnerships with agricultural technology firms and local distributors to enhance market reach and product accessibility. Companies are also focusing on expanding their presence through acquisitions of regional players and establishing research centers in key agricultural markets to develop region-specific solutions. These consolidated efforts reflect the industry's commitment to addressing evolving farmer needs while maintaining competitive advantages in the market.
Consolidated Market Led By Global Players
The nematicides market exhibits a high level of consolidation with dominance by global agricultural chemical conglomerates that possess extensive research capabilities and established distribution networks. These major players leverage their broad product portfolios, technical expertise, and strong financial resources to maintain their market positions. The market structure favors established players due to high barriers to entry, including significant investments required for product development, regulatory compliance, and building distribution networks. Local players typically operate in specific regional markets where they maintain competitive advantages through strong farmer relationships and understanding of local agricultural conditions.
Merger and acquisition activities in the nematicide market are primarily driven by the need to expand geographical presence and enhance product portfolios. Large agrochemical companies are particularly active in acquiring smaller, specialized firms that possess innovative technologies or a strong regional presence. These strategic acquisitions help companies strengthen their market position while gaining access to new technologies and regional markets. The industry also witnesses strategic partnerships between manufacturers and distribution companies to improve market penetration and provide better service to end-users.
Innovation and Distribution Key to Growth
Success in the nematicides market increasingly depends on companies' ability to develop innovative, environmentally sustainable products while maintaining strong distribution networks. Incumbent players must focus on continuous product innovation, particularly in developing bio-based alternatives and integrated pest management solutions to address growing environmental concerns. Building strong relationships with agricultural input distributors and providing comprehensive technical support to farmers are crucial for maintaining market share. Companies must also invest in digital agriculture solutions and precision application technologies to differentiate their offerings and provide value-added services to farmers.
For contenders looking to gain market share, focusing on niche markets and developing specialized solutions for specific crops or regions presents significant opportunities. Success factors include building a strong local presence through partnerships with agricultural cooperatives and distributors, investing in region-specific product development, and providing extensive farmer education programs. Companies must also navigate increasingly stringent regulatory requirements, particularly regarding environmental impact and residue limits. The ability to adapt to evolving regulatory landscapes while maintaining product efficacy will be crucial for long-term success in the market.
Nematicide Market Leaders
-
ADAMA Agricultural Solutions Ltd.
-
Bayer AG
-
Corteva Agriscience
-
Syngenta Group
-
Upl Limited
- *Disclaimer: Major Players sorted in no particular order

Need More Details on Market Players and Competitors?
Download PDF
Nematicide Market News
- January 2023: Bayer formed a new partnership with Oerth Bio to enhance crop protection technology and create more eco-friendly crop protection solutions.
- June 2022: AgriNova New Zealand Ltd was acquired by ADAMA Ltd. With this acquisition, ADAMA expanded its product line in the New Zealand market.
- May 2022: Corteva Agriscience in Brazil expanded its portfolio, services, and industrial infrastructure to commercial partners to strengthen its activities in the seed treatment industry. For instance, the company strengthened its operations in the area of seed treatment with the new global brands LumiGEN and Ampl.
Free With This Report
Along with the report, We also offer a comprehensive and exhaustive data pack with 50+ graphs on insecticide, fungicides, and herbicides consumption per hectare and the average price of active ingredients used in insecticides, fungicides, herbicides, nematicides, and molluscicides. The data pack includes Globe, North America, Europe, Asia-Pacific, South America, and Africa.


Nematicide Market Report - Table of Contents
1. EXECUTIVE SUMMARY & KEY FINDINGS
2. REPORT OFFERS
3. INTRODUCTION
- 3.1 Study Assumptions & Market Definition
- 3.2 Scope of the Study
- 3.3 Research Methodology
4. KEY INDUSTRY TRENDS
- 4.1 Consumption Of Pesticide Per Hectare
- 4.2 Pricing Analysis For Active Ingredients
-
4.3 Regulatory Framework
- 4.3.1 Australia
- 4.3.2 Canada
- 4.3.3 China
- 4.3.4 France
- 4.3.5 Germany
- 4.3.6 India
- 4.3.7 Indonesia
- 4.3.8 Italy
- 4.3.9 Japan
- 4.3.10 Mexico
- 4.3.11 Myanmar
- 4.3.12 Netherlands
- 4.3.13 Pakistan
- 4.3.14 Philippines
- 4.3.15 Russia
- 4.3.16 South Africa
- 4.3.17 Spain
- 4.3.18 Thailand
- 4.3.19 Ukraine
- 4.3.20 United Kingdom
- 4.3.21 United States
- 4.3.22 Vietnam
- 4.4 Value Chain & Distribution Channel Analysis
5. MARKET SEGMENTATION (includes market size in Value in USD and Volume, Forecasts up to 2030 and analysis of growth prospects)
-
5.1 Application Mode
- 5.1.1 Chemigation
- 5.1.2 Foliar
- 5.1.3 Fumigation
- 5.1.4 Seed Treatment
- 5.1.5 Soil Treatment
-
5.2 Crop Type
- 5.2.1 Commercial Crops
- 5.2.2 Fruits & Vegetables
- 5.2.3 Grains & Cereals
- 5.2.4 Pulses & Oilseeds
- 5.2.5 Turf & Ornamental
-
5.3 Region
- 5.3.1 Africa
- 5.3.1.1 By Country
- 5.3.1.1.1 South Africa
- 5.3.1.1.2 Rest of Africa
- 5.3.2 Asia-Pacific
- 5.3.2.1 By Country
- 5.3.2.1.1 Australia
- 5.3.2.1.2 China
- 5.3.2.1.3 India
- 5.3.2.1.4 Indonesia
- 5.3.2.1.5 Japan
- 5.3.2.1.6 Myanmar
- 5.3.2.1.7 Pakistan
- 5.3.2.1.8 Philippines
- 5.3.2.1.9 Thailand
- 5.3.2.1.10 Vietnam
- 5.3.2.1.11 Rest of Asia-Pacific
- 5.3.3 Europe
- 5.3.3.1 By Country
- 5.3.3.1.1 France
- 5.3.3.1.2 Germany
- 5.3.3.1.3 Italy
- 5.3.3.1.4 Netherlands
- 5.3.3.1.5 Russia
- 5.3.3.1.6 Spain
- 5.3.3.1.7 Ukraine
- 5.3.3.1.8 United Kingdom
- 5.3.3.1.9 Rest of Europe
- 5.3.4 North America
- 5.3.4.1 By Country
- 5.3.4.1.1 Canada
- 5.3.4.1.2 Mexico
- 5.3.4.1.3 United States
- 5.3.4.1.4 Rest of North America
- 5.3.5 South America
- 5.3.5.1 By Country
- 5.3.5.1.1 Argentina
- 5.3.5.1.2 Brazil
- 5.3.5.1.3 Chile
- 5.3.5.1.4 Rest of South America
6. COMPETITIVE LANDSCAPE
- 6.1 Key Strategic Moves
- 6.2 Market Share Analysis
- 6.3 Company Landscape
-
6.4 Company Profiles (includes Global level Overview, Market level overview, Core Business Segments, Financials, Headcount, Key Information, Market Rank, Market Share, Products and Services, and analysis of Recent Developments)
- 6.4.1 ADAMA Agricultural Solutions Ltd.
- 6.4.2 Albaugh LLC
- 6.4.3 American Vanguard Corporation
- 6.4.4 Bayer AG
- 6.4.5 Corteva Agriscience
- 6.4.6 Syngenta Group
- 6.4.7 Tessenderlo Kerley Inc. (Novasource)
- 6.4.8 Upl Limited
- 6.4.9 Vive Crop Protection
7. KEY STRATEGIC QUESTIONS FOR CROP PROTECTION CHEMICALS CEOS
8. APPENDIX
-
8.1 Global Overview
- 8.1.1 Overview
- 8.1.2 Porter’s Five Forces Framework
- 8.1.3 Global Value Chain Analysis
- 8.1.4 Market Dynamics (DROs)
- 8.2 Sources & References
- 8.3 List of Tables & Figures
- 8.4 Primary Insights
- 8.5 Data Pack
- 8.6 Glossary of Terms
You Can Purchase Parts Of This Report. Check Out Prices For Specific Sections
Get Price Break-up Now
List of Tables & Figures
- Figure 1:
- NEMATICIDE CONSUMPTION PER HECTARE, GRAMS, GLOBAL, 2017 - 2022
- Figure 2:
- ACTIVE INGREDIENT PRICE PER METRIC TON, USD, GLOBAL, 2017 - 2022
- Figure 3:
- NEMATICIDE VOLUME METRIC TON, GLOBAL, 2017 - 2029
- Figure 4:
- NEMATICIDE VALUE USD, GLOBAL, 2017 - 2029
- Figure 5:
- NEMATICIDE MARKET BY APPLICATION MODE, METRIC TON, GLOBAL, 2017 - 2029
- Figure 6:
- NEMATICIDE MARKET BY APPLICATION MODE, USD, GLOBAL, 2017 - 2029
- Figure 7:
- VALUE SHARE OF NEMATICIDE BY APPLICATION MODE, %, GLOBAL, 2017 VS 2023 VS 2029
- Figure 8:
- VOLUME SHARE OF NEMATICIDE BY APPLICATION MODE, %, GLOBAL, 2017 VS 2023 VS 2029
- Figure 9:
- CROP PROTECTION CHEMICALS APPLIED THROUGH CHEMIGATION, METRIC TON, GLOBAL, 2017 - 2029
- Figure 10:
- CROP PROTECTION CHEMICALS APPLIED THROUGH CHEMIGATION, USD, GLOBAL, 2017 - 2029
- Figure 11:
- VALUE SHARE OF CHEMIGATION BY CROP TYPE, %, GLOBAL, 2022 VS 2029
- Figure 12:
- CROP PROTECTION CHEMICALS APPLIED THROUGH FOLIAR, METRIC TON, GLOBAL, 2017 - 2029
- Figure 13:
- CROP PROTECTION CHEMICALS APPLIED THROUGH FOLIAR, USD, GLOBAL, 2017 - 2029
- Figure 14:
- VALUE SHARE OF FOLIAR BY CROP TYPE, %, GLOBAL, 2022 VS 2029
- Figure 15:
- CROP PROTECTION CHEMICALS APPLIED THROUGH FUMIGATION, METRIC TON, GLOBAL, 2017 - 2029
- Figure 16:
- CROP PROTECTION CHEMICALS APPLIED THROUGH FUMIGATION, USD, GLOBAL, 2017 - 2029
- Figure 17:
- VALUE SHARE OF FUMIGATION BY CROP TYPE, %, GLOBAL, 2022 VS 2029
- Figure 18:
- CROP PROTECTION CHEMICALS APPLIED THROUGH SEED TREATMENT, METRIC TON, GLOBAL, 2017 - 2029
- Figure 19:
- CROP PROTECTION CHEMICALS APPLIED THROUGH SEED TREATMENT, USD, GLOBAL, 2017 - 2029
- Figure 20:
- VALUE SHARE OF SEED TREATMENT BY CROP TYPE, %, GLOBAL, 2022 VS 2029
- Figure 21:
- CROP PROTECTION CHEMICALS APPLIED THROUGH SOIL TREATMENT, METRIC TON, GLOBAL, 2017 - 2029
- Figure 22:
- CROP PROTECTION CHEMICALS APPLIED THROUGH SOIL TREATMENT, USD, GLOBAL, 2017 - 2029
- Figure 23:
- VALUE SHARE OF SOIL TREATMENT BY CROP TYPE, %, GLOBAL, 2022 VS 2029
- Figure 24:
- NEMATICIDE MARKET BY CROP TYPE, METRIC TON, GLOBAL, 2017 - 2029
- Figure 25:
- NEMATICIDE MARKET BY CROP TYPE, USD, GLOBAL, 2017 - 2029
- Figure 26:
- VALUE SHARE OF NEMATICIDE BY CROP TYPE, %, GLOBAL, 2017 VS 2023 VS 2029
- Figure 27:
- VOLUME SHARE OF NEMATICIDE BY CROP TYPE, %, GLOBAL, 2017 VS 2023 VS 2029
- Figure 28:
- NEMATICIDE CONSUMED BY COMMERCIAL CROPS, METRIC TON, GLOBAL, 2017 - 2029
- Figure 29:
- NEMATICIDE CONSUMED BY COMMERCIAL CROPS, USD, GLOBAL, 2017 - 2029
- Figure 30:
- VALUE SHARE OF COMMERCIAL CROPS BY APPLICATION MODE, %, GLOBAL, 2022 VS 2029
- Figure 31:
- NEMATICIDE CONSUMED BY FRUITS & VEGETABLES, METRIC TON, GLOBAL, 2017 - 2029
- Figure 32:
- NEMATICIDE CONSUMED BY FRUITS & VEGETABLES, USD, GLOBAL, 2017 - 2029
- Figure 33:
- VALUE SHARE OF FRUITS & VEGETABLES BY APPLICATION MODE, %, GLOBAL, 2022 VS 2029
- Figure 34:
- NEMATICIDE CONSUMED BY GRAINS & CEREALS, METRIC TON, GLOBAL, 2017 - 2029
- Figure 35:
- NEMATICIDE CONSUMED BY GRAINS & CEREALS, USD, GLOBAL, 2017 - 2029
- Figure 36:
- VALUE SHARE OF GRAINS & CEREALS BY APPLICATION MODE, %, GLOBAL, 2022 VS 2029
- Figure 37:
- NEMATICIDE CONSUMED BY PULSES & OILSEEDS, METRIC TON, GLOBAL, 2017 - 2029
- Figure 38:
- NEMATICIDE CONSUMED BY PULSES & OILSEEDS, USD, GLOBAL, 2017 - 2029
- Figure 39:
- VALUE SHARE OF PULSES & OILSEEDS BY APPLICATION MODE, %, GLOBAL, 2022 VS 2029
- Figure 40:
- NEMATICIDE CONSUMED BY TURF & ORNAMENTAL, METRIC TON, GLOBAL, 2017 - 2029
- Figure 41:
- NEMATICIDE CONSUMED BY TURF & ORNAMENTAL, USD, GLOBAL, 2017 - 2029
- Figure 42:
- VALUE SHARE OF TURF & ORNAMENTAL BY APPLICATION MODE, %, GLOBAL, 2022 VS 2029
- Figure 43:
- NEMATICIDE MARKET BY REGION, METRIC TON, GLOBAL, 2017 - 2029
- Figure 44:
- NEMATICIDE MARKET BY REGION, USD, GLOBAL, 2017 - 2029
- Figure 45:
- VALUE SHARE OF NEMATICIDE BY REGION, %, GLOBAL, 2017 VS 2023 VS 2029
- Figure 46:
- VOLUME SHARE OF NEMATICIDE BY REGION, %, GLOBAL, 2017 VS 2023 VS 2029
- Figure 47:
- NEMATICIDE MARKET BY COUNTRY, METRIC TON, GLOBAL, 2017 - 2029
- Figure 48:
- NEMATICIDE MARKET BY COUNTRY, USD, GLOBAL, 2017 - 2029
- Figure 49:
- VALUE SHARE OF NEMATICIDE BY COUNTRY, %, GLOBAL, 2017 VS 2023 VS 2029
- Figure 50:
- VOLUME SHARE OF NEMATICIDE BY COUNTRY, %, GLOBAL, 2017 VS 2023 VS 2029
- Figure 51:
- NEMATICIDE CONSUMED BY SOUTH AFRICA, METRIC TON, GLOBAL, 2017 - 2029
- Figure 52:
- NEMATICIDE CONSUMED BY SOUTH AFRICA, USD, GLOBAL, 2017 - 2029
- Figure 53:
- VALUE SHARE OF SOUTH AFRICA BY CROP TYPE, %, GLOBAL, 2022 VS 2029
- Figure 54:
- NEMATICIDE CONSUMED BY REST OF AFRICA, METRIC TON, GLOBAL, 2017 - 2029
- Figure 55:
- NEMATICIDE CONSUMED BY REST OF AFRICA, USD, GLOBAL, 2017 - 2029
- Figure 56:
- VALUE SHARE OF REST OF AFRICA BY CROP TYPE, %, GLOBAL, 2022 VS 2029
- Figure 57:
- NEMATICIDE MARKET BY COUNTRY, METRIC TON, GLOBAL, 2017 - 2029
- Figure 58:
- NEMATICIDE MARKET BY COUNTRY, USD, GLOBAL, 2017 - 2029
- Figure 59:
- VALUE SHARE OF NEMATICIDE BY COUNTRY, %, GLOBAL, 2017 VS 2023 VS 2029
- Figure 60:
- VOLUME SHARE OF NEMATICIDE BY COUNTRY, %, GLOBAL, 2017 VS 2023 VS 2029
- Figure 61:
- NEMATICIDE CONSUMED BY AUSTRALIA, METRIC TON, GLOBAL, 2017 - 2029
- Figure 62:
- NEMATICIDE CONSUMED BY AUSTRALIA, USD, GLOBAL, 2017 - 2029
- Figure 63:
- VALUE SHARE OF AUSTRALIA BY CROP TYPE, %, GLOBAL, 2022 VS 2029
- Figure 64:
- NEMATICIDE CONSUMED BY CHINA, METRIC TON, GLOBAL, 2017 - 2029
- Figure 65:
- NEMATICIDE CONSUMED BY CHINA, USD, GLOBAL, 2017 - 2029
- Figure 66:
- VALUE SHARE OF CHINA BY CROP TYPE, %, GLOBAL, 2022 VS 2029
- Figure 67:
- NEMATICIDE CONSUMED BY INDIA, METRIC TON, GLOBAL, 2017 - 2029
- Figure 68:
- NEMATICIDE CONSUMED BY INDIA, USD, GLOBAL, 2017 - 2029
- Figure 69:
- VALUE SHARE OF INDIA BY CROP TYPE, %, GLOBAL, 2022 VS 2029
- Figure 70:
- NEMATICIDE CONSUMED BY INDONESIA, METRIC TON, GLOBAL, 2017 - 2029
- Figure 71:
- NEMATICIDE CONSUMED BY INDONESIA, USD, GLOBAL, 2017 - 2029
- Figure 72:
- VALUE SHARE OF INDONESIA BY CROP TYPE, %, GLOBAL, 2022 VS 2029
- Figure 73:
- NEMATICIDE CONSUMED BY JAPAN, METRIC TON, GLOBAL, 2017 - 2029
- Figure 74:
- NEMATICIDE CONSUMED BY JAPAN, USD, GLOBAL, 2017 - 2029
- Figure 75:
- VALUE SHARE OF JAPAN BY CROP TYPE, %, GLOBAL, 2022 VS 2029
- Figure 76:
- NEMATICIDE CONSUMED BY MYANMAR, METRIC TON, GLOBAL, 2017 - 2029
- Figure 77:
- NEMATICIDE CONSUMED BY MYANMAR, USD, GLOBAL, 2017 - 2029
- Figure 78:
- VALUE SHARE OF MYANMAR BY CROP TYPE, %, GLOBAL, 2022 VS 2029
- Figure 79:
- NEMATICIDE CONSUMED BY PAKISTAN, METRIC TON, GLOBAL, 2017 - 2029
- Figure 80:
- NEMATICIDE CONSUMED BY PAKISTAN, USD, GLOBAL, 2017 - 2029
- Figure 81:
- VALUE SHARE OF PAKISTAN BY CROP TYPE, %, GLOBAL, 2022 VS 2029
- Figure 82:
- NEMATICIDE CONSUMED BY PHILIPPINES, METRIC TON, GLOBAL, 2017 - 2029
- Figure 83:
- NEMATICIDE CONSUMED BY PHILIPPINES, USD, GLOBAL, 2017 - 2029
- Figure 84:
- VALUE SHARE OF PHILIPPINES BY CROP TYPE, %, GLOBAL, 2022 VS 2029
- Figure 85:
- NEMATICIDE CONSUMED BY THAILAND, METRIC TON, GLOBAL, 2017 - 2029
- Figure 86:
- NEMATICIDE CONSUMED BY THAILAND, USD, GLOBAL, 2017 - 2029
- Figure 87:
- VALUE SHARE OF THAILAND BY CROP TYPE, %, GLOBAL, 2022 VS 2029
- Figure 88:
- NEMATICIDE CONSUMED BY VIETNAM, METRIC TON, GLOBAL, 2017 - 2029
- Figure 89:
- NEMATICIDE CONSUMED BY VIETNAM, USD, GLOBAL, 2017 - 2029
- Figure 90:
- VALUE SHARE OF VIETNAM BY CROP TYPE, %, GLOBAL, 2022 VS 2029
- Figure 91:
- NEMATICIDE CONSUMED BY REST OF ASIA-PACIFIC, METRIC TON, GLOBAL, 2017 - 2029
- Figure 92:
- NEMATICIDE CONSUMED BY REST OF ASIA-PACIFIC, USD, GLOBAL, 2017 - 2029
- Figure 93:
- VALUE SHARE OF REST OF ASIA-PACIFIC BY CROP TYPE, %, GLOBAL, 2022 VS 2029
- Figure 94:
- NEMATICIDE MARKET BY COUNTRY, METRIC TON, GLOBAL, 2017 - 2029
- Figure 95:
- NEMATICIDE MARKET BY COUNTRY, USD, GLOBAL, 2017 - 2029
- Figure 96:
- VALUE SHARE OF NEMATICIDE BY COUNTRY, %, GLOBAL, 2017 VS 2023 VS 2029
- Figure 97:
- VOLUME SHARE OF NEMATICIDE BY COUNTRY, %, GLOBAL, 2017 VS 2023 VS 2029
- Figure 98:
- NEMATICIDE CONSUMED BY FRANCE, METRIC TON, GLOBAL, 2017 - 2029
- Figure 99:
- NEMATICIDE CONSUMED BY FRANCE, USD, GLOBAL, 2017 - 2029
- Figure 100:
- VALUE SHARE OF FRANCE BY CROP TYPE, %, GLOBAL, 2022 VS 2029
- Figure 101:
- NEMATICIDE CONSUMED BY GERMANY, METRIC TON, GLOBAL, 2017 - 2029
- Figure 102:
- NEMATICIDE CONSUMED BY GERMANY, USD, GLOBAL, 2017 - 2029
- Figure 103:
- VALUE SHARE OF GERMANY BY CROP TYPE, %, GLOBAL, 2022 VS 2029
- Figure 104:
- NEMATICIDE CONSUMED BY ITALY, METRIC TON, GLOBAL, 2017 - 2029
- Figure 105:
- NEMATICIDE CONSUMED BY ITALY, USD, GLOBAL, 2017 - 2029
- Figure 106:
- VALUE SHARE OF ITALY BY CROP TYPE, %, GLOBAL, 2022 VS 2029
- Figure 107:
- NEMATICIDE CONSUMED BY NETHERLANDS, METRIC TON, GLOBAL, 2017 - 2029
- Figure 108:
- NEMATICIDE CONSUMED BY NETHERLANDS, USD, GLOBAL, 2017 - 2029
- Figure 109:
- VALUE SHARE OF NETHERLANDS BY CROP TYPE, %, GLOBAL, 2022 VS 2029
- Figure 110:
- NEMATICIDE CONSUMED BY RUSSIA, METRIC TON, GLOBAL, 2017 - 2029
- Figure 111:
- NEMATICIDE CONSUMED BY RUSSIA, USD, GLOBAL, 2017 - 2029
- Figure 112:
- VALUE SHARE OF RUSSIA BY CROP TYPE, %, GLOBAL, 2022 VS 2029
- Figure 113:
- NEMATICIDE CONSUMED BY SPAIN, METRIC TON, GLOBAL, 2017 - 2029
- Figure 114:
- NEMATICIDE CONSUMED BY SPAIN, USD, GLOBAL, 2017 - 2029
- Figure 115:
- VALUE SHARE OF SPAIN BY CROP TYPE, %, GLOBAL, 2022 VS 2029
- Figure 116:
- NEMATICIDE CONSUMED BY UKRAINE, METRIC TON, GLOBAL, 2017 - 2029
- Figure 117:
- NEMATICIDE CONSUMED BY UKRAINE, USD, GLOBAL, 2017 - 2029
- Figure 118:
- VALUE SHARE OF UKRAINE BY CROP TYPE, %, GLOBAL, 2022 VS 2029
- Figure 119:
- NEMATICIDE CONSUMED BY UNITED KINGDOM, METRIC TON, GLOBAL, 2017 - 2029
- Figure 120:
- NEMATICIDE CONSUMED BY UNITED KINGDOM, USD, GLOBAL, 2017 - 2029
- Figure 121:
- VALUE SHARE OF UNITED KINGDOM BY CROP TYPE, %, GLOBAL, 2022 VS 2029
- Figure 122:
- NEMATICIDE CONSUMED BY REST OF EUROPE, METRIC TON, GLOBAL, 2017 - 2029
- Figure 123:
- NEMATICIDE CONSUMED BY REST OF EUROPE, USD, GLOBAL, 2017 - 2029
- Figure 124:
- VALUE SHARE OF REST OF EUROPE BY CROP TYPE, %, GLOBAL, 2022 VS 2029
- Figure 125:
- NEMATICIDE MARKET BY COUNTRY, METRIC TON, GLOBAL, 2017 - 2029
- Figure 126:
- NEMATICIDE MARKET BY COUNTRY, USD, GLOBAL, 2017 - 2029
- Figure 127:
- VALUE SHARE OF NEMATICIDE BY COUNTRY, %, GLOBAL, 2017 VS 2023 VS 2029
- Figure 128:
- VOLUME SHARE OF NEMATICIDE BY COUNTRY, %, GLOBAL, 2017 VS 2023 VS 2029
- Figure 129:
- NEMATICIDE CONSUMED BY CANADA, METRIC TON, GLOBAL, 2017 - 2029
- Figure 130:
- NEMATICIDE CONSUMED BY CANADA, USD, GLOBAL, 2017 - 2029
- Figure 131:
- VALUE SHARE OF CANADA BY CROP TYPE, %, GLOBAL, 2022 VS 2029
- Figure 132:
- NEMATICIDE CONSUMED BY MEXICO, METRIC TON, GLOBAL, 2017 - 2029
- Figure 133:
- NEMATICIDE CONSUMED BY MEXICO, USD, GLOBAL, 2017 - 2029
- Figure 134:
- VALUE SHARE OF MEXICO BY CROP TYPE, %, GLOBAL, 2022 VS 2029
- Figure 135:
- NEMATICIDE CONSUMED BY UNITED STATES, METRIC TON, GLOBAL, 2017 - 2029
- Figure 136:
- NEMATICIDE CONSUMED BY UNITED STATES, USD, GLOBAL, 2017 - 2029
- Figure 137:
- VALUE SHARE OF UNITED STATES BY CROP TYPE, %, GLOBAL, 2022 VS 2029
- Figure 138:
- NEMATICIDE CONSUMED BY REST OF NORTH AMERICA, METRIC TON, GLOBAL, 2017 - 2029
- Figure 139:
- NEMATICIDE CONSUMED BY REST OF NORTH AMERICA, USD, GLOBAL, 2017 - 2029
- Figure 140:
- VALUE SHARE OF REST OF NORTH AMERICA BY CROP TYPE, %, GLOBAL, 2022 VS 2029
- Figure 141:
- NEMATICIDE MARKET BY COUNTRY, METRIC TON, GLOBAL, 2017 - 2029
- Figure 142:
- NEMATICIDE MARKET BY COUNTRY, USD, GLOBAL, 2017 - 2029
- Figure 143:
- VALUE SHARE OF NEMATICIDE BY COUNTRY, %, GLOBAL, 2017 VS 2023 VS 2029
- Figure 144:
- VOLUME SHARE OF NEMATICIDE BY COUNTRY, %, GLOBAL, 2017 VS 2023 VS 2029
- Figure 145:
- NEMATICIDE CONSUMED BY ARGENTINA, METRIC TON, GLOBAL, 2017 - 2029
- Figure 146:
- NEMATICIDE CONSUMED BY ARGENTINA, USD, GLOBAL, 2017 - 2029
- Figure 147:
- VALUE SHARE OF ARGENTINA BY CROP TYPE, %, GLOBAL, 2022 VS 2029
- Figure 148:
- NEMATICIDE CONSUMED BY BRAZIL, METRIC TON, GLOBAL, 2017 - 2029
- Figure 149:
- NEMATICIDE CONSUMED BY BRAZIL, USD, GLOBAL, 2017 - 2029
- Figure 150:
- VALUE SHARE OF BRAZIL BY CROP TYPE, %, GLOBAL, 2022 VS 2029
- Figure 151:
- NEMATICIDE CONSUMED BY CHILE, METRIC TON, GLOBAL, 2017 - 2029
- Figure 152:
- NEMATICIDE CONSUMED BY CHILE, USD, GLOBAL, 2017 - 2029
- Figure 153:
- VALUE SHARE OF CHILE BY CROP TYPE, %, GLOBAL, 2022 VS 2029
- Figure 154:
- NEMATICIDE CONSUMED BY REST OF SOUTH AMERICA, METRIC TON, GLOBAL, 2017 - 2029
- Figure 155:
- NEMATICIDE CONSUMED BY REST OF SOUTH AMERICA, USD, GLOBAL, 2017 - 2029
- Figure 156:
- VALUE SHARE OF REST OF SOUTH AMERICA BY CROP TYPE, %, GLOBAL, 2022 VS 2029
- Figure 157:
- MOST ACTIVE COMPANIES BY NUMBER OF STRATEGIC MOVES, GLOBAL, 2017-2022
- Figure 158:
- MOST ACTIVE COMPANIES BY NUMBER OF STRATEGIC MOVES, GLOBAL, 2017-2022
- Figure 159:
- MARKET SHARE OF MAJOR PLAYERS, %, GLOBAL
Nematicide Industry Segmentation
Chemigation, Foliar, Fumigation, Seed Treatment, Soil Treatment are covered as segments by Application Mode. Commercial Crops, Fruits & Vegetables, Grains & Cereals, Pulses & Oilseeds, Turf & Ornamental are covered as segments by Crop Type. Africa, Asia-Pacific, Europe, North America, South America are covered as segments by Region.| Application Mode | Chemigation | |||
| Foliar | ||||
| Fumigation | ||||
| Seed Treatment | ||||
| Soil Treatment | ||||
| Crop Type | Commercial Crops | |||
| Fruits & Vegetables | ||||
| Grains & Cereals | ||||
| Pulses & Oilseeds | ||||
| Turf & Ornamental | ||||
| Region | Africa | By Country | South Africa | |
| Rest of Africa | ||||
| Asia-Pacific | By Country | Australia | ||
| China | ||||
| India | ||||
| Indonesia | ||||
| Japan | ||||
| Myanmar | ||||
| Pakistan | ||||
| Philippines | ||||
| Thailand | ||||
| Vietnam | ||||
| Rest of Asia-Pacific | ||||
| Europe | By Country | France | ||
| Germany | ||||
| Italy | ||||
| Netherlands | ||||
| Russia | ||||
| Spain | ||||
| Ukraine | ||||
| United Kingdom | ||||
| Rest of Europe | ||||
| North America | By Country | Canada | ||
| Mexico | ||||
| United States | ||||
| Rest of North America | ||||
| South America | By Country | Argentina | ||
| Brazil | ||||
| Chile | ||||
| Rest of South America | ||||
Need A Different Region or Segment?
Customize Now
Market Definition
- Function - Nematicides are chemicals used to control or prevent nematodes from damaging the crop and prevent yield loss.
- Application Mode - Foliar, Seed Treatment, Soil Treatment, Chemigation, and Fumigation are the different type of application modes through which crop protection chemicals are applied to the crops.
- Crop Type - This represents the consumption of crop protection chemicals by Cereals, Pulses, Oilseeds, Fruits, Vegetables, Turf, and Ornamental crops.
| Keyword | Definition |
|---|---|
| IWM | Integrated weed management (IWM) is an approach to incorporate multiple weed control techniques throughout the growing season to give producers the best opportunity to control problematic weeds. |
| Host | Hosts are the plants that form relationships with beneficial microorganisms and help them colonize. |
| Pathogen | A disease-causing organism. |
| Herbigation | Herbigation is an effective method of applying herbicides through irrigation systems. |
| Maximum residue levels (MRL) | Maximum Residue Limit (MRL) is the maximum allowed limit of pesticide residue in food or feed obtained from plants and animals. |
| IoT | The Internet of Things (IoT) is a network of interconnected devices that connect and exchange data with other IoT devices and the cloud. |
| Herbicide-tolerant varieties (HTVs) | Herbicide-tolerant varieties are plant species that have been genetically engineered to be resistant to herbicides used on crops. |
| Chemigation | Chemigation is a method of applying pesticides to crops through an irrigation system. |
| Crop Protection | Crop protection is a method of protecting crop yields from different pests, including insects, weeds, plant diseases, and others that cause damage to agricultural crops. |
| Seed Treatment | Seed treatment helps to disinfect seeds or seedlings from seed-borne or soil-borne pests. Crop protection chemicals, such as fungicides, insecticides, or nematicides, are commonly used for seed treatment. |
| Fumigation | Fumigation is the application of crop protection chemicals in gaseous form to control pests. |
| Bait | A bait is a food or other material used to lure a pest and kill it through various methods, including poisoning. |
| Contact Fungicide | Contact pesticides prevent crop contamination and combat fungal pathogens. They act on pests (fungi) only when they come in contact with the pests. |
| Systemic Fungicide | A systemic fungicide is a compound taken up by a plant and then translocated within the plant, thus protecting the plant from attack by pathogens. |
| Mass Drug Administration (MDA) | Mass drug administration is the strategy to control or eliminate many neglected tropical diseases. |
| Mollusks | Mollusks are pests that feed on crops, causing crop damage and yield loss. Mollusks include octopi, squid, snails, and slugs. |
| Pre-emergence Herbicide | Preemergence herbicides are a form of chemical weed control that prevents germinated weed seedlings from becoming established. |
| Post-emergence Herbicide | Postemergence herbicides are applied to the agricultural field to control weeds after emergence (germination) of seeds or seedlings. |
| Active Ingredients | Active ingredients are the chemicals in pesticide products that kill, control, or repel pests. |
| United States Department of Agriculture (USDA) | The Department of Agriculture provides leadership on food, agriculture, natural resources, and related issues. |
| Weed Science Society of America (WSSA) | The WSSA, a non-profit professional society, promotes research, education, and extension outreach activities related to weeds. |
| Suspension concentrate | Suspension concentrate (SC) is one of the formulations of crop protection chemicals with solid active ingredients dispersed in water. |
| Wettable powder | A wettable powder (WP) is a powder formulation that forms a suspension when mixed with water prior to spraying. |
| Emulsifiable concentrate | Emulsifiable concentrate (EC) is a concentrated liquid formulation of pesticide that needs to be diluted with water to create a spray solution. |
| Plant-parasitic nematodes | Parasitic Nematodes feed on the roots of crops, causing damage to the roots. These damages allow for easy plant infestation by soil-borne pathogens, which results in crop or yield loss. |
| Australian Weeds Strategy (AWS) | The Australian Weeds Strategy, owned by the Environment and Invasives Committee, provides national guidance on weed management. |
| Weed Science Society of Japan (WSSJ) | WSSJ aims to contribute to the prevention of weed damage and the utilization of weed value by providing the chance for research presentation and information exchange. |
Need More Details on Market Definition?
Ask a Question
Research Methodology
Mordor Intelligence follows a four-step methodology in all our reports.
- Step-1: Identify Key Variables: In order to build a robust forecasting methodology, the variables and factors identified in Step-1 are tested against available historical market numbers. Through an iterative process, the variables required for market forecast are set and the model is built on the basis of these variables.
- Step-2: Build a Market Model: Market-size estimations for the forecast years are in nominal terms. Inflation is not a part of the pricing, and the average selling price (ASP) is kept constant throughout the forecast period.
- Step-3: Validate and Finalize: In this important step, all market numbers, variables and analyst calls are validated through an extensive network of primary research experts from the market studied. The respondents are selected across levels and functions to generate a holistic picture of the market studied.
- Step-4: Research Outputs: Syndicated Reports, Custom Consulting Assignments, Databases & Subscription Platforms

Get More Details On Research Methodology
Download PDF


