
Automotive NDT Market Size and Share
Market Overview
| Study Period | 2020 - 2031 |
|---|---|
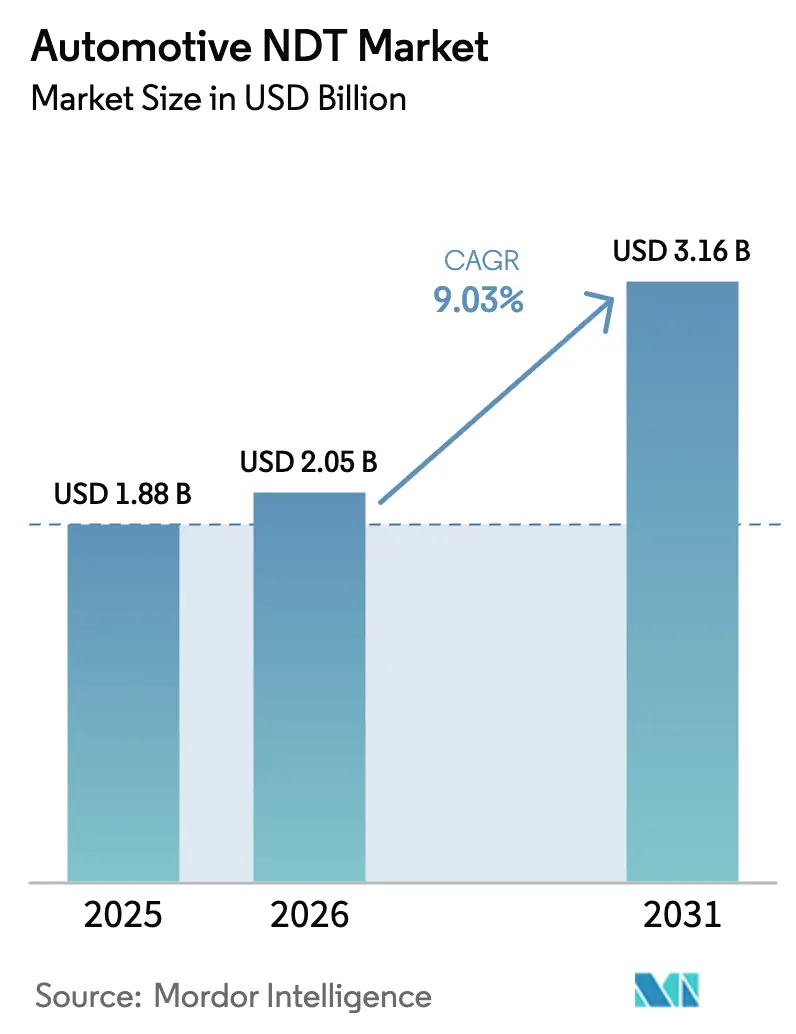
| Market Size (2026) | USD 2.05 Billion |
| Market Size (2031) | USD 3.16 Billion |
| Growth Rate (2026 - 2031) | 9.03% CAGR |
| Fastest Growing Market | Asia-Pacific |
| Largest Market | North America |
| Market Concentration | Medium |
Major Players *Disclaimer: Major Players sorted in no particular order Image © Mordor Intelligence. Reuse requires attribution under CC BY 4.0. | |
Automotive NDT Market Analysis by Mordor Intelligence
The Automotive NDT market size was valued at USD 1.88 billion in 2025 and estimated to grow from USD 2.05 billion in 2026 to reach USD 3.16 billion by 2031, at a CAGR of 9.03% during the forecast period (2026-2031). This momentum reflects the industry’s rapidly growing reliance on advanced inspection technologies that safeguard lightweight multi-material structures, validate the integrity of electric-vehicle (EV) batteries, and meet increasingly stringent global safety regulations. Automakers are integrating inline computed tomography (CT) scanners and high-frequency ultrasonic arrays to locate subsurface flaws in aluminum castings and carbon-fiber parts without slowing takt times, while AI-enabled defect recognition software improves detection repeatability to above 97% for critical castings. Heightened capital spending on robotics-ready systems, the spread of Industry 4.0 architectures, and cross-border regulatory harmonization are expanding supplier opportunities across every major production hub. Meanwhile, a shortage of certified technicians is strengthening demand for turnkey inspection services and automated workflows. Strategic consolidation exemplified by SGS’s USD 1.325 billion purchase of Applied Technical Services signals a race to build global reach and full-stack technology portfolios that can address the accelerating requirements of the Automotive NDT market.
Key Report Takeaways
- By component, equipment commanded 48.10% of the Automotive NDT market share in 2025, while software is projected to grow at a 10.05% CAGR to 2031.
- By testing method, ultrasonic testing accounted for 32.20% of the Automotive NDT market size in 2025; computed tomography is expected to expand at a 10.96% CAGR through 2031.
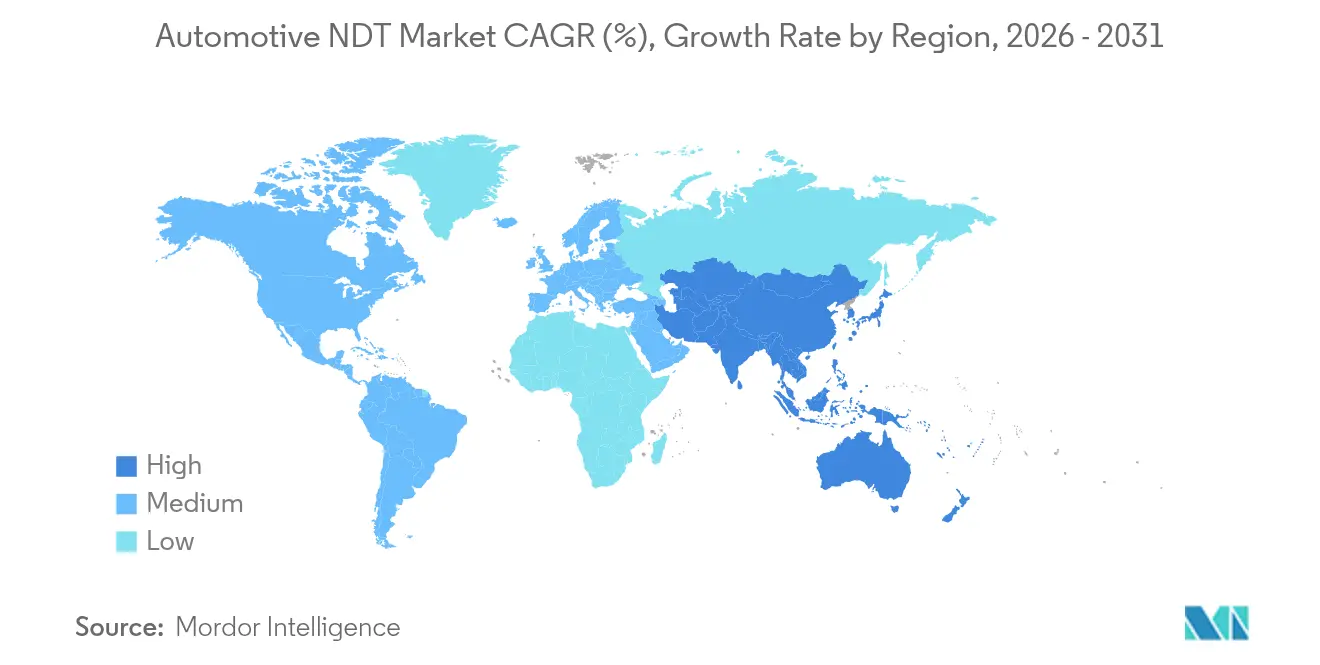
- By technique, traditional methods accounted for 76.10% of the Automotive NDT market share in 2025, whereas AI-enabled systems are forecast to post a 9.88% CAGR to 2031.
- By geography, North America led the Automotive NDT market with a 37.45% revenue share in 2025; the Asia Pacific is expected to advance at a 10.12% CAGR between 2026 and 2031.
Note: Market size and forecast figures in this report are generated using Mordor Intelligence’s proprietary estimation framework, updated with the latest available data and insights as of 2026.
Global Automotive NDT Market Trends and Insights
Drivers Impact Analysis*
| Driver | (~) % Impact on CAGR Forecast | Geographic Relevance | Impact Timeline |
|---|---|---|---|
| Rising use of advanced lightweight materials | +2.1% | North America and Europe core; global spill-over | Medium term (2-4 years) |
| Surge in electric-vehicle battery inspections | +2.8% | Asia Pacific and North America early leaders | Short term (≤ 2 years) |
| Stringent global vehicle-safety mandates | +1.9% | Global | Long term (≥ 4 years) |
| Robotics-driven inline NDT automation | +1.7% | North America and Europe; expanding Asia-Pacific | Medium term (2-4 years) |
| Shift to full-CT for additively manufactured parts | +1.4% | North America and Europe | Long term (≥ 4 years) |
| Insurance-led demand for in-service portable NDT | +0.9% | North America and Europe; developed Asia-Pacific | Medium term (2-4 years) |
| Source: Mordor Intelligence | |||
Rising Use of Advanced Lightweight Materials
Automakers are swapping traditional steel structures for aluminum alloys and carbon-fiber-reinforced polymers, which boost fuel economy but demand more sophisticated inspection. Ultrasonic phased-array systems now scan bonded joints to catch delamination that could trigger adhesive failure under crash loads. Inline CT units mounted on production conveyors enable 100% volumetric checks without removing parts from the takt schedule, a method BMW employs for carbon-fiber roof frames. AI-powered analytics have lifted void-detection repeatability for aluminum casting to 97.25%, though accuracy in thickness transitions still lags at 86.97% repeatability. ISO 9001 and IATF 16949 certifications require suppliers to demonstrate full traceability, thereby promoting the wider adoption of digital archiving and barcode-linked image storage. As lightweighting trends accelerate, the Automotive NDT market will broaden its equipment base across every new model launch.
Surge in Electric-Vehicle Battery Inspections
Lithium-ion packs introduce thermal-runaway risk that OEMs mitigate through rigorous CT and ultrasonic validation of cell welds, electrode alignment, and coolant-plate bonding. Hexagon has rolled out high-energy CT lines that image 1,000 cells per hour, while VisiConsult secured EUR 1.1 million to commercialize inline CT for prismatic modules. UN 38.3 shipping rules and draft IEC 62660 standards force proof of cell integrity before transportation, generating near-term demand spikes for portable radiography and eddy-current scanners. In-service diagnostics are also advancing: low-frequency ultrasound maps electrolyte volume loss in aging packs to pre-empt warranty claims. These factors reinforce a 2.8% positive contribution to the Automotive NDT market’s CAGR.
Stringent Global Vehicle Safety Mandates
NHTSA’s roadmap introduces THOR-50M and WorldSID anthropomorphic dummies by model year 2027, which raises the bar for structural soundness of sensor brackets and crash-energy paths. Euro NCAP aligns in parallel, compelling multinational OEMs to validate identical crash-reinforcement nodes across regions. Advanced emergency-braking (AEB) rules covering speeds up to 90 mph by 2029 are intensifying scrutiny of radar mounts and camera housings that must stay calibrated after minor impacts. Zendar’s test data showed only 17% of 2023 models fully avoided daytime pedestrian dummies, underscoring the importance of fault-free sensor housing.[1]Zendar Inc., “How OEMs Can Meet NHTSA’s Stringent AEB Requirements,” zendar.io These regulations extend inspection to energy-absorbing bumpers, pedestrian leg-form zones, and carbon-fiber front-end carriers. The result is a multi-year uplift in the Automotive NDT market as OEMs retrofit lines for higher-resolution scanning.
Robotics Driven Inline NDT Automation
Automated spot-weld scanners equipped with six-axis robots now inspect up to 300 welds per vehicle at cycle times under 3 seconds each, quadrupling throughput versus manual sampling. Motion-programmed CT gantries store part recipes that ensure sub-millimeter reproducibility across shifts and plants. GPU-accelerated algorithms flag defects in real-time and feed decisions back to programmable logic controllers for the immediate diversion of non-conforming parts. The Automotive NDT market benefits from reduced operator dependence and higher statistical confidence, convincing tier-one suppliers to budget for fully automated cells in their capital plans for 2026-2028. ISO 13485 and IATF 16949 clauses on measurement uncertainty encourage the adoption of systems with built-in self-calibration, strengthening the mid-term CAGR uplift.
Restraints Impact Analysis*
| Restraint | (~) % Impact on CAGR Forecast | Geographic Relevance | Impact Timeline |
|---|---|---|---|
| High capital cost of advanced NDT equipment | −1.8% | Global; emerging markets most impacted | Short term (≤ 2 years) |
| Shortage of certified NDT technicians | −1.3% | North America and Europe acute | Long term (≥ 4 years) |
| Production downtime from radiographic safety zones | −0.9% | Global manufacturing hubs | Medium term (2-4 years) |
| IP concerns over cloud-based analytics | −0.7% | Global; heightened Asia Pacific sensitivity | Short term (≤ 2 years) |
| Source: Mordor Intelligence | |||
High Capital Cost of Advanced NDT Equipment
Industrial CT cabinets capable of 225-kV scans cost over USD 500,000, and adding conveyors, shielding, and robotic loaders often doubles the expenditure, challenging the ROI thresholds of tier-two suppliers.[2]North Star Imaging, “How 2D Digital Radiography Enhances Automotive and Aerospace Quality Control,” ndt.net Rapid sensor evolution risks obsolescence before depreciation ends, while radiographic rooms demand costly lead lining and exclusion zones that interrupt lean layouts. NHTSA’s forthcoming 2029 AEB mandate already requires OEMs to allocate USD 430 million per brand for sensor upgrades, thereby inflating parallel inspection costs. Financing constraints weigh heaviest on emerging-market plants where local content rules collide with foreign-currency equipment pricing, shaving 1.8 points off the Automotive NDT market CAGR in the near term.
Shortage of Certified NDT Technicians
An aging workforce is exiting at a faster rate than certification bodies can replenish, resulting in unfilled vacancies for ASNT Level III ultrasonic examiners in North America and Europe for months. Modern curricula often lag behind AI-assisted interpretation skills, resulting in machines flagging more defects than operators can validate, which in turn forces line slowdowns. Companies respond by outsourcing audits to service providers, but travel and mobilization costs escalate when peak demand coincides with model launches. Scholarship programs and simulator-based training may ease the crunch, yet meaningful relief is unlikely before 2028, exerting a long-term drag on the expansion of the Automotive NDT market.
*Our forecasts treat driver/restraint impacts as directional, not additive. The impact forecasts reflect baseline growth, mix effects, and variable interactions.
Segment Analysis
By Component: Equipment Dominance Drives Market Foundation
Equipment accounted for 48.10% of the Automotive NDT market share in 2025, reflecting the sector’s capital-intensive backbone. Nikon, Yxlon, and North Star Imaging report multi-year order backlogs as OEMs refurbish CT lines for EV platforms. Conversely, software revenue is projected to grow at a 10.05% CAGR, driven by AI engines that automate defect classification and cloud portals that store terabytes of DICONDE images. The Automotive NDT market size tied to services remains resilient because outsourcing fills technician gaps and ensures neutrality during supplier audits. Consumables, although smaller, gain from the swelling installed base of digital detectors that require periodic flat-field calibrations.
Regulatory frameworks, such as ISO 17025, require laboratories to recalibrate gauges annually, generating steady demand for certified blocks and verification coupons. Hyundai’s purchase of Nikon X-ray CT units to verify airbag initiators demonstrates how capital equipment sales pull downstream services and consumables along the value chain. Meanwhile, VisiConsult’s ERDF-backed R&D underscores the symbiosis between hardware providers and algorithm specialists, anchoring long-term revenue diversity within the Automotive NDT market.


By Testing Method: Ultrasonic Leadership Faces CT Challenge
Ultrasonic systems accounted for 32.20% of the Automotive NDT market size in 2025, as their time-of-flight diffraction and phased-array modes effectively tackle spot weld, bond-line, and battery-foil inspections. Yet CT’s 10.96% CAGR makes it the fastest riser through 2031, fueled by additive-manufacturing use cases that demand full-volume fidelity. Radiography still shoulders bulk casting checks, but digital detectors and laminography upgrades keep it competitive. Magnetic-particle and liquid-penetrant methods remain staples for forgings and axle shafts, while eddy-current probes gain popularity for conductive EV busbars.
BMW’s inline CT deployment for carbon-fiber lids illustrates CT’s climb toward mainstream status. Volkswagen couples high-energy CT with AI segmentation to measure silicon-carbide inverter housings, cutting sectioning scrap. Meanwhile, visual inspection harnesses machine-vision cameras linked to deep-learning models, trimming false rejects. ASTM E3327 probability-of-detection standards guide all methods toward documented performance baselines, fostering method innovation and the creation of mix-and-match inspection cells within the Automotive NDT market.
By Technique: AI-Enabled Systems Accelerate Traditional Methods
Traditional approaches captured 76.10% of the Automotive NDT market share in 2025, but AI-enabled platforms are set to outperform at a 9.88% CAGR as predictive algorithms mature. Hybrid deployments embed neural networks within existing ultrasonic consoles, enhancing weld-flaw recognition without requiring the scrapping of legacy hardware. Cloud dashboards enable multi-plant comparison of defect trends, allowing for earlier tooling corrections. Suppliers deploying GPU clusters achieve real-time volumetric reconstructions, shortening CT scan cycles from 15 minutes to under 90 seconds.
Data-sovereignty concerns motivate on-premise edge processing, especially in Germany and Japan, yet even there, OEMs pilot encrypted tunnels for supplier data exchange. ISO 27001 compliance and IATF cybersecurity add layers of validation, pushing vendors to harden firmware and audit code bases. As deep-learning misclassification rates fall below 1.5%, AI-enabled modalities continue to edge further into safety-critical domains, such as chassis welds, thereby increasing their contribution to the overall Automotive NDT market.
Geography Analysis
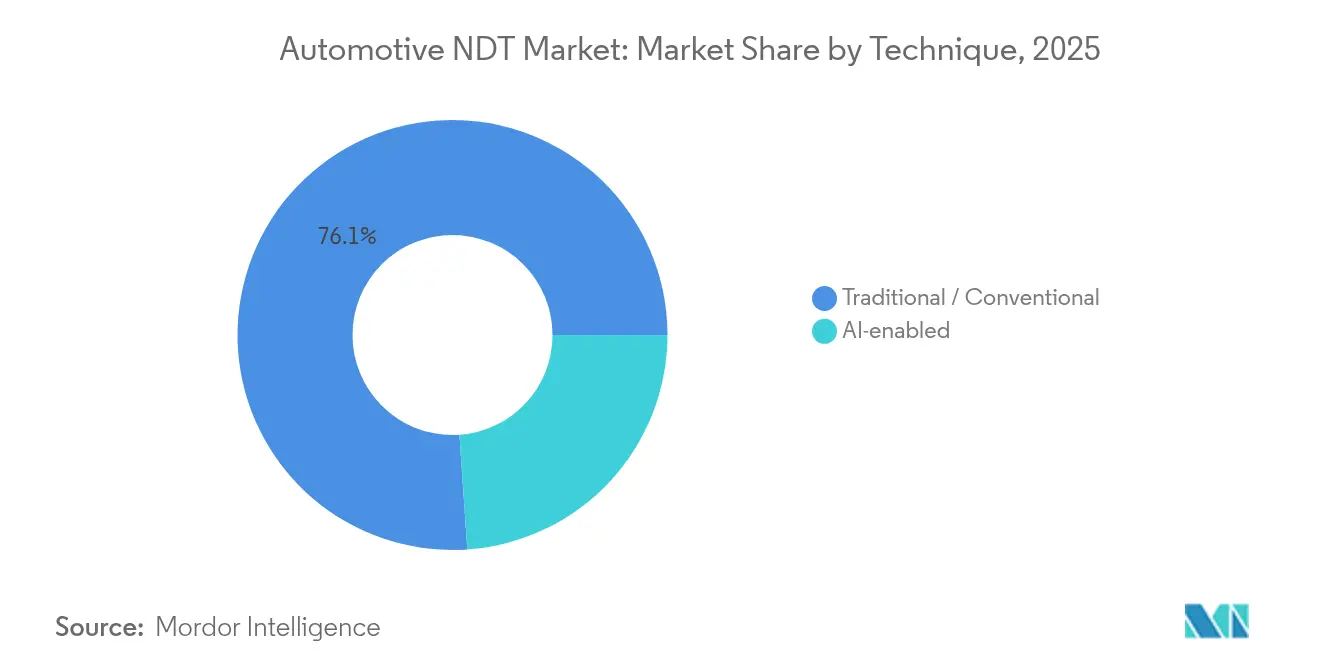
North America generated 37.45% of 2025 revenue, buoyed by NHTSA’s safety regime and a tight feedback loop between Detroit OEMs and Midwest testing labs. Asia Pacific, however, is projected to grow 10.12% annually as China, Japan, and South Korea forge giga-factories and export EV drivetrains worldwide. European volume remains stable, underpinned by premium brands that pioneer composite monocoques and bio-based resins. South America and the MENA region trail, but attract Greenfield plants that embed modern inspection from day one, avoiding legacy equipment pitfalls.
The United States leads investment in robotics-ready CT cells, while Canada specializes in composite research and Mexico focuses on cost-optimized service centers. The Asia Pacific’s Automotive NDT market size is expanding at the fastest rate, thanks to China’s giga-factory boom and Japanese breakthroughs in high-frequency phased arrays that visualize 30-micron voids in solid-state batteries. India is rolling out training schemes with ASNT to fill its technician gap, creating new service outsourcing streams. Europe anchors high-end applications; Germany deploys 9-MeV linear accelerators for CT scanning of diesel-engine blocks, while the United Kingdom advances AI-based defect segmentation software. Harmonized Euro NCAP protocols simplify cross-border supplier approvals, driving demand for pan-European inspection campaigns. South America and Africa, although smaller, are seeing niche growth around export-oriented chassis plants adopting portable ultrasonic crawlers to comply with European customer audits. Collectively, these dynamics diversify the customer mix, spreading Automotive NDT market risk across mature and emerging economies.

Regulatory Landscape
Automotive NDT demand is shaped by vehicle approval, safety, and quality-management regimes that require evidence of conformity and traceable inspection records across the supply chain. In the European Union, Regulation (EU) 2018/858 type-approval rules continue to formalize digital compliance. A requirement starting July 5, 2026 obliges EU Member States to make vehicle certificates of conformity accessible as structured data via a common secure electronic exchange system, which reinforces the need for digitized inspection documentation and archiving workflows.
In the United States, NHTSA enforces FMVSS under 49 CFR 571 for motor vehicle equipment certification, tying safety compliance to robust verification and documentation practices by OEMs and suppliers. Personnel qualification and lab competence frameworks also affect market structure. ISO 9712:2021 is a widely used standard for NDT personnel qualification and certification, and it aligns certification bodies to ISO/IEC 17024 expectations, while ICNDT guidance provides a reference framework used by national schemes. Trade policy can indirectly impact NDT supply chains and equipment procurement: the United States maintains Section 232 automotive parts tariff inclusion request windows on a recurring schedule (January, April, July, October), and the April 2026 window ran from April 1 to April 14, 2026; parallel USMCA auto-sector reviews (with 2026 rounds noted in late May and mid-June) add compliance and sourcing complexity for cross-border manufacturing networks.
Value Chain Analysis
The automotive NDT value chain starts with technology inputs (X-ray sources, detectors, ultrasonics transducers and phased-array electronics, robotics, shielding, and industrial compute). It then flows through OEM equipment manufacturers and software providers that package systems for inline or lab use. System integrators and automation specialists connect inspection hardware to conveyors, robots, PLCs, and manufacturing execution systems, while calibration bodies and certification schemes (for personnel and labs) underpin credibility for high-consequence applications such as welds, castings, composites, and EV battery components. Third-party TIC and NDT service providers also play a role through outsourced inspections, supplier audits, and peak-load support during technician shortages or rapid model changeovers.
Downstream, deployment occurs inside OEM and tier supplier plants, where inspection data is converted into release decisions, statistical process control outputs, and traceable digital records that are retained for warranty and recall defense. Volkswagen’s move to operationalize inspection at production scale is visible in series production at its Zwickau plant, where automated thermographic inspection is used to verify resistance spot welding on EV bodies. BMW Group has also deployed inline terahertz-based measurement at its Leipzig plant for automated paint-layer thickness checks on plastic exterior components. Technical directions discussed in industry forums, including laser-excited ultrasonics for contact-free inspection of adhesive bonds and shearography methods for defect depth characterization, point to upstream-to-downstream pull for faster, more automated, and more data-centric inspection workflows.
Competitive Landscape
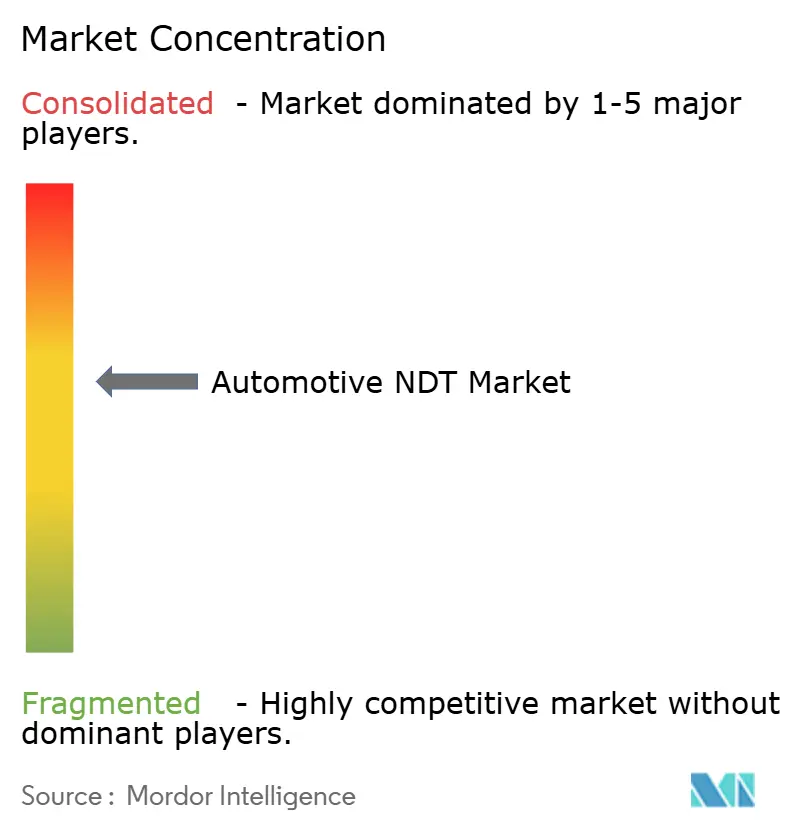
The Automotive NDT market is moderately consolidated, with the top five vendors controlling roughly 38% of the 2024 revenue. However, more than 400 regional service firms remain active worldwide. Major players pursue three key levers: technology integration, geographic expansion, and vertical bundling, to outpace their peers. SGS’s USD 1.325 billion ATS acquisition added 85 laboratories and 2,100 staff to its North American roster, sharpening its bid for OEM strategic contracts.[4]OneStopNDT Editorial, “Eddyfi/NDT Completes Acquisition of NDT Global,” onestopndt.com Eddyfi/NDT’s absorption of NDT Global joined ultrasonic, eddy-current, and acoustic-emission assets under one umbrella, allowing cross-selling to auto and pipeline clients.
Strategic moves also include Institut Dr. Foerster’s purchase of Prüftechnik, which brings eddy-current probe IP into Germany’s EV-motor supply chain. TRIGO’s Controreupe buy extends 3D laser-scanning services to French OEMs preparing hydrogen-powered platforms. On the technology front, North Star Imaging launched a GPU-accelerated CT suite that reconstructs 2,048×2,048-pixel volumes in 80 seconds, representing a 6-fold improvement over prior versions. Start-ups such as ZVerse apply generative AI to synthesize missing CT slices, promising defect detection in half the radiation dose. With M&A pipelines robust and AI platforms advancing, competitive intensity is expected to remain high throughout the forecast period.
Automotive NDT Industry Leaders
Baker Hughes Company
Mistras Group Inc.
SGS SA
Intertek Group plc
Applus Services SA
- *Disclaimer: Major Players sorted in no particular order

Market Opportunities and Future Outlook
One major opportunity sits at the intersection of digital compliance and high-throughput inspection, where OEMs and suppliers need structured, searchable evidence that links parts, processes, and inspection results across plants and borders. The EU type-approval shift to structured electronic access for certificates of conformity from July 5, 2026 under Regulation (EU) 2018/858 increases the value of NDT software layers, including data capture, secure storage, and traceable reporting, alongside equipment. This is especially relevant for multi-material structures and EV powertrain components that require repeatable volumetric and bond-line verification.
Electrification and automated driving also widen the opportunity for NDT and adjacent validation services tied to electronics packaging, sensor housings, and new materials. China’s MIIT published 2026 key tasks for automotive standardization that prioritize automotive chips, intelligent connected vehicles, and AI risk assessment, which pushes suppliers to expand verification capacity and documentation discipline around safety-critical electronics and assemblies. In parallel, UNECE’s July 2026 adoption of a regulatory framework for automated driving systems requires a manufacturer Safety Case and demonstrated performance via simulations and test tracks. That expands the compliance perimeter beyond traditional mechanical checks and supports integrated inspection, test, and certification offerings that combine physical integrity verification with digitally managed evidence chains.
Recent Industry Developments
- May 2026: SGS opened a new automotive materials testing laboratory in Kolin, Czech Republic. The added capacity supports faster turnaround for European OEM and tier supplier qualification work, complementing NDT-intensive quality programs for lightweight materials and EV components.
- July 2025: SGS finalized its USD 1.325 billion acquisition of Applied Technical Services. The deal expanded SGS with 85 facilities and about 2,100 engineers, increasing its ability to bid for multi-site automotive inspection and testing contracts that require consistent processes and broad geographic coverage.
- January 2025: TRIGO acquired Controreupe. The transaction strengthened TRIGO's metrology and inspection footprint for French OEM supply chains, tightening the link between dimensional control and NDT-driven defect detection in production quality workflows.


Research Methodology Framework and Report Scope
Market Definition and Coverage
For this study, the market covers revenue generated from non-destructive testing used to inspect automotive and transportation parts and assemblies, including equipment sales and testing services that support manufacturing quality checks and in-service integrity.
Scope exclusions: We exclude destructive testing, general metrology that is not an NDT method, and aftermarket repair work that does not involve inspection or certification.
Segmentation Overview
- By Component
- Equipment
- Software
- Services
- Consumables
- By Testing Method
- Ultrasonic Testing
- Radiographic Testing
- Magnetic Particle Testing
- Liquid Penetrant Testing
- Visual Inspection Testing
- Eddy-Current Testing
- Acoustic Emission Testing
- Thermography / Infrared Testing
- Computed Tomography Testing
- By Technique
- Traditional / Conventional
- AI-enabled
- By Geography
- North America
- United States
- Canada
- Mexico
- South America
- Brazil
- Argentina
- Rest of South America
- Europe
- Germany
- United Kingdom
- France
- Italy
- Spain
- Rest of Europe
- Asia Pacific
- China
- Japan
- India
- South Korea
- South-East Asia
- Rest of Asia Pacific
- Middle East
- Saudi Arabia
- United Arab Emirates
- Turkey
- Rest of Middle East
- Africa
- South Africa
- Nigeria
- Rest of Africa
- North America
Data Sources, Market Sizing, and Validation
Desk Research
We started by mapping what is used and paid for in automotive NDT, and then aligning it to measurable signals. Public references such as the International Organization for Standardization (ISO) standards library, SAE International publications, ASTM public information on test methods, and US agencies such as NHTSA helped us confirm how inspection expectations show up in production and safety contexts. We also used broader industry statistics and context sources such as the International Organization of Motor Vehicle Manufacturers (OICA) and USITC trade data to understand where production and cross-border component flows are concentrated.
To ground the commercial side, we reviewed company annual reports, investor presentations, and reputable press coverage to understand product mix changes (for example, higher use of CT and advanced ultrasonics). We also referenced paid subscriptions for company financials and intelligence, patent databases, and shipment-level import and export tracking to validate which firms are shipping specific NDT equipment and where it is going. These desk inputs were used as building blocks, and the list here is illustrative rather than exhaustive, since many other sources were checked for cross-verification and clarification.
Primary Interviews and Surveys
Next, we validated assumptions through interviews and structured surveys with inspection service providers, equipment distributors, plant quality teams, and technical specialists who work with UT, RT, MT, and CT-based workflows. Since automotive supply chains are global, discussions were balanced across APAC, EMEA, and the Americas to confirm where adoption is accelerating and which inspection steps are being automated. These conversations helped quantify gaps that are hard to see in public data, such as typical project sizes, pricing ranges by method, and how frequently equipment is refreshed versus services being outsourced.
Distribution of primary research fieldwork respondents
| Company type | Respondent position | Region |
|---|---|---|
| Top tier: 26% | CXOs: 16% | APAC: 46% |
| Mid tier: 56% | Functional/Unit leaders: 32% | EMEA: 30% |
| Smaller Players: 18% | Managers: 52% | Americas: 24% |
Market-Sizing & Forecasting
Sizing was built using a top-down and bottom-up approach, with the top-down view anchored on the automotive and transportation inspection demand pool. In practice, production and trade indicators were used to reconstruct where parts and assemblies are being made and moved, and then NDT intensity assumptions were applied by method and by component type. The totals were then checked using selective bottom-up approximations such as sampled average selling prices for key equipment, typical service contract values, and channel checks with distributors, which helped us adjust totals when the first pass looked stretched.
A few inputs that mattered most for this market included vehicle production trends, EV and battery manufacturing scale-up, adoption of lightweight materials that require more frequent inspection, the shift toward automated inline inspection, and method mix changes between UT, RT, MT, and CT. Where direct datapoints were missing, we handled gaps by using proxy variables, such as plant capacity additions and import patterns for inspection equipment, and then pressure-testing them with interview feedback.
For forecasting, we relied mainly on scenario analysis because adoption depends on manufacturing investment cycles and safety-driven quality requirements. Growth paths were set using a base case, with upside and downside ranges informed by expert views on automation penetration, inspection staffing availability, and the pace of EV platform launches.
Data Validation & Update Cycle
After the first model run, we compared outputs against independent signals, such as method-level adoption commentary from practitioners, production-linked demand movements, and trade-linked equipment flow direction. If a region or method produced a jump that did not match those signals, we revisited assumptions, rechecked conversions, and in some cases re-contacted respondents for clarification. Before sign-off, the work goes through multi-step analyst review, where inputs, formulas, and interim totals are checked to reduce avoidable errors.
Reports are refreshed on an annual cycle, and interim adjustments are made when material events occur, such as major regulation updates, large capacity expansions, or sharp changes in equipment pricing. Right before delivery, we run a fresh review pass so the client receives the latest updated view based on newly available public information and recent interview takeaways.
Mordor Intelligence's Automotive and Transportation Ndt Market Size Compared Against Other Published Estimates
It is common to see different market sizes for automotive and transportation NDT because analysts do not always count the same revenue streams or the same inspection touchpoints. Some studies focus only on services, while others combine equipment and services, and the year used for currency conversion can also move the value up or down.
By tracking method-level splits and refreshing service versus equipment price assumptions with industry checks, Mordor Intelligence keeps the estimate tied to inspection work that is directly linked to automotive and transportation production and maintenance cycles. Differences usually come from scope edges such as whether software and consumables are included, whether computed tomography is counted as a standalone line item or folded into radiography, and whether the forecast assumes faster automation rollouts than what plants are currently budgeting for.
Benchmark comparison
| Source | Market Size | Gaps in Research Methodology |
|---|---|---|
| Mordor Intelligence | USD 2.05 B (2026) | |
| Trade Journal A | USD 2.38 B (2025) | Uses a services-heavy definition and reports a 2025 base, which can look larger when equipment refresh cycles and deferred capex are not separated from ongoing inspection outsourcing. |
| Industry Publisher B | USD 1.80 B (2026) | Appears to narrow scope to core inspection methods and may exclude CT-related revenue and adjacent consumables, which reduces totals even when production-linked demand is similar. |
The spread across the table is mainly explained by what gets counted and when it is counted, not by a disagreement that inspection demand is rising. When scope is kept consistent across equipment and services and cross-checked with production and method adoption signals, the final number becomes easier to trace back to clear assumptions and repeatable steps.


Key Questions Answered in the Report
What is the forecast value of the Automotive NDT market by 2031?
The market is projected to reach USD 3.16 billion by 2031, growing at a 9.03% CAGR.
Which region leads current spending on automotive non-destructive testing?
North America leads with 37.45% revenue share, supported by stringent NHTSA mandates.
Which testing method is expanding fastest in automotive applications?
Computed tomography is the fastest-growing method, advancing at an 10.96% CAGR through 2031.
How are electric-vehicle batteries influencing NDT demand?
EV battery safety demands high-precision CT and ultrasonic scans, adding 2.8% to the market’s CAGR forecast.
What challenge constrains wider NDT adoption in emerging markets?
High capital costs for advanced CT and robotic setups reduce ROI and slow implementation.
Which companies recently drove consolidation in this space?
SGS’s acquisition of ATS and Eddyfi/NDT’s purchase of NDT Global are among the largest recent deals.
Page last updated on:






