
Natural Gas Refueling Infrastructure Market Size and Share
Market Overview
| Study Period | 2021 - 2031 |
|---|---|
| Market Size (2026) | USD 27.02 Billion |
| Market Size (2031) | USD 36.98 Billion |
| Growth Rate (2026 - 2031) | 6.47 % |
| Fastest Growing Market | Asia Pacific |
| Largest Market | Asia Pacific |
| Market Concentration | Low |
Major Players *Disclaimer: Major Players sorted in no particular order Image © Mordor Intelligence. Reuse requires attribution under CC BY 4.0. | |
Natural Gas Refueling Infrastructure Market Analysis by Mordor Intelligence
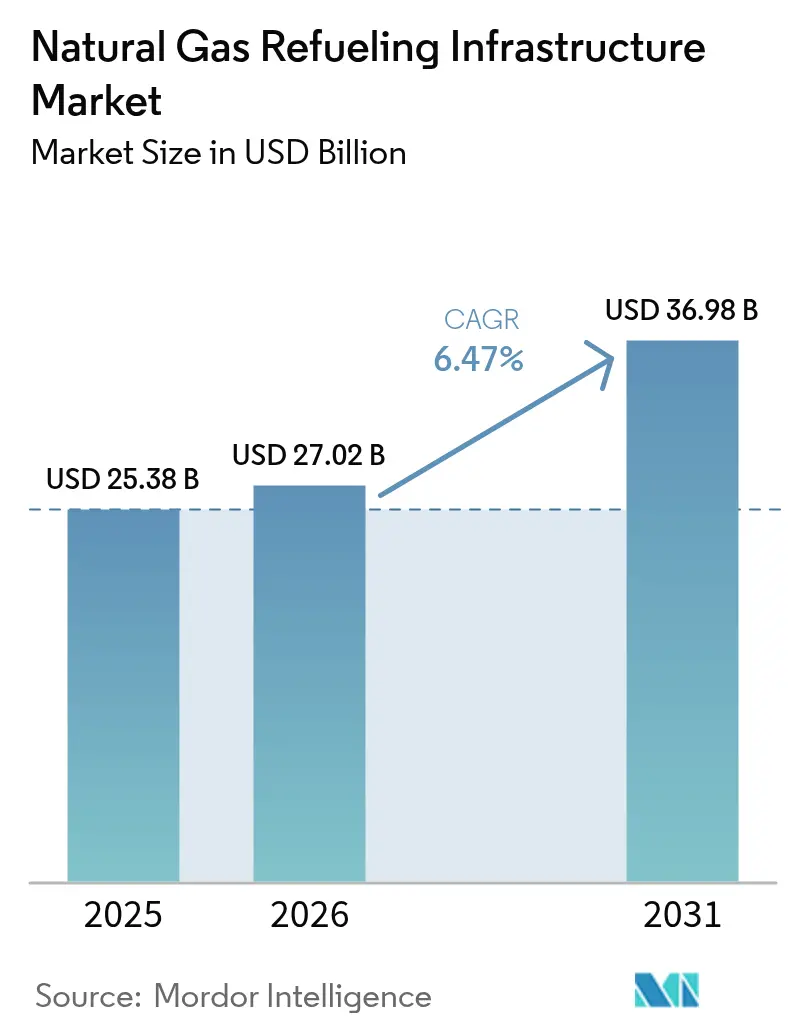
The Natural Gas Refueling Infrastructure Market size was valued at USD 25.38 billion in 2025 and estimated to grow from USD 27.02 billion in 2026 to reach USD 36.98 billion by 2031, at a CAGR of 6.47% during the forecast period (2026-2031).
Fleet operators view the sector as a near-term path to regulatory compliance because Euro VII and U.S. Phase 3 rules tighten tailpipe limits long before battery-electric charging networks can scale. Asia-Pacific anchors demand through record LNG imports and domestic gas discoveries, while North American growth rides shale-driven fuel cost advantages that widened to 40-60% versus diesel in 2024(1)Argus Media, “Henry Hub Price Collapse Widens Diesel Discount,” argusmedia.com . Marine bunkering corridors under construction in Sohar, Galveston, Vancouver, and Singapore confirm the segment’s strategic pivot toward shipping, reinforcing capital flows into LNG storage, cryogenic pumps, and control systems(2)Global Energy Infrastructure, “Middle East LNG Projects,” globalenergyinfrastructure.com . At the same time, AI-enabled leak detection and siting analytics raise network uptime and shrink methane emissions, supporting higher insurance acceptance for high-pressure assets.
Key Report Takeaways
- By natural gas type, Compressed natural gas led with 62.10% of the natural gas refueling infrastructure market share in 2025; renewable/bio-CNG is forecast to expand at a 19.35% CAGR through 2031.
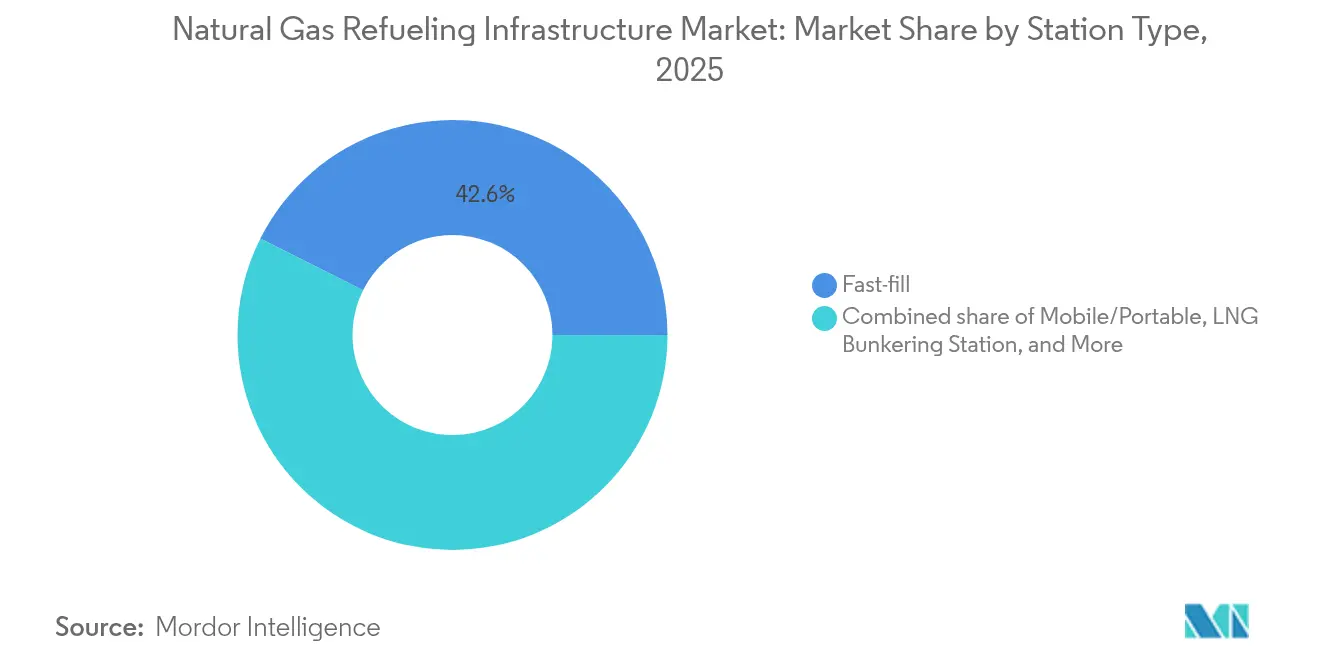
- By station type, Fast-fill stations contributed 42.60% of the 2025 installations, while mobile/portable formats are projected to grow at an annual rate of 8.72% by 2031.
- By component, Compressors accounted for 29.00% of 2025 component revenue, yet control and monitoring systems are advancing at a 9.62% CAGR over the outlook period.
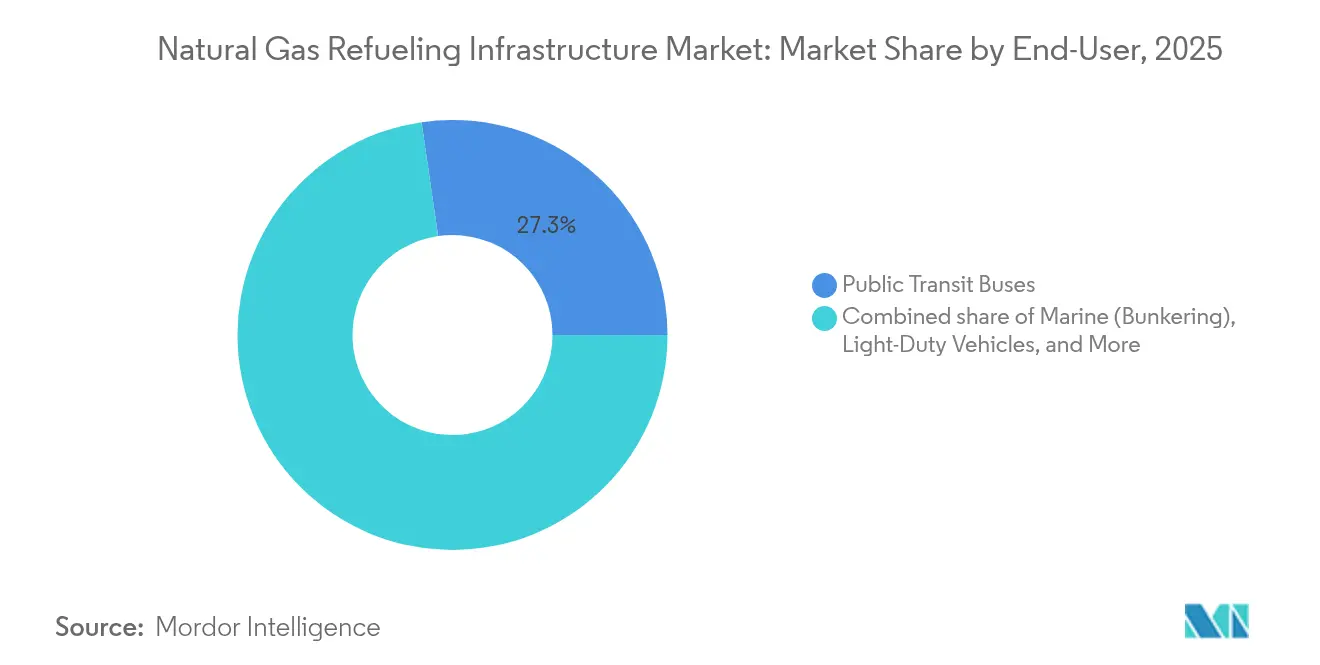
- By end user, Public transit buses represented 27.30% of 2025 end-user revenue; marine bunkering is set to post the fastest 11.1% CAGR to 2031.
- By geography, the Asia-Pacific region commanded a 45.80% revenue share in 2025 and is also forecasted to register the fastest CAGR of 7.41% from 2025 to 2031.
Note: Market size and forecast figures in this report are generated using Mordor Intelligence’s proprietary estimation framework, updated with the latest available data and insights as of 2026.
Market Trends and Insights
Drivers Impact Analysis of Natural Gas Refueling Infrastructure Market*
| Driver | (~) % Impact on CAGR Forecast | Geographic Relevance | Impact Timeline |
|---|---|---|---|
| Stricter HD-vehicle CO₂ rules | +1.8% | North America & EU, spill-over to APAC | Medium term (2-4 years) |
| Lower well-head gas prices vs. diesel | +1.2% | Global, peak in North America | Short term (≤ 2 years) |
| Government fleet-conversion subsidies | +0.9% | North America core, expanding to EU | Medium term (2-4 years) |
| Emerging LNG bunkering corridors | +0.7% | APAC core, MEA & Europe follow | Long term (≥ 4 years) |
| Methane-slip tax credits | +0.4% | North America, led by California | Medium term (2-4 years) |
| AI-optimised station siting | +0.3% | Global, led by NA & EU | Long term (≥ 4 years) |
| Source: Mordor Intelligence | |||
Stricter HD-vehicle CO₂ rules drive infrastructure urgency
Euro VII mandates a 90% NOx reduction for heavy-duty trucks by 2025, while U.S. Phase 3 standards require a 50% CO₂ reduction by 2027, triggering a rapid expansion of the natural gas refueling infrastructure market as fleets seek near-term compliance paths before electric trucks mature(3)Federal Register, “EURO VII & U.S. Phase 3 Standards,” federalregister.gov . Logistics operators in core freight corridors are accelerating the adoption of natural gas vehicles, securing multi-year fuel contracts that underpin station utilization.
Lower well-head gas prices create competitive advantage
The Benchmark Henry Hub fell to USD 2.21/MMBtu in 2024, resulting in fuel savings that reduced conversion payback periods to under two years in North America. Similar trends are observed in Brazil, where new pipelines tied to Vaca Muerta flows are projected to reduce industrial gas rates by 40% in 2025, thereby reinforcing investor confidence in the natural gas refueling infrastructure market.
Government fleet-conversion subsidies accelerate adoption
Federal and state programs worth more than USD 500 million since 2022 reimburse up to 30% of station capex and award USD 1.00 per gallon-equivalent for renewable gas, turning transit agencies and municipal fleets into anchor tenants for new sites(4)Alternative Fuels Data Center, “Alternative Fuel Vehicle Refueling Property Credit (30C),” afdc.energy.gov . Predictable funding streams de-risk cash flows and open underserved corridors to private developers.
Methane-slip tax credits reward low-leak stations
California and select U.S. states now credit operators for verified methane containment, adding margin to stations equipped with advanced compressors and vapor-recovery systems. Investment is flowing toward IoT valves and continuous monitoring, stimulating premium equipment demand(5)U.S. EPA, “40 CFR 1090.1560—Dispensing Natural Gas,” epa.gov .
Restraints Impact Analysis of Natural Gas Refueling Infrastructure Market*
| Restraint | (~) % Impact on CAGR Forecast | Geographic Relevance | Impact Timeline |
|---|---|---|---|
| High CAPEX/permitting delays for LNG stations | -1.1% | Global, acute in EU & APAC | Medium term (2-4 years) |
| Competition from battery-electric hubs | -0.8% | NA & EU core, expanding | Long term (≥ 4 years) |
| Scarcity of cryogenic-grade steel | -0.6% | Global | Short term (≤ 2 years) |
| Insurance premiums for high-pressure assets | -0.4% | Developed markets | Medium term (2-4 years) |
| Source: Mordor Intelligence | |||
High CAPEX and permitting delays constrain LNG expansion
LNG sites cost USD 3-5 million, versus USD 1.8 million for CNG, and European environmental assessments extend approval cycles beyond 24 months, slowing capital rotation within the natural gas refueling infrastructure market. The result is a tilt toward larger, well-capitalized developers and a pause in smaller-scale projects.
Competition from battery-electric charging hubs intensifies
DC fast-charging networks added 6.3% more ports in Q2 2024, and global plans call for 182,000 stations by 2030, diverting funding and real estate away from gas projects. Middle East EV goals illustrate how public policy can redirect capital toward electric corridors at the expense of the natural gas refueling infrastructure industry.
*Our forecasts treat driver/restraint impacts as directional, not additive. The impact forecasts reflect baseline growth, mix effects, and variable interactions.
Natural Gas Refueling Infrastructure Market Segment Analysis
By Natural Gas Type:
Renewable content drives premium growthCompressed natural gas controlled 62.10% of the natural gas refueling infrastructure market in 2025, underpinned by legacy fleets, standardized compressors, and low entry costs. Liquefied natural gas remains essential for long-haul trucking and emerging marine bunkering lanes that cannot meet range needs with CNG alone. Clean Energy Fuels, Petrobras, and regional biogas consortia are scaling digesters and upgrading plants, propelling renewable/bio-CNG to a 19.35% CAGR and widening the natural gas refueling infrastructure market size for low-carbon applications.
The premium attached to carbon credits under U.S. 45Z and California LCFS pays operators an additional margin per therm, shortening the payback period for renewable sites to under four years. Still, a reliable customer base is vital: Brazil’s biomethane plants produced 417,100 m³/day in 2024 but struggled to secure off-takers at premium rates, highlighting price-sensitivity risks within the natural gas refueling infrastructure market.
By Station Type:
Mobile solutions address coverage gapsFast-fill dominated the market with a 42.60% share in 2025, as commercial fleets value 5-minute refuels that mimic diesel behavior. Mobile and portable modules, however, lead growth at 8.72% CAGR, as developers deploy trailer-mounted units to validate demand before building permanent pads, an approach evident in Nigeria’s six-site rollout and Linde’s portable LNG skids.
Time-fill islands continue serving captive bus barns but remain throughput-limited, while combined-fill configurations attract megadepots seeking resilience. The natural gas refueling infrastructure market size for L-CNG hybrid depots is growing in ports that require dual fuel capability, yet high-pressure pumps keep capital expenditures elevated relative to simple CNG rigs.


By Component:
Control systems enable smart operationsCompressors generated 29.00% of 2025 sales, reflecting the frequency of overhauls and the dependence on uptime in CNG stations. Growth, however, tilts toward control and monitoring systems that are projected to climb 9.62% annually, as DOT rules mandate continuous methane tracking and automated shut-offs. Operators view digital twins and leak-sensor arrays as tickets to lower insurance premiums and regulatory fines.
Storage vessels, dispensers, and cooling racks deliver steady, replacement-driven revenue, yet the smart layer is where margins widen. ENOC’s Abu Dhabi flagship is equipped with electronic leak detection, tank gauging, and predictive analytics—capabilities that now set the bar for new entrants in the natural gas refueling infrastructure industry.
By End User:
Marine applications drive premium growthPublic transit buses retained 27.30% of 2025 revenue as grant-funded fleets pursued immediate tailpipe cuts, anchoring urban station utilization. Marine bunkering, however, records an 11.1% CAGR thanks to IMO sulfur caps and deep-water hub investments; Sohar, Vancouver, and Singapore’s capacity upgrades signal a long runway for LNG demand in shipping lanes.
Medium- and heavy-duty trucks remain the volume backbone, but their growth is more modest as battery ranges continue to creep upward. Rail and industrial fleets provide niche but stable demand, while light-duty consumer adoption of CNG declines amid EV proliferation—trends that shape investment focus within the broader natural gas refueling infrastructure market.
Geography Analysis
APAC Natural Gas Refueling Infrastructure Market
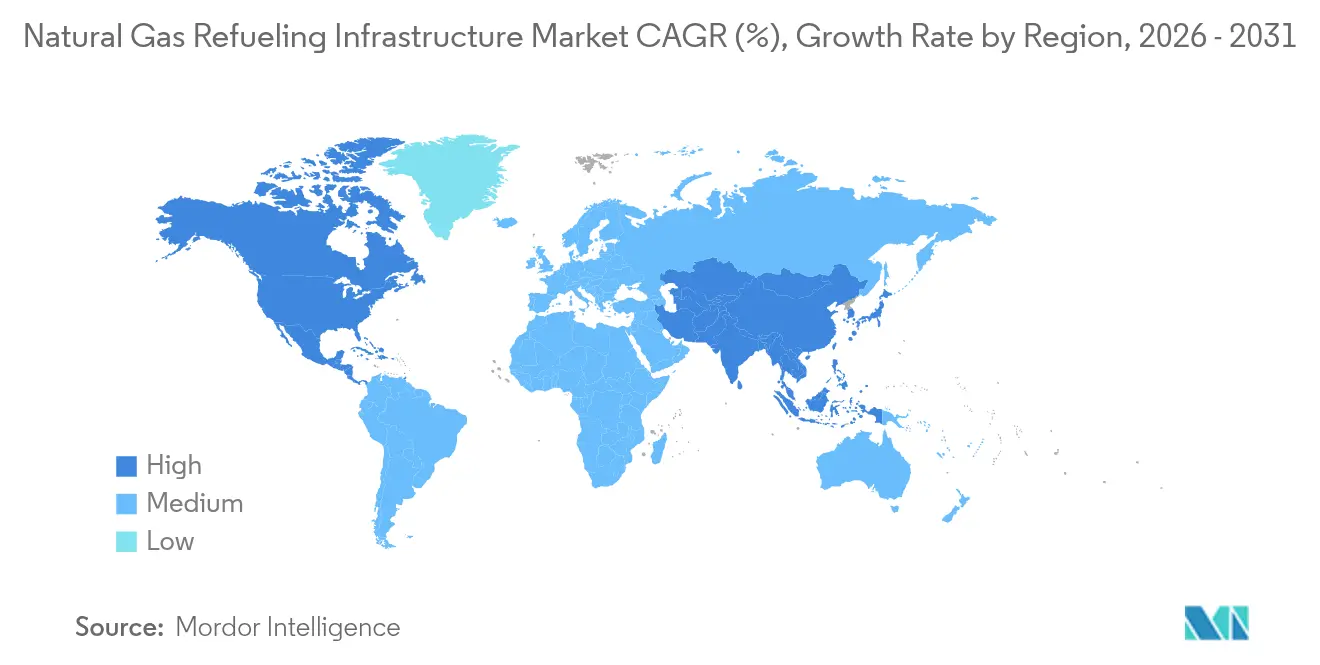
Asia-Pacific commanded a 45.80% natural gas refueling infrastructure market share in 2025, and the region is forecast to advance at a 7.41% CAGR through 2031 as China couples record reserve additions with its status as the world’s largest LNG importer. Government air-quality mandates and subsidy programs continue to funnel capital toward urban bus and logistics corridors, while LNG export hubs from Australia and Qatar reinforce regional supply security. India’s city-gas build-out and Japan’s diversification away from nuclear power add further tailwinds, creating a dense station pipeline that elevates the natural gas refueling infrastructure market size across South and East Asia.
North America Natural Gas Refueling Infrastructure Market
North America ranks second, thanks to its abundant shale output, which pushed Henry Hub prices to USD 2.21/MMBtu in 2024 and delivered 40-60% pump-price savings compared to diesel for fleet operators. More than USD 500 million in federal transit grants since 2022 have underwritten large CNG depots for public agencies, while California’s methane-slip tax credits accelerate upgrades to low-leak equipment. Canada leverages its Western Canadian Sedimentary Basin to supply both domestic fleets and emerging West-Coast LNG bunkering sites, and Mexico’s energy-reform pipeline projects open fresh corridors for mobile CNG modules.
EMEA and South America Natural Gas Refueling Infrastructure Market
Europe balances some of the world’s strictest vehicle-emission limits with high capital expenditure hurdles; nevertheless, Euro VII rules, effective 2025, compel freight operators to adopt natural gas until battery ranges improve, driving incremental station demand despite lengthy permitting cycles. Germany’s plan to expand LNG stations to 200 by 2025, the Netherlands’ focus on bio-CNG, and Scandinavia’s port-based bunkering clusters illustrate how national strategies differ yet converge on low-carbon gas solutions. South America shows pockets of momentum: Brazil’s pipeline link to Sergipe’s private LNG terminal, combined with Petrobras’ biomethane tender, is expected to cut delivered gas prices by 40% in 2025 and widen access for inland fleets. In the Middle East and Africa, ADNOC’s low-carbon Ruwais LNG project and Nigeria’s six-site CNG rollout highlight how state-backed initiatives can seed rapid network growth in export-oriented economies.

Regulatory Landscape
Global regulation for natural gas refueling infrastructure is increasingly tied to harmonized technical standards and corridor-based planning. In January 2026, ISO published ISO 16923:2026 (CNG stations) and ISO 16924:2026 (LNG stations), which codify design, safety, and operational requirements that OEMs and station developers use to support compliance and interoperability across jurisdictions.
In Europe, Regulation (EU) 2023/1804 (AFIR) provides the policy framework and technical requirements for alternative fuels infrastructure, shaping where heavy-duty corridor gaps are prioritized and how stations are specified. In the United States, 23 U.S.C. 151 provides the federal basis for designating alternative-fuel corridors (including natural gas), while federal methane control requirements and codes such as NFPA 52 raise the compliance bar for monitoring, inspection, and station safety practices, directing capex toward certified leak detection and control systems.
Competitive Landscape
The natural gas refueling infrastructure industry remains moderately fragmented, with the top five suppliers of compressors, storage tanks, and integrated EPC services controlling approximately 45-50% of the global revenue. This creates an opportunity for regional specialists to win localized contracts. Large incumbents, such as Chart Industries and Parker Hannifin, defend their share through vertical portfolios that span cryogenic pumps, dispensers, and project financing, giving them pricing leverage on multi-station deals. Smaller entrants differentiate through mobile skid solutions, AI-enabled siting software, and turnkey bio-CNG packages that reduce customer payback periods.
Strategic partnerships shape competitive dynamics. Hexagon Agility’s USD 4.3 million order book for Class 8 RNG systems locks in fuel-supply volumes for Clean Energy Fuels, while Westport Fuel Systems’ divestiture of its light-duty business frees capital to double down on heavy-duty HPDI engine kits. Equipment suppliers are increasingly bundling sensor suites and cloud monitoring subscriptions, which lifts recurring-revenue ratios and creates switching costs for fleet operators.
Regulation also tilts the field. The 2025 U.S. DOT methane-detection rule favors vendors with certified leak-detection technology, while the 2026 update to NFPA 52 on cylinder inspection frequencies raises the technical bar for newcomers. Meanwhile, insurers offering premium discounts for stations with predictive analytics dashboards reward operators that invest in smart controls, reinforcing a virtuous cycle for technology-rich incumbents and nudging the market toward higher concentration over time.
Natural Gas Refueling Infrastructure Industry Leaders
Clean Energy Fuels
Parker Hannifin Corp (Veriflo & Bestobel)
Chart Industries
Gilbarco Veeder-Root
Tatsuno Corporation
- *Disclaimer: Major Players sorted in no particular order

Natural Gas Refueling Infrastructure Market Companies Covered in this Report
- Clean Energy Fuels
- Parker Hannifin Corp
- Chart Industries
- Gilbarco Veeder-Root
- Tatsuno Corp
- Scheidt & Bachmann
- Sanki Industry Group
- Greka Engineering
- Tulsa Gas Technologies
- Cryostar SAS
- FTI International Group
- Westport Fuel Systems
- Agility Fuel Solutions
- Galileo Technologies
- Landi Renzo
- Kraus Global
- Hexagon Agility
- Bennett Pump
- WEH GmbH
- HAM Group
Read Analysis of Natural Gas Refueling Infrastructure Companies

Market Opportunities and Future Outlook
White-space is most visible where governments and fleet operators are building corridor coverage for medium- and heavy-duty vehicles, particularly in geographies where pipeline access is constrained. Nigeria has publicly stated a target of 2,322 CNG stations by 2027 (with dozens active and more in development), and in June 2026 the Federal Executive Council approved NGN 215 billion for 200 CNG-powered buses and program expansion, supporting anchor demand for new and upgraded sites. East Africa is also funding non-pipeline solutions, with Tanzania earmarking TZS 22.06 billion for mobile CNG stations across multiple regions, which reinforces the role of trailer-based and modular deployments for early market creation.
Near-term opportunities also concentrate in heavy-duty LNG networks and renewable gas refueling where supply arrangements and integrated developer models can compress build cycles. In India, GreenLine Mobility Solutions announced in May 2026 an investment of INR 1,500 crore to expand its LNG station network from 7 stations to 50, and Essar Green Mobility outlined a January 2026 plan combining 30,000 clean trucks with 100 LNG and EV hubs, pointing to multi-fuel station formats that share real estate, power, and control systems. In North America, a June 2026 US DOE (HGEO) blanket authorization enabling Irving Oil Terminals to import up to 58 Bcf of CNG from Canada by truck highlights a logistics pathway for supplying satellite or remote demand centers, supporting additional use cases for mobile and virtual-pipeline refueling infrastructure.
Recent Industry Developments in Natural Gas Refueling Infrastructure Market
- May 2026: Clean Energy Fuels opened six new renewable natural gas (RNG) stations positioned on key US freight corridors. The build-out improves corridor coverage for heavy-duty fleets and raises utilization potential for fast-fill assets tied to contracted fleet demand.
- October 2025: Chart Industries was selected to supply air-cooled heat exchangers, brazed aluminum heat exchangers, and cold boxes for Sempra Infrastructure’s Port Arthur LNG Phase 2 project in Texas. The award supports additional LNG supply capacity and reinforces demand for cryogenic equipment used in LNG fueling and bunkering.
- October 2024: ExxonMobil selected Chart Industries’ IPSMR liquefaction process technology and proprietary equipment for the Rovuma LNG project in Mozambique. The selection reflects continued investment in large-scale LNG infrastructure that can expand global LNG availability and, in turn, support downstream LNG refueling and marine bunkering build-outs.


Natural Gas Refueling Infrastructure Market Report Scope and Research Methodology
Market Definition and Coverage
This market covers revenue generated from building and equipping natural gas refueling sites that dispense vehicle fuel, along with the core station systems needed to operate safely and reliably across public and private use cases.
Scope exclusions: It excludes upstream natural gas production, long-distance pipelines, and routine vehicle maintenance that is not tied to station infrastructure.
Segments Covered in This Report
- By Natural Gas Type
- Compressed Natural Gas (CNG)
- Liquefied Natural Gas (LNG)
- Renewable/Bio-CNG
- Liquefied-Compressed NG (L-CNG)
- By Station Type
- Fast-fill
- Time-fill
- Combined-fill
- Mobile/Portable
- LNG Bunkering Station
- L-CNG Station
- By Component
- Compressors
- Dispensers
- Storage Tanks
- Cooling/Temperature Mgmt.
- Control and Monitoring Systems
- Auxiliary Equipment
- By End User
- Light-Duty Vehicles
- Medium and Heavy-Duty Road Fleet
- Public Transit Buses
- Marine (Bunkering)
- Rail
- Industrial and Commercial Fleet
- By Geography
- North America
- United States
- Canada
- Mexico
- Europe
- Germany
- United Kingdom
- France
- Italy
- NORDIC Countries
- Russia
- Rest of Europe
- Asia-Pacific
- China
- India
- Japan
- South Korea
- ASEAN Countries
- Australia and New Zealand
- Rest of Asia-Pacific
- South America
- Brazil
- Argentina
- Rest of South America
- Middle East and Africa
- Saudi Arabia
- United Arab Emirates
- South Africa
- Egypt
- Rest of Middle East and Africa
- North America
Data Sources, Market Sizing, and Validation
Desk Research
Desk research was used to set the base environment and to avoid guessing on inputs that can be observed. We referenced public sources such as the IEA, the US EIA, the US Department of Transportation datasets where relevant, Eurostat, and national statistics portals in key gas-vehicle countries to track vehicle parc, gas demand signals, and station rollouts.
The build also relied on technical and market signals from sources like NFPA code references, equipment efficiency notes in peer-reviewed papers, customs and trade statistics for station equipment flows, and company filings and investor presentations that describe capex plans and station additions. For cross-checks, we also used paid subscriptions for company financials and intelligence, patent databases, and an import-and-export shipment-level database when trade data was needed to sanity check station equipment movement. These examples are illustrative, and many other sources were reviewed for data collection, validation, and clarification.
Primary Interviews and Surveys
Primary work focused on interviews and structured surveys with station developers, equipment suppliers, and downstream fleet operators, so that adoption triggers and real station economics could be tested. Because this is a global market, we spoke across APAC, EMEA, and the Americas to confirm how policy support, fuel price spreads, and heavy-duty corridor buildouts are translating into station orders and project timelines.
Distribution of primary research fieldwork respondents
| Company type | Respondent position | Region |
|---|---|---|
| Top tier: 36% | CXOs: 15% | APAC: 46% |
| Mid tier: 44% | Functional/Unit leaders: 37% | EMEA: 34% |
| Smaller Players: 20% | Managers: 48% | Americas: 20% |
Market-Sizing & Forecasting
Sizing starts with a top-down build that reconstructs station infrastructure spend by linking the addressable fueling demand pool to active station counts and typical station capex and upgrade cycles. To keep the totals realistic, the model is then corroborated with selective bottom-up approximations, such as sampled station project values, equipment ASP times typical bill-of-materials volumes, and channel checks on order pipelines, and then adjustments are made where gaps are found.
Key inputs used include natural gas vehicle parc growth by major country, public versus private station mix, average station throughput assumptions by station type (fast-fill, time-fill, and combined-fill), component cost trends for compressors, dispensers, and storage, and the pace of LNG corridor and bunkering site additions where applicable. For the forecast, scenario analysis is used, because adoption can move quickly when policy support, fuel price spreads, and fleet commitments line up. Experts also help set realistic ranges for station commissioning and utilization. When local data is thin, proxy indicators like corridor project announcements, permitting activity, and equipment import patterns are used, and the assumptions are re-tested during validation calls.
Data Validation & Update Cycle
Outputs are checked through multiple steps, starting with internal logic tests and then external signal comparison, such as whether implied stations per vehicle and implied capex per site look reasonable for each region. Variances are flagged, and outliers are reviewed again at the input level before sign-off, so errors do not get hidden by aggregation.
If a major policy change, a large station network announcement, or an unexpected swing in equipment pricing is observed, we re-contact sources to confirm what has changed and whether the assumptions still hold. Reports are refreshed annually, and material events can trigger interim updates. Before delivery, a final analyst pass is done so the numbers reflect the latest available market signals.
Mordor Intelligence's Natural Gas Refueling Infrastructure Market Size Versus Other Published Estimates
Published estimates for this market can look far apart, even when the growth story sounds similar. The spread usually comes from differences in what is counted as infrastructure revenue, how station value is measured, and how quickly assumptions are refreshed as new stations get commissioned.
Some published figures appear to bundle wider fueling networks and adjacent gas handling systems, which can inflate the total when compared against a stations-first view. In Mordor Intelligence, the value is counted only when it ties to refueling site buildout and core station components across CNG, LNG, and related formats, and upstream gas assets are not added into the same total.
Benchmark comparison
| Source | Market Size | Gaps in Research Methodology |
|---|---|---|
| Mordor Intelligence | USD 25.38 B (2025) | |
| Industry Publisher A | USD 66.77 B (2024) | The figure is likely broadened by counting a wider set of refueling network spend and supporting gas handling infrastructure, and it also uses a different base year that can shift currency timing and price assumptions. |
| Research Outlet B | USD 7.69 B (2025) | This estimate appears narrower, often reflecting a tighter definition around select station builds or limited component coverage, which can understate spending when upgrades, monitoring systems, and auxiliary equipment are treated as out of scope. |
Taken together, the table shows that scope choices drive most of the difference, and year selection adds another layer through inflation and currency conversion timing. By tying the model to observable station buildout activity and cross-checking assumptions with interviews, our estimate stays traceable to practical demand and spend drivers that can be repeated and audited.


Key Questions Answered in the Report
How large is the natural gas refueling infrastructure market in 2026?
The market is valued at USD 27.02 billion in 2026 and is projected to reach USD 36.98 billion by 2031.
Which region leads station deployment?
Asia-Pacific holds 45.80% of global installations, buoyed by Chinese LNG demand and coordinated policy support.
What segment grows fastest through 2031?
Renewable/bio-CNG stations post a 19.35% CAGR, lifted by U.S. 45Z credits and European carbon-credit premiums.
Why are mobile or portable stations gaining traction?
Developers use trailer-mounted units to test demand in underserved corridors before committing permanent capex, driving an 8.72% CAGR for this format.
How do new methane-leak rules affect operators?
U.S. DOT regulations mandate continuous monitoring, prompting station owners to invest in advanced control systems that cut emissions and lower insurance costs.
What drives the surge in marine bunkering installations?
IMO sulfur limits and multi-billion-dollar LNG hub investments in ports such as Sohar and Vancouver push marine applications to an 11.1% CAGR.
Page last updated on:


 Your data is secure and never sold or shared.


