
Narrowband IoT Market Size and Share
Market Overview
| Study Period | 2020 - 2031 |
|---|---|
| Market Size (2026) | USD 13.62 Billion |
| Market Size (2031) | USD 51.82 Billion |
| Growth Rate (2026 - 2031) | 30.62 % |
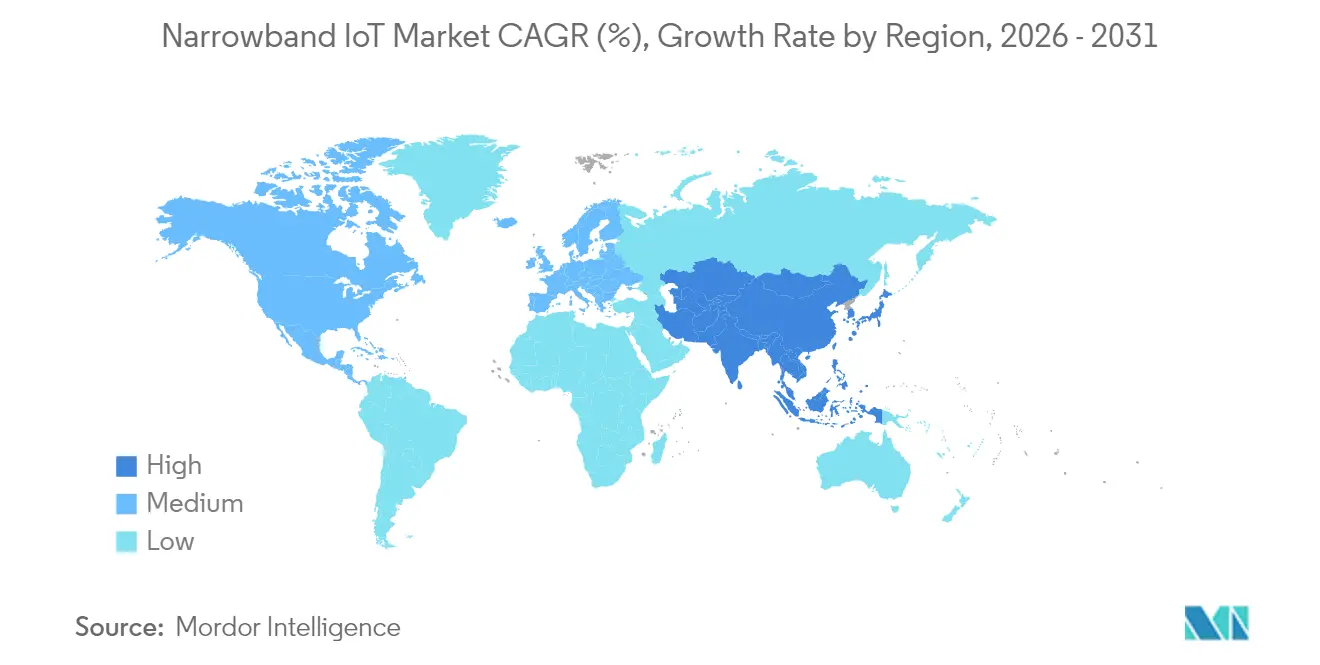
| Fastest Growing Market | Asia Pacific |
| Largest Market | Asia Pacific |
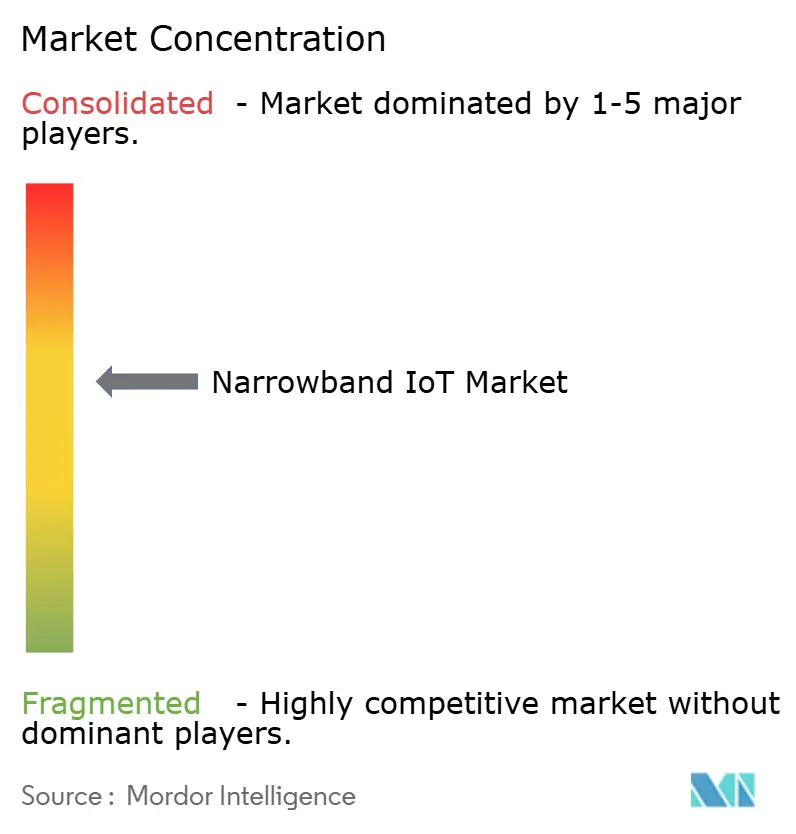
| Market Concentration | Medium |
Major Players *Disclaimer: Major Players sorted in no particular order Image © Mordor Intelligence. Reuse requires attribution under CC BY 4.0. | |
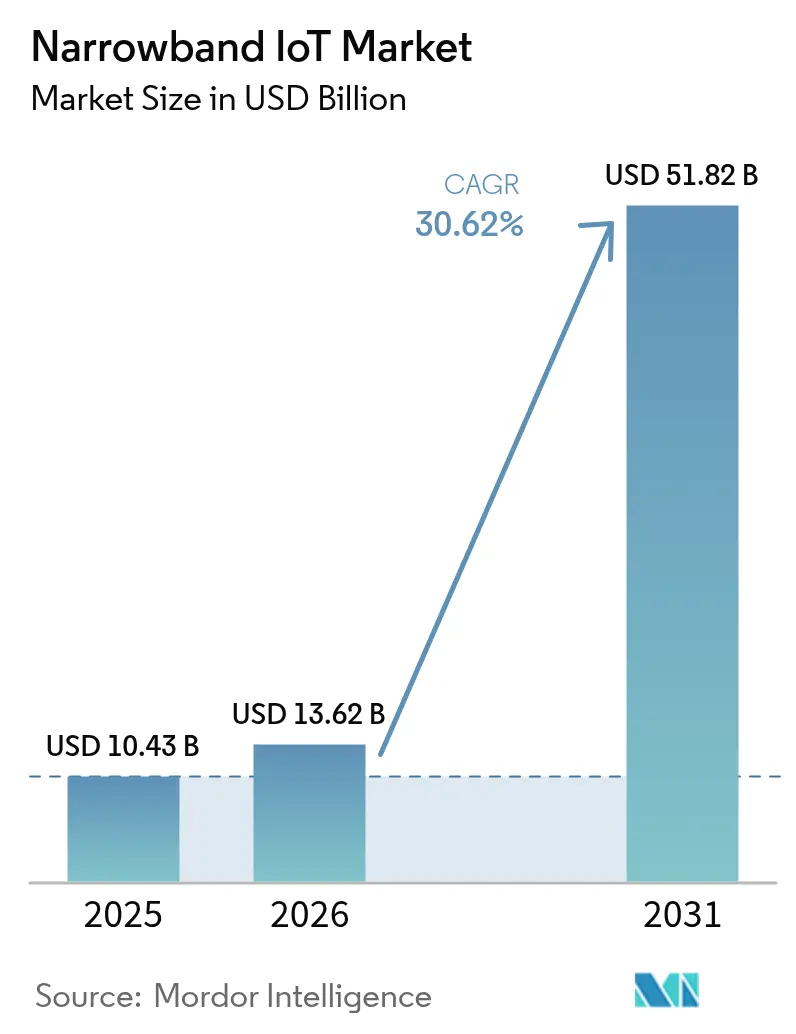
Narrowband IoT Market Analysis by Mordor Intelligence
Narrowband IoT market size in 2026 is estimated at USD 13.62 billion, growing from 2025 value of USD 10.43 billion with 2031 projections showing USD 51.82 billion, growing at 30.62% CAGR over 2026-2031.
This growth reflects converging demand for ultra-low-power devices, government-mandated smart infrastructure, and the strategic use of satellite links that extend coverage beyond terrestrial footprints. Operators are prioritizing guard-band spectrum efficiencies and 5G NR-RedCap migration paths that safeguard long-term investments while broadening service portfolios. Technical fragmentation between major infrastructure vendors remains a headwind yet falling module prices and battery lifetimes approaching 10 years continue to unlock high-volume applications in utilities, logistics, and agriculture. The NB-IoT market is therefore progressing from network-centric roll-outs toward device-driven scale as module ASPs slide below USD 3.00.
Key Report Takeaways
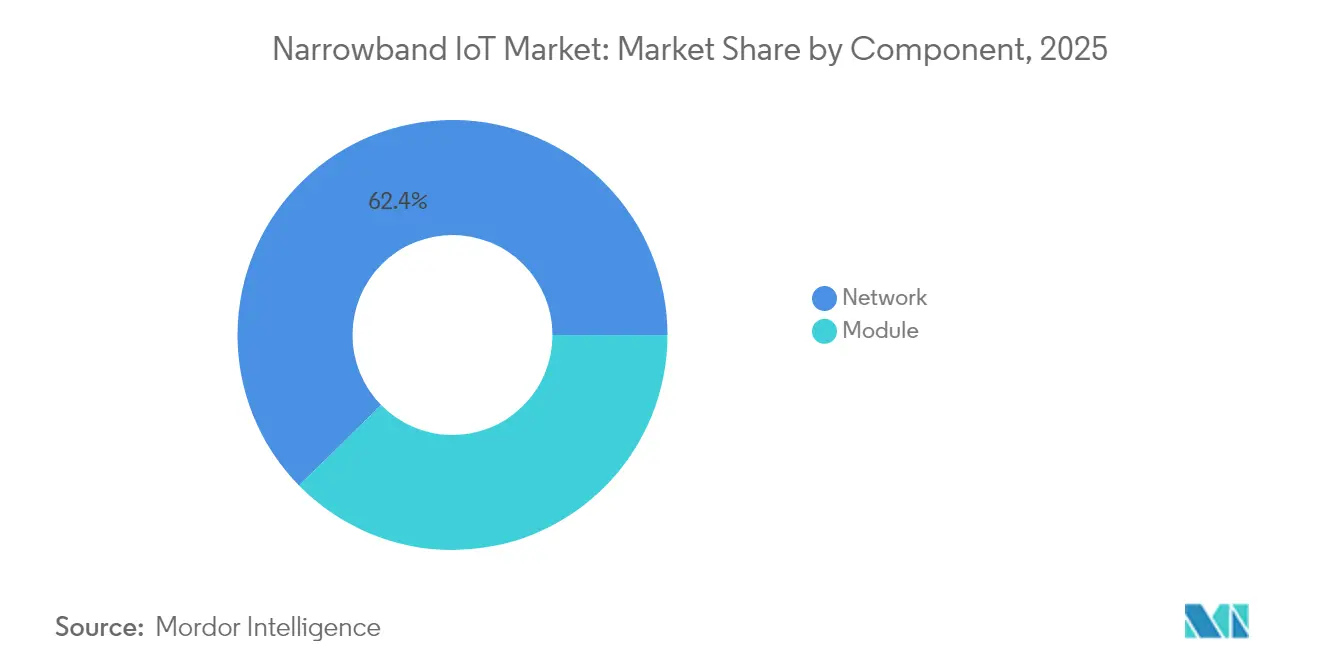
- By component, network infrastructure led with 62.35% revenue share in 2025, while modules are set to rise at 32.55% CAGR through 2031.
- By deployment, stand-alone configurations held 46.65% of NB-IoT market share in 2025; guard-band solutions are on track for a 34.10% CAGR to 2031.
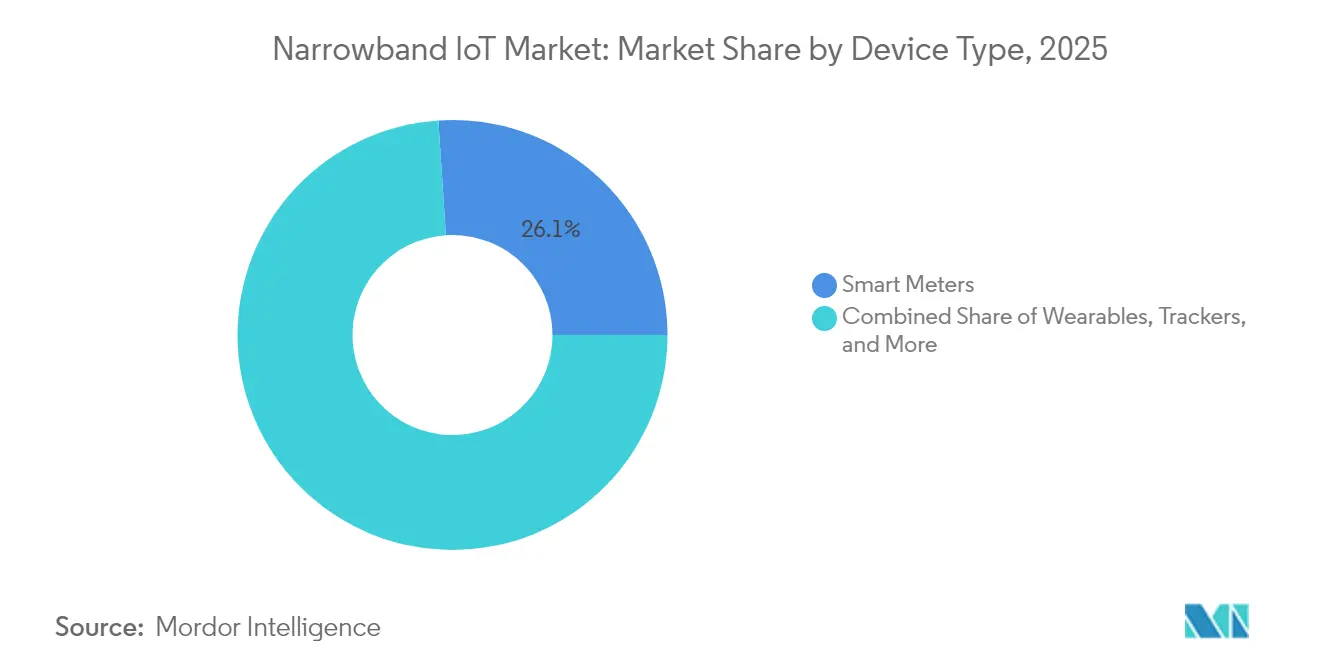
- By device type, smart meters commanded 26.05% of the NB-IoT market size in 2025, and trackers are forecast to expand at 32.12% CAGR to 2031.
- By application, energy and utilities captured 28.25% revenue in 2025, while agriculture and livestock are positioned for a 32.40% CAGR through 2031.
- Regionally, Asia Pacific accounted for 51.75% revenue in 2025 and is projected to grow at 33.92% CAGR through 2031.
Note: Market size and forecast figures in this report are generated using Mordor Intelligence’s proprietary estimation framework, updated with the latest available data and insights as of 2026.
Market Trends and Insights
Drivers Impact Analysis of Narrowband IoT Market*
| Driver | (%) Impact on CAGR Forecast | Geographic Relevance | Impact Timeline |
|---|---|---|---|
| Ultra-low power consumption extends battery life | +4.20% | Global, strongest in APAC and Europe | Medium term (2–4 years) |
| Falling NB-IoT module ASPs below USD 3 | +6.80% | Global, notably APAC and Africa | Short term (≤ 2 years) |
| Government-mandated LPWAN roll-outs for smart metering | +5.10% | Europe, North America, Australia | Medium term (2–4 years) |
| Government incentives for smart agriculture and digitisation | +3.90% | APAC core, Australia, select EU markets | Long term (≥ 4 years) |
| Satellite-augmented NB-IoT for remote assets | +2.7% | Global, maritime, mining, and remote farming | Long term (≥ 4 years) |
| 5G NR-RedCap roadmap continuity | +1.8% | Global, led by North America and Europe | Long term (≥ 4 years) |
| Source: Mordor Intelligence | |||
Ultra-low power consumption extends battery life
Devices can operate for up to 10 years on a single battery by leveraging eDRX, PSM, and Early Data Transmission that collectively cut energy draw and latency[1]. Field tests show Pre-Configured Uplink Resources lower energy use 2.5 times and lengthen battery life 1.6 times under dense traffic. This power profile reshapes utility economics because battery replacement often exceeds hardware cost. Support for 50,000 devices per cell adds scale without compromising endurance, validating NB-IoT market adoption across remote metering.
Falling NB-IoT module ASPs below USD 3, enabling mass adoption
Manufacturing scale and integrated chipsets pulled average module prices beneath USD 3.00, unlocking cost-sensitive sectors such as environmental sensing and asset tracking. Subscription fees have also fallen to USD 0.50 per month, giving NB-IoT market propositions parity with unlicensed LPWAN alternatives[2]. World-mode modems now deliver global band support, letting OEMs certify once and ship worldwide, accelerating device volumes in emerging regions.
Government-mandated LPWAN roll-outs for smart metering
EU energy efficiency rules and Australia’s USD 30 million On-Farm Connectivity Program guarantee steady demand for NB-IoT deployments in water and electricity metering. NB-IoT’s 20 dB coverage gain versus GSM ensures basement meters reliably communicate without repeaters. Mandatory timelines give suppliers volume certainty, sustaining the NB-IoT market over multi-year roll-out horizons.
Government incentives for smart agriculture and rural digitisation
Australia’s USD 48 million Farms of the Future and Victoria’s USD 10 million On-Farm IoT Trial subsidise sensors for soil, water, and livestock monitoring. Europe’s 5GAGRIHUB likewise funds precision-farming pilots. Deep coverage and decade-long batteries suit remote paddocks where power and backhaul are scarce, widening NB-IoT market penetration into rural economies.
Restraints Impact Analysis of Narrowband IoT Market*
| Restraint | (%) Impact on CAGR Forecast | Geographic Relevance | Impact Timeline |
|---|---|---|---|
| Competition from LTE-M and unlicensed LPWAN | -3.40% | North America, Europe, Australia | Short term (≤ 2 years) |
| Limited downlink throughput is hindering OTA updates | -2.10% | Global | Medium term (2–4 years) |
| A fragmented spectrum complicates global roaming | -1.9% | Global | Medium term (2–4 years) |
| Unproven revenue-sharing models | -1.6% | Global | Long term (≥ 4 years) |
| Source: Mordor Intelligence | |||
Competition from LTE-M and unlicensed LPWAN (LoRa, Sigfox)
AT&T’s sunset of NB-IoT and migration to LTE-M highlights operator preference for higher data rates and better mobility when serving moving assets. LoRa’s forecast of 1.3 billion connections by 2030 underscores the private-network attraction for enterprises that need full control. This dual competitive front narrows the NB-IoT market focus to stationary, deep-coverage use cases unless throughput improvements materialise.
Limited downlink throughput is hindering OTA firmware updates
NB-IoT’s 250 kbps cap strains security patch delivery for industrial devices, forcing staggered update windows that prolong risk exposure. Dense networks exacerbate collisions and competing LPWANs now offer broadcast update modes that slash transfer times. Operators trial CoAP/UDP to optimise bandwidth, yet the structural ceiling remains a brake on adoption in smart-city segments needing frequent firmware refreshes.
*Our forecasts treat driver/restraint impacts as directional, not additive. The impact forecasts reflect baseline growth, mix effects, and variable interactions.
Narrowband IoT Market Segment Analysis
By Component:
Network Infrastructure Drives Current RevenueNetwork infrastructure generated 62.35% of 2025 revenue as operators upgraded cores and radios to support massive device density. This spending reflects the early phase of the NB-IoT market when coverage and capacity build outweigh device volumes. Modules, however, are projected to compound at 32.55% annually through 2031 as falling ASPs shift value downstream to OEMs. Integrated SoCs reduce bill-of-materials and simplify certification, enabling sub-USD 3.00 price points that catalyse high-volume roll-outs. Consumption-based 5G core services from cloud partnerships let carriers defer capex, altering the spending mix toward modules and backend analytics during the forecast window.
A maturing supply chain now offers chipset reference designs and turnkey antenna packages, lowering barriers for new entrants. The NB-IoT industry thus pivots from capacity expansion to application enablement, underscoring a gradual revenue transition from infrastructure to devices and data services.

By Deployment:
Stand-alone Leads Despite Guard-band AccelerationStand-alone deployments held 46.65% revenue in 2025 because utilities and industrial users favour predictable performance in dedicated spectrum. China’s national smart-meter campaign reinforced this preference, anchoring early NB-IoT market growth on independent carriers. Guard-band strategies are accelerating at 34.10% CAGR as operators reclaim unused LTE buffers, aligning with European policy that prioritises spectral efficiency. In-band options act as midway solutions where guard bands are scarce, balancing coverage with legacy traffic coexistence.
Operators increasingly model spectrum value against expected device density, pushing guard-band adoption in markets with moderate scale. Conversely, mission-critical applications retain stand-alone designs due to isolation benefits. This duality will persist, shaping region-specific deployment blends that maximise both performance and asset utilisation.
By Device Type:
Smart Meters Dominate While Trackers SurgeSmart meters captured 26.05% of NB-IoT market share in 2025 as regulatory timelines mandated nationwide roll-outs. Deep indoor penetration and decade-long batteries address basement installations impractical for higher-frequency 5G. Trackers, however, are poised for a 32.12% CAGR because satellite-augmented modules unlock global logistics, wildlife monitoring, and remote asset visibility. Wearables adopt NB-IoT for extended health-monitor lifetimes, while alarms leverage a reliable uplink during emergencies.
Device makers add multi-mode and pin-compatible footprints that let customers toggle between NB-IoT, RedCap, and LTE-M as service availability evolves. This flexibility mitigates technology-lock concerns and widens the NB-IoT market addressable base beyond fixed metering.
By Application:
Energy Utilities Lead While Agriculture AcceleratesEnergy and utilities generated 28.25% of 2025 revenue, driven by advanced metering infrastructure and grid modernisation goals. Coverage into subterranean vaults plays to NB-IoT strengths, while long lifecycles align with utility planning horizons. Agriculture and livestock sensors are forecast to climb 32.40% annually through 2031 as subsidy programmes defray capital outlays for remote soil and herd monitoring. Smart-city lighting, parking, and environmental networks also expand steadily, supported by municipal climate and safety initiatives.
Transportation operators adopt hybrid terrestrial-satellite NB-IoT for container telemetry outside cellular footprints, reducing cargo loss and streamlining customs. Industrial factories employ vibration and temperature sensors to detect failures early, decreasing downtime. Retail vending units integrate low-cost modules that reconcile inventory automatically, demonstrating the NB-IoT market's versatility across verticals.
Geography Analysis
APAC Narrowband IoT Market
Asia Pacific accounted for 51.75% revenue in 2025, owing to China Mobile’s 890 million managed connections and a 90% 5G penetration rate achieved by 2023. Industrial policy and massive public-sector tenders create predictable demand pipelines that foster supplier scale. India and Japan now pilot nationwide smart-meter projects, positioning them as secondary growth engines within the region. As stand-alone deployments mature, carriers pivot to guard-band optimisation to accommodate surging device counts without fresh spectrum auctions.
North America Narrowband IoT Market
North America faces strategic realignment after AT&T’s NB-IoT exit, yet T-Mobile and Verizon continue to support nationwide footprints, resulting in a mixed competitive landscape. Government infrastructure grants for water and gas meter upgrades partially offset consolidation risk. Emerging RedCap trials provide a future-proofing narrative that could stabilise carrier commitments over the medium term.
Europe Narrowband IoT Market
Europe maintains steady growth anchored in regulatory mandates for energy efficiency and environmental monitoring. Operators integrate NB-IoT into cross-border roaming arrangements despite fragmented spectrum, while guard-band deployments maximise scarce sub-1 GHz assets. Public-private projects in conservation, such as Vodafone’s endangered species tracking, demonstrate social-impact use cases that sustain adoption.
Regulatory Landscape
NB-IoT regulation remains anchored on 3GPP LTE Release 13 device and network requirements, but device security baselines and country-specific conformity assessment increasingly shape market access. In the United States, NIST expanded guidance for IoT device cybersecurity with NIST IR 8259r1 (2026), reinforcing procurement and assurance expectations that influence how NB-IoT modules, firmware, and cloud backends are specified for public-sector and critical-infrastructure deployments.
Regional radio and compliance rules are also moving toward broader technology neutrality and updated terminal requirements. In Europe, CEPT work on the 900 MHz and 1800 MHz bands and subsequent European Commission actions support technology-neutral frameworks that can accommodate narrowband technologies alongside NB-IoT, which affects operator choices between stand-alone, in-band, and guard-band deployments. In Asia, markets continue to apply dedicated NB-IoT user equipment requirements (for example, Vietnams QCVN 131:2022/BTTTT for E-UTRA NB-IoT user equipment), while certification programs such as PTCRB continue updating device test plans (NAPRD03 updates in 2026), impacting time-to-market for globally shipped modules and devices.
Value Chain Analysis
The NB-IoT value chain runs from cellular standards and spectrum planning through silicon, modules, device OEMs, connectivity providers, and application platforms used by utilities, cities, and enterprises. Upstream, fabless chipset designers and IP providers supply baseband and RF designs that are manufactured at foundries (including TSMC, UMC, Samsung, and SMIC) and assembled and packaged by OSAT players (such as ASE Group, Amkor, and JCET). Midstream module vendors (for example, Quectel and Fibocom) integrate chipsets, RF front ends, antennas, and SIM/eSIM capability, then move through certification regimes (FCC/CE/RED and operator programs such as PTCRB) before devices are integrated into meters, trackers, alarms, and sensors.
Downstream value is captured by mobile network operators and MVNO/IoT connectivity providers that package NB-IoT plans, device management, and roaming, with satellite partners playing a growing role to extend coverage where terrestrial footprints end. Examples include Nordic Semiconductor partnering with Skylo (February 2025) to certify the nRF9151 module for satellite network services, and operator-side NTN integrations such as Vodafone IoT working with Iridium (November 2025) and Deutsche Telekom integrating Iridium NTN Direct (announced for 2026 service delivery). Key bottlenecks include RF-capable mature-node capacity (28 nm/40 nm), and the cost and lead time of multi-region certification and operator acceptance testing, which can constrain smaller OEMs even as module prices fall.
Competitive Landscape
Vendor incompatibility between Ericsson and Huawei created multiple software variants that complicate multinational roll-outs and elevate integration costs. This technical schism gives LoRa and LTE-M an opening where simplicity and roaming continuity rank high. Chinese infrastructure markets remain largely domestic, allowing Huawei, ZTE, and China Mobile to dictate specifications, whereas Western carriers diversify suppliers to hedge against lock-in.
Strategy now emphasises hybrid connectivity. Quectel-Skylo and OQ Technology-Transatel collaborations provide seamless NTN fallback, ensuring service continuity in deserts, oceans, and polar routes. Module vendors launch pin-compatible RedCap designs that preserve current NB-IoT certifications while offering future upgrade paths. Operators test consumption-based 5G-core services that lower entry costs for smaller utilities and municipalities, democratising the NB-IoT market to second-tier service providers.
Price competition intensifies at the silicon layer. MediaTek’s World-Mode modem undercuts incumbents, while Qualcomm’s industrial-grade IQ series targets extreme-environment use cases. Chipset roadmaps now include AI inference engines that enable on-device anomaly detection, reducing uplink traffic and offsetting throughput constraints. The combined effect is a moderate-concentration market where innovation cycles and multi-mode flexibility outweigh raw scale.
Narrowband IoT Industry Leaders
-
Huawei Technologies Co., Ltd
-
Ericsson Corporation
-
Qualcomm Technologies
-
AT&T Inc
-
Verizon Communications Inc.
- *Disclaimer: Major Players sorted in no particular order
Narrowband IoT Market Companies Covered in this Report
- Huawei Technologies Co., Ltd
- Ericsson
- Nokia Corporation
- Qualcomm Technologies
- MediaTek Inc.
- Intel Corporation
- Sony Semiconductor (Altair Chipset)
- Sierra Wireless
- Telit IoT Platforms
- Quectel Wireless Solutions
- u-blox AG
- Fibocom Wireless
- China Mobile
- China Telecom
- Vodafone Group Plc
- Deutsche Telekom AG
- ATandT Inc.
- Verizon Communications Inc.
- Telefonica S.A.
- Orange S.A.
- T-Mobile US, Inc.
- Twilio Inc.
Market Opportunities and Future Outlook
A key whitespace for NB-IoT is solutions that pair deep-coverage, long-life sensors with standardized satellite extension for off-grid assets, reducing the connectivity gap for logistics, agriculture, mining, and maritime telemetry. Recent operator and ecosystem moves provide a basis for this direction, including Vodafone IoT partnerships covering NTN NB-IoT connectivity with Iridium in November 2025 and Skylo in February 2026, and Deutsche Telekoms announced integration of Iridium NTN Direct to offer NB-IoT service with satellite reach in 2026. This hybrid model creates commercial space for module makers and device OEMs to ship a single hardware platform that can operate on terrestrial NB-IoT and fall back to NTN where needed, particularly for trackers and other remote monitoring endpoints.
Another opportunity is compliance-led refresh cycles in regulated metering and public infrastructure, where cybersecurity baselines and updated terminal requirements influence procurement and redesigns. NIST IR 8259r1 (2026) provides a reference framework used across many IoT security discussions, while evolving European spectrum conditions in bands such as 900 MHz support more technology-neutral narrowband operation, giving operators flexibility in hosting narrowband services. On the standards roadmap, 3GPP Release 19 was finalized in December 2025 with additional performance work completed in March 2026, including IoT-NTN-related features such as a TDD mode for half-duplex satellite operation and satellite-based public warning broadcast support, creating product planning room for vendors targeting NB-IoT-class power profiles with improved satellite interoperability.
Recent Industry Developments in Narrowband IoT Market
- May 2026: Sateliot and Telenor IoT partnered to integrate space-based NB-IoT capabilities into Telenor IoTs Nordic connectivity portfolio. The partnership expands addressable use cases for trackers and remote sensors beyond terrestrial coverage limits and supports hybrid terrestrial-NTN service bundles for enterprise deployments.
- November 2025: Vodafone IoT partnered with Iridium Communications to provide customers with NTN NB-IoT connectivity using Iridium NTN Direct. This creates a commercial path for utilities, logistics, and industrial users to maintain service continuity across remote geographies without redesigning applications around non-cellular satellite-only stacks.
- November 2024: AT&T announced the start of decommissioning its US NB-IoT network, halted new device certifications and data plan sales, and targeted completion by Q1 2025 while migrating users to LTE-M. The decision reshaped North American operator support dynamics for NB-IoT and pushed device OEMs and enterprises to plan for multi-mode modules and alternative carrier footprints.
Narrowband IoT Market Report Scope and Research Methodology
Market Definition and Coverage
This market covers revenue generated from Narrowband IoT (NB-IoT) connectivity and related enabling components used to connect low data-rate devices over licensed cellular networks for applications like metering, tracking, and monitoring.
Scope exclusions: Consumer broadband IoT connectivity, non-cellular LPWAN technologies, and general 4G/5G data services that are not tied to NB-IoT use cases are excluded.
Segments Covered in This Report
- By Component
- Network
- Core Network
- Radio Access Network (RAN)
- Module
- Baseband Chipsets
- Integrated SoCs
- Network
- By Deployment
- Stand-alone
- In-band
- Guard-band
- By Device Type
- Wearables
- Healthcare Wearables
- Consumer Wearables
- Trackers
- Logistics Trackers
- Smart Meters
- Electricity Meters
- Gas and Water Meters
- Smart Lighting
- Alarms and Detectors
- Smoke Detectors
- Intrusion Alarms
- Wearables
- By Application
- Smart Cities
- Transportation and Logistics
- Energy and Utilities
- Retail and Vending
- Agriculture and Livestock
- Industrial Automation
- By Geography
- North America
- United States
- Canada
- Mexico
- South America
- Brazil
- Argentina
- Rest of South America
- Europe
- Germany
- United Kingdom
- France
- Italy
- Spain
- Rest of Europe
- Asia-Pacific
- China
- India
- Japan
- South Korea
- Rest of Asia-Pacific
- Middle East and Africa
- Middle East
- United Arab Emirates
- Saudi Arabia
- Turkey
- Rest of Middle East
- Africa
- South Africa
- Nigeria
- Kenya
- Rest of Africa
- Middle East
- North America
Data Sources, Market Sizing, and Validation
Desk Research
Desk research was used to build the initial demand and supply picture for NB-IoT, and to set realistic constraints around coverage, regulation, and rollout pace. We relied on open, official references such as ITU indicators, OECD telecom statistics, GSMA public reports, 3GPP releases, and national telecom regulator publications that track spectrum and network readiness.
To translate the industry context into workable sizing inputs, we also reviewed company filings and earnings decks, operator coverage announcements, credible press coverage, and association websites that discuss deployments. Where needed, paid subscriptions for company financials and news intelligence, plus patent databases, were used to confirm technology focus and funding direction. The desk sources mentioned here are illustrative, and we checked many additional public references for validation and clarification.
Primary Interviews and Surveys
Primary work focused on interviewing people across the NB-IoT value chain, including mobile operators, module makers, device integrators, and large end users in utilities, smart city projects, and logistics. Because this is a global market, we cross-checked inputs across APAC, EMEA, and the Americas to confirm adoption pace, pricing direction, and how deployments are counted in revenue terms.
Distribution of primary research fieldwork respondents
| Company type | Respondent position | Region |
|---|---|---|
| Top tier: 29% | CXOs: 17% | APAC: 45% |
| Mid tier: 51% | Functional/Unit leaders: 38% | EMEA: 35% |
| Smaller Players: 20% | Managers: 45% | Americas: 20% |
Market-Sizing & Forecasting
Sizing starts from a top-down build where cellular IoT connection growth and network rollout signals are used to reconstruct the addressable NB-IoT demand pool by region, then mapped to monetization through typical module and connectivity revenue patterns. The totals are then corroborated with selective bottom-up approximations, such as sampled average selling price (ASP) times estimated shipment volumes for NB-IoT modules and device attach rates in high-usage applications. This lets us adjust the model where the first pass looks stretched.
Key inputs used in the model include operator NB-IoT coverage expansion, spectrum availability and licensing milestones, active connection growth in utility metering and asset tracking, module ASP movement, and the split between standalone and in-band deployments where it impacts rollout timelines. For forecasting, scenario analysis was applied around deployment pacing and pricing, and scenarios were tuned using what interviewees shared about procurement cycles, rollout backlogs, and replacement demand. Where bottom-up inputs were incomplete for smaller countries or fragmented device categories, gaps were handled through proxy adoption rates anchored to comparable markets, then rechecked against regional totals.
Data Validation & Update Cycle
Outputs are validated through multiple checks so that one noisy data point does not drive the final number. We compare the modeled revenue path against independent signals such as connection growth, rollout announcements, and pricing direction, and then review any anomalies with another analyst before sign-off.
The model is refreshed on an annual cycle, and interim updates are triggered when material events occur, such as large spectrum changes, major operator rollouts, or sharp pricing shifts in modules. Before delivery, a final pass is completed to reflect the latest public releases and any new expert feedback that changes a key assumption.
Mordor Intelligence's Narrowband IOT Market Sizing Compared With Other Published Estimates
Published NB-IoT market sizes often look far apart because the market can be counted through different lenses, and each lens uses its own scope, year cut, and revenue components. The differences usually come from what is included as monetized revenue, how connections are translated into dollars, and how quickly pricing is assumed to normalize as volumes scale.
The main gap comes from whether estimates fold in broader cellular IoT revenue or keep the math limited to NB-IoT specific modules and connectivity, and this can swing totals sharply. Some publications also anchor projections on aggressive coverage assumptions or static ASPs, while currency timing and the selected base year can widen the spread further when markets are growing quickly. In our work, Mordor Intelligence keeps the scope tied to NB-IoT revenues and refreshes adoption and ASP assumptions using operator rollout signals and primary checks, which reduces overcounting from adjacent LPWAN categories.
Benchmark comparison
| Source | Market Size | Gaps in Research Methodology |
|---|---|---|
| Mordor Intelligence | USD 13.62 B (2026) | |
| Global Research House A | USD 5.16 B (2024) | Uses an earlier base year and a narrower revenue capture tied mainly to near-term deployments, which can understate later-stage scaling effects in utilities and smart city connections. |
| Industry Publisher B | USD 3.70 B (2024) | Applies a tighter interpretation of what counts as NB-IoT revenue and may exclude some module and service monetization linked to enterprise deployments, leading to a smaller 2024 total. |
The table shows that the spread is mostly explained by year selection and what is counted as NB-IoT monetization versus adjacent connectivity or device value. By keeping the scope consistent, pressure-testing rollout pace, and rechecking pricing and connection logic with interviews, the result stays traceable to clear variables and can be repeated as new data comes in.
Key Questions Answered in the Report
What is the current value of the NB-IoT market?
The NB-IoT market size reached USD 13.62 billion in 2026 and is projected to hit USD 51.82 billion by 2031.
Which region leads NB-IoT adoption?
Asia Pacific holds 51.75% revenue share thanks to large-scale deployments in China and supportive industrial policies.
Why are module prices falling below USD 3.00 important?
Sub-USD 3.00 modules reduce total device cost, making NB-IoT viable for high-volume applications in agriculture, tracking, and smart cities.
How will 5G NR-RedCap affect NB-IoT investments?
RedCap provides an upgrade path that reuses NB-IoT spectrum and infrastructure, assuring buyers of long-term compatibility.
What deployment mode is growing fastest?
Guard-band deployments are forecast to expand at 34.10% CAGR over 2026-2031 as operators repurpose unused LTE buffer frequencies.
How does satellite augmentation enhance NB-IoT coverage?
Satellite-enabled NB-IoT modules fill connectivity gaps in maritime, mining, and remote farming zones where terrestrial networks are absent.