
Nanotechnology Drug Delivery Market Size and Share
Market Overview
| Study Period | 2020 - 2031 |
|---|---|
| Market Size (2026) | USD 119.89 Billion |
| Market Size (2031) | USD 191.88 Billion |
| Growth Rate (2026 - 2031) | 9.86 % |
| Fastest Growing Market | Asia-Pacific |
| Largest Market | North America |
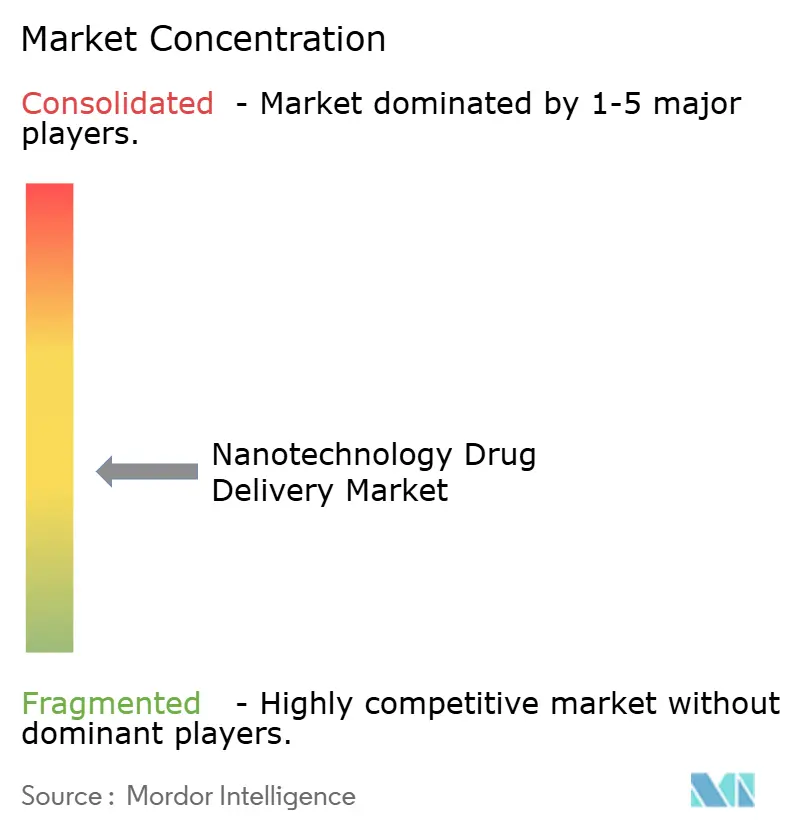
| Market Concentration | Medium |
Major Players *Disclaimer: Major Players sorted in no particular order Image © Mordor Intelligence. Reuse requires attribution under CC BY 4.0. | |
Nanotechnology Drug Delivery Market Analysis by Mordor Intelligence
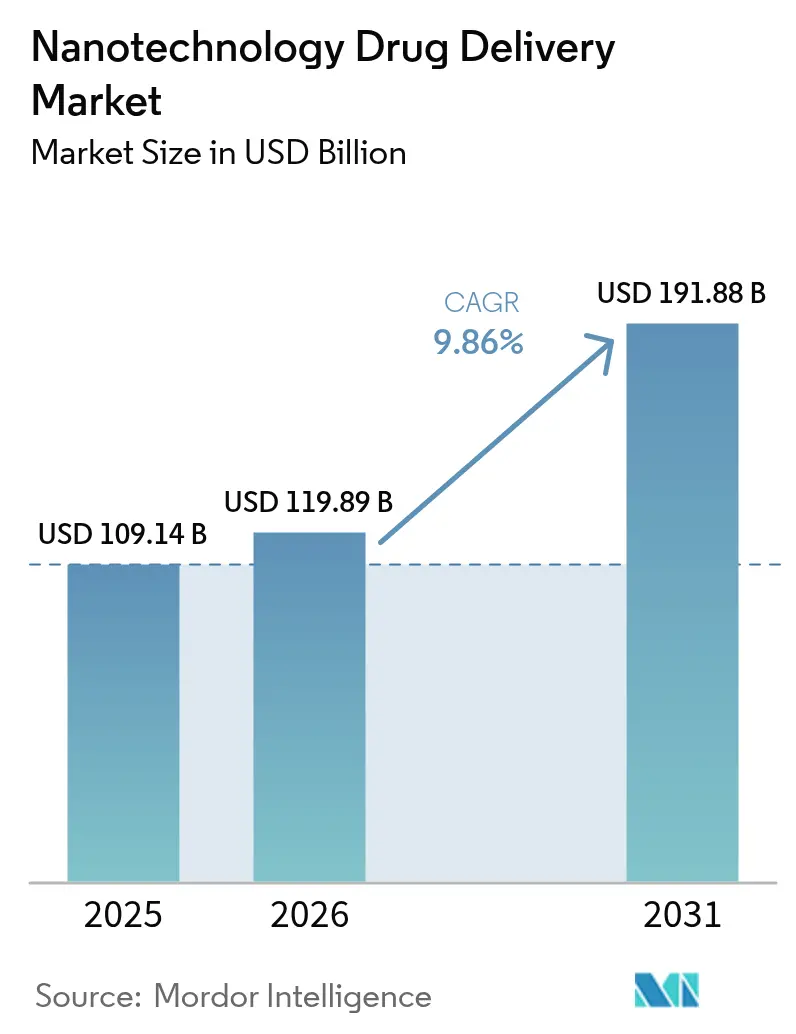
nanotechnology drug delivery market size in 2026 is estimated at USD 119.89 billion, growing from 2025 value of USD 109.14 billion with 2031 projections showing USD 191.88 billion, growing at 9.86% CAGR over 2026-2031. This momentum reflects tighter alignment between advanced manufacturing, clearer regulatory pathways, and accumulating clinical proof that nano-enabled carriers improve drug targeting and safety profiles. Growth is further propelled by surging demand for lipid nanoparticles, which already account for one-third of revenue, as well as by the pharmaceutical sector’s pivot toward genetic medicine and other complex biologics. Oncology continues to anchor revenues as providers seek premium, precision-based formulations that address tumor heterogeneity, while gene therapy and mRNA programs lead the pace of expansion. Regionally, North America keeps its lead thanks to entrenched R&D spending and fast-moving regulators, yet Asia Pacific is rising fastest on the back of generous public funding and rapid capacity build-outs. Routes of administration are also diversifying as pulmonary delivery begins to challenge intravenous dominance amid improved inhalation devices and formulation science driving higher deposition efficiency. Longer term, platform consolidation around scalable lipid and polymer systems promises to shift competitive dynamics as manufacturing know-how becomes a critical differentiator within the nanotechnology drug delivery market.
Key Report Takeaways
- By technology, lipid nanoparticles captured 31.98% of the nanotechnology drug delivery market share in 2025, while polymeric platforms are forecast to advance at a 13.02% CAGR to 2031.
- By application, oncology held 43.12% revenue share in 2025; gene therapy and mRNA delivery are set to expand at a 13.21% CAGR through 2031.
- By route of administration, intravenous delivery commanded 49.05% share of the nanotechnology drug delivery market size in 2025, whereas pulmonary delivery is projected to grow at 13.74% CAGR over the same horizon.
- By end-user, pharmaceutical and biotechnology companies accounted for 50.78% of 2025 revenue, while contract research and manufacturing organizations are growing fastest at 12.22% CAGR.
- By geography, North America led with 39.21% share in 2025, yet Asia Pacific is slated to register a 12.54% CAGR to 2031.
Note: Market size and forecast figures in this report are generated using Mordor Intelligence’s proprietary estimation framework, updated with the latest available data and insights as of 2026.
Market Trends and Insights
Drivers Impact Analysis of Nanotechnology Drug Delivery Market*
| Driver | (~) % Impact on CAGR Forecast | Geographic Relevance | Impact Timeline |
|---|---|---|---|
| Rising Prevalence Of Cancer, Genetic & Cardiovascular Diseases | +2.1% | Global, with concentrated impact in North America & Europe | Long term (≥ 4 years) |
| Growing Pipeline Of Nano-Enabled Biologics & Gene Therapies | +1.8% | North America & EU leading, APAC emerging | Medium term (2-4 years) |
| Rapid Advances In Scalable Lipid-Nanoparticle (LNP) Manufacturing | +1.5% | Global, with manufacturing hubs in North America, Europe, APAC | Short term (≤ 2 years) |
| Hospital Demand For Personalized/Precision Dosing Platforms | +1.2% | North America & EU core, selective APAC markets | Medium term (2-4 years) |
| Venture Investment In Programmable Nanocarriers & Stimuli-Responsive DDS | +0.9% | North America & EU concentrated, emerging in APAC | Long term (≥ 4 years) |
| Government Nanomedicine Mega-Grants | +0.7% | National programs in US, EU, China, with spillover effects | Medium term (2-4 years) |
| Source: Mordor Intelligence | |||
Rising Prevalence of Cancer, Genetic & Cardiovascular Diseases
Accelerating incidence of cancer, rare genetic disorders, and chronic heart conditions is enlarging the addressable pool of patients who need more precise dosing and tissue targeting. Growing life expectancy and better diagnostics add to case volumes, reinforcing the call for nano-enabled formulations that can navigate biological barriers while reducing toxic spillover. In cardiovascular care, nanoparticles are being designed to hone in on atherosclerotic plaques, a capability that broadens therapeutic windows for potent agents. Researchers at Oregon State University reported a 94% jump in targeting accuracy when nanoparticles were used to quell inflammatory cascades in preclinical models, underscoring how disease burden is turning into concrete commercial demand. Successful outcomes in one therapeutic area often spark spill-over interest in adjacent fields, speeding adoption curves across the healthcare system. As hospital formularies observe superior efficacy and safety records, demand for nano-formulations grows, strengthening the revenue base for the nanotechnology drug delivery market.
Growing Pipeline of Nano-Enabled Biologics & Gene Therapies
Messenger RNA vaccines validated the commercial and regulatory feasibility of lipid nanoparticle delivery, triggering a wave of venture funding and strategic deals aimed at next-generation gene therapies. Large drug makers are partnering with academic labs to refine encapsulation chemistries that protect fragile molecules and promote endosomal escape. Pfizer’s collaboration with UT Southwestern on RNA payload technologies typifies the collaboration model intended to cut translation times from bench to bedside. As more candidates clear mid-stage trials, comfort within regulatory agencies rises, diminishing approval risk and widening the funnel for nano-based therapeutics across oncology, rare diseases, and metabolic disorders. Pipeline growth thus reinforces demand for specialized manufacturing capacity, supporting longer-term revenue visibility for suppliers operating in the nanotechnology drug delivery market.
Rapid Advances in Scalable Lipid-Nanoparticle Manufacturing
Continuous processing, microfluidic mixers, and in-line analytics now permit real-time control of particle size and encapsulation efficiency, dismantling a historic scale-up bottleneck. Danaher’s acquisition of Precision Nanosystems created an end-to-end offering that spans early research to GMP production, providing drug makers with a turnkey route to globally harmonized supply. Wacker’s EUR 107 million mRNA center adds capacity for more than 200 million vaccine doses annually, demonstrating that capital is flowing into dedicated nano plants rather than retrofitting legacy lines.[1] Lower unit costs make nano formulations viable for chronic therapies, moving the technology beyond niche, high-priced indications and broadening the commercial canvas for the nanotechnology drug delivery market.
Hospital Demand for Personalized/Precision Dosing Platforms
Clinicians are gravitating toward nanoparticle formulations that trim adverse events and unlock higher dose intensities. Hospital pharmacy committees weigh formulary additions on both clinical and operational grounds, giving preference to nano drugs that shorten hospital stays or reduce readmissions. Theranostic particles able to signal their location in real time let physicians fine-tune regimens mid-course, improving outcomes. A Journal of Nanobiotechnology study showed enzyme-responsive nanoparticles could concentrate chemotherapy in tumors with 94% precision, capturing physician interest in real-world oncology settings.[2] The link between measurable clinical benefit and operating-cost reduction accelerates procurement decisions, lifting demand in the nanotechnology drug delivery market.
Restraints Impact Analysis of Nanotechnology Drug Delivery Market*
| Restraint | (~) % Impact on CAGR Forecast | Geographic Relevance | Impact Timeline |
|---|---|---|---|
| High CMC & GMP Compliance Cost For Nano-Formulations | -1.4% | Global, with higher impact in emerging markets | Short term (≤ 2 years) |
| Uncertain Long-Term Nano-Toxicology Data | -1.1% | Global regulatory concern, varying regional standards | Long term (≥ 4 years) |
| Scale-Up Bottlenecks For Microfluidic-Based Production | -0.8% | Manufacturing hubs in North America, Europe, APAC | Medium term (2-4 years) |
| Limited Reimbursement Pathways For Nano-Formulated Generics | -0.6% | North America & EU primarily, emerging in APAC | Medium term (2-4 years) |
| Source: Mordor Intelligence | |||
High CMC & GMP Compliance Cost for Nano-Formulations
Nano drugs often require bespoke production suites, particulate monitoring, and advanced analytics that push fixed costs well above those of conventional injectables. Detailed characterization of particle size, zeta potential, and surface chemistry must be maintained across shelf life, adding complexity. The FDA’s 2024 guidance on nanomaterial drug products emphasizes rigorous in-process testing, which many smaller firms struggle to afford.[3] High compliance costs can delay launch timelines and discourage follow-on formulations, moderating expansion in the nanotechnology drug delivery market.
Uncertain Long-Term Nano-Toxicology Data
While acute toxicity signals are often benign, questions persist over long-term accumulation in the reticuloendothelial system. Regulators seek extensive biodistribution and clearance studies, adding both time and cost. A review in Discover Nano highlighted the fragmented nature of current assays and called for harmonized protocols across particle classes. Until longitudinal data mature, conservative risk-benefit evaluations may slow broader adoption within the nanotechnology drug delivery market.
*Our forecasts treat driver/restraint impacts as directional, not additive. The impact forecasts reflect baseline growth, mix effects, and variable interactions.
Nanotechnology Drug Delivery Market Segment Analysis
By Technology:
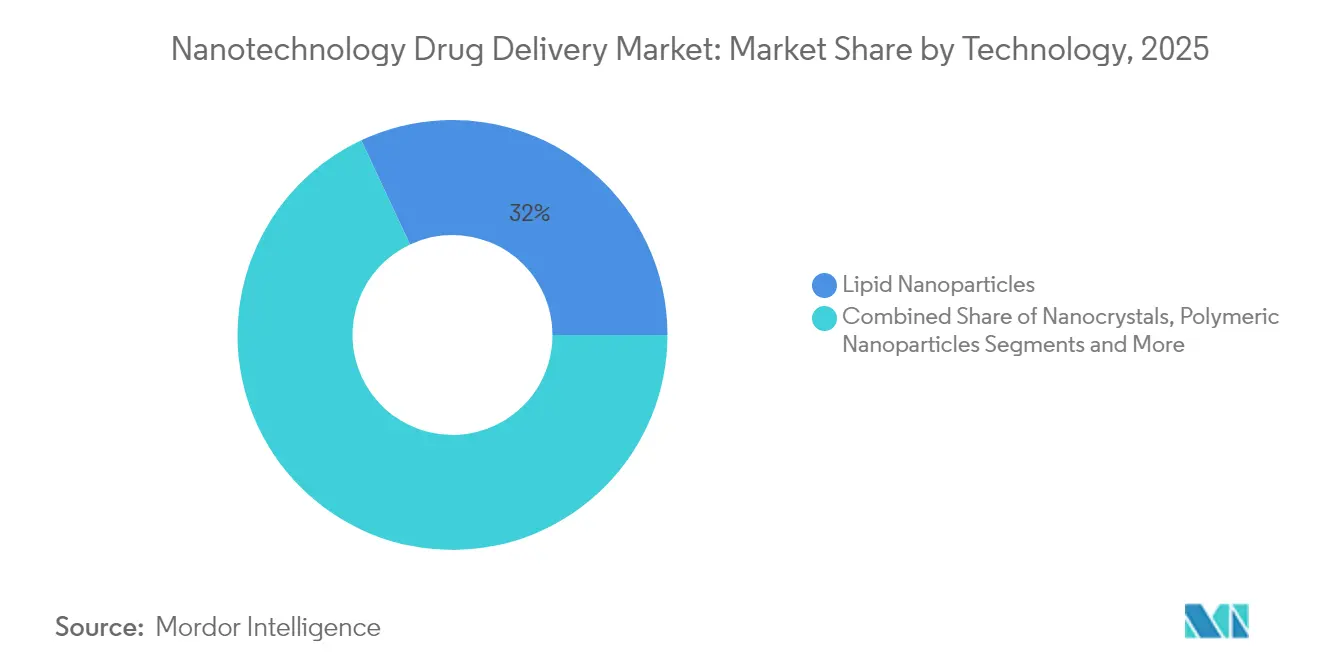
Lipid Platforms Drive Commercial AdoptionLipid nanoparticles generated 31.98% of 2025 revenue and remain the anchor of the nanotechnology drug delivery market. A blend of clinical validation and compatible excipient supply chains keeps adoption high, with a forecast 12.61% CAGR to 2031. News of successful mRNA vaccines normalized lipid-based design across therapeutic categories, prompting CDMOs to expand dedicated lines and secure long-term contracts. Polymeric systems, while second in share, excel at modulating release profiles in chronic therapies and show promise in multi-payload constructs. Nanocrystals are carving a space for poorly soluble drugs, whereas dendrimers appeal to researchers focused on multivalent ligand display despite heavier synthetic workloads. Quantum dots retain an imaging niche but face regulatory headwinds due to heavy-metal cores. Process scalability and regulatory precedent will continue to separate front-runner platforms from experimental niches, guiding capital allocation inside the broader nanotechnology drug delivery market.

By Application:
Oncology Leadership Faces Gene Therapy ChallengeOncology accounted for 43.12% revenue in 2025 because cancer care often rewards innovations that enable higher dose intensities or localized release. Liposomal reformulations of chemotherapeutics remain an enduring revenue stream. Gene therapy and mRNA indications are advancing at 13.21% CAGR, emblematic of the industry’s shift toward molecular-level interventions. Neurology programs are gathering momentum by harnessing nano carriers to cross the blood–brain barrier, while anti-inflammatory candidates gradually displace systemic steroids in rheumatoid settings. Cardiovascular trials remain smaller but stand to broaden if plaque-targeting nanoparticles validate in Phase III. Collectively, these tracks create a diversified opportunity set that stabilizes cash flow across the nanotechnology drug delivery market.
By Route of Administration:
Pulmonary Delivery Gains MomentumIntravenous lines dominated 49.05% of the nanotechnology drug delivery market size in 2025 owing to familiar hospital workflows. Yet pulmonary delivery is on course for the quickest gains: a 13.74% CAGR through 2031 supported by dry-powder inhalers that improve alveolar deposition. Oral nano capsules aspire to elevate adherence in chronic conditions, although gastrointestinal degradation remains a design hurdle. Transdermal nano emulsions continue to target dermatology and pain management, offering controlled surface delivery that minimizes systemic exposure. Together these routes dilute supply-chain risk and extend nano-enabled care into outpatient settings, supporting volume growth in the nanotechnology drug delivery market.

By End-user:
Contract Manufacturing Gains Strategic ImportancePharmaceutical and biotechnology companies controlled 50.78% of 2025 sales by virtue of marketing authorizations, but they increasingly outsource particle engineering and fill-finish work. CDMOs are rewarded with a 12.22% CAGR for investing in clean-room facilities and GMP analytics. Hospital compounding caters to individualized doses for ultra-rare disorders, yet capital barriers often steer production toward specialized suppliers. Academic centers drive discovery, passing transfers to industry partners as scale requirements emerge. This interlinked ecosystem underpins the resilience and specialization evident in the nanotechnology drug delivery market.
Geography Analysis
North America Nanotechnology Drug Delivery Market
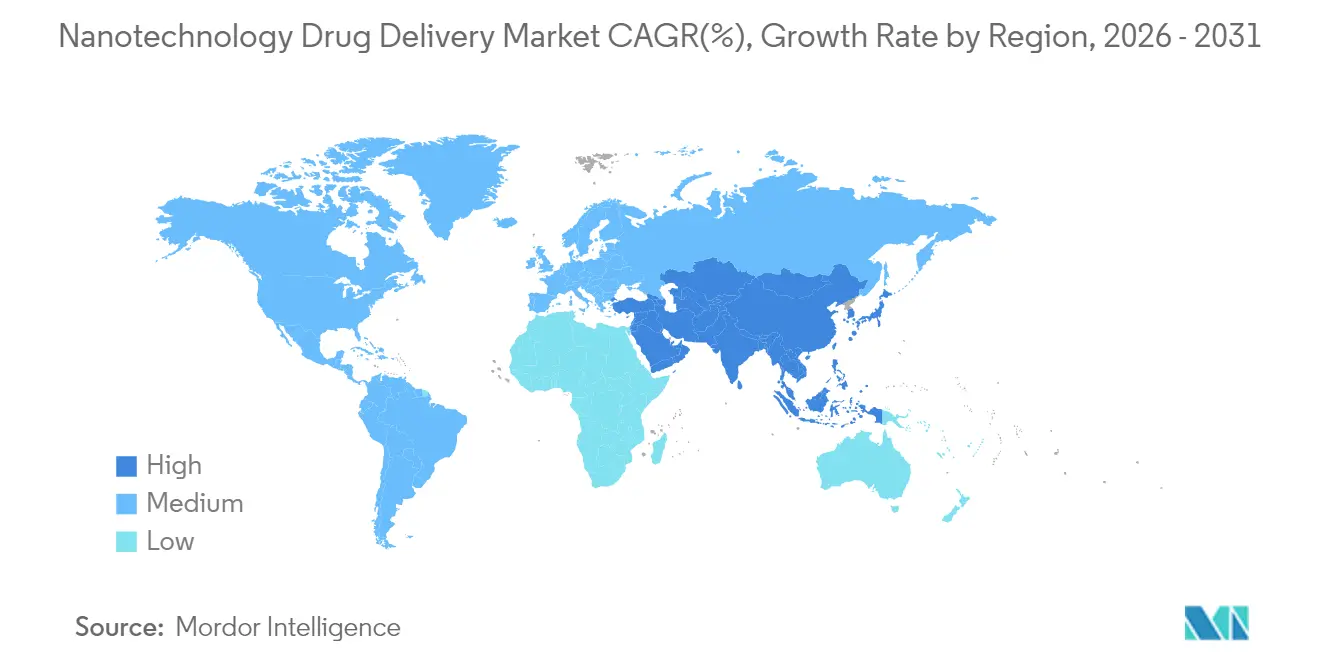
North America captured 39.21% of global revenue in 2025 and remains a magnet for first-in-human studies thanks to clear FDA guidance and dense venture funding networks. Canada bolsters the regional picture with generous R&D credits and pragmatic regulators who often coordinate with their US counterparts. The nanotechnology drug delivery market benefits here from predictable reimbursement systems that reward innovation while ensuring pharmacovigilance.
Europe Nanotechnology Drug Delivery Market
Europe maintains traction through Horizon Europe grants and national co-funding that knits academia and industry into translational pipelines. Germany’s chemical clusters supply excipients and surfactants, while the Benelux region offers clinical trial infrastructure. Together these attributes support a robust nanotechnology drug delivery market despite pricing pressure from centralized procurement.
APAC Nanotechnology Drug Delivery Market
Asia Pacific is the fastest-growing territory, posting a 12.54% CAGR that is reshaping supply chains. China anchors regional expansion by financing cGMP nano parks and rolling out supportive IP reforms, positioning itself as a cost-effective manufacturing hub. Japan’s materials science prowess advances lipid and polymer libraries, whereas South Korea’s conglomerates integrate device and drug development to shorten timelines. India targets global export markets with generic nano injectables. These developments collectively increase manufacturing velocity, lifting the overall nanotechnology drug delivery market.
LATAM and Middle East Nanotechnology Drug Delivery Market
Latin America and the Middle East currently post modest revenue but exhibit growing demand for advanced formulations that fit local disease burdens. Brazil and Saudi Arabia, for example, have signaled intent to localize vaccine and nano-therapeutic production, laying groundwork for future market growth.
Regulatory Landscape
Nanotechnology-enabled drug delivery products continue to be regulated under existing pharmaceutical, biologic, and device frameworks rather than a single nanomedicine statute, which keeps reviews highly product-specific. In the United States, FDA oversight often hinges on whether the product involves the application of nanotechnology, and for drug-device combinations, on Primary Mode of Action (PMOA) assignment to a lead center (CDER, CBER, or CDRH) in line with combination-product practice described in the NIH SEED Office combination products guide (April 2024). For drug products that contain nanomaterials, FDA guidance stresses robust characterization and control of attributes such as particle size and distribution, morphology, surface charge, stability, drug loading, and release kinetics, which translates into heavier CMC packages and more stringent in-process controls for nano-formulations.
In Europe, regulatory expectations place emphasis on quality, comparability, and risk-based assessment, including specific considerations for parenteral administration of coated nanomedicine products in EMA reflection work on surface coatings. Across both FDA and EMA, Quality by Design (QbD) principles and alignment to ICH Q8, Q9, and Q10 are commonly used as the organizing structure to connect critical quality attributes to critical process parameters for scalable manufacturing and lifecycle change management. This reinforces the need for standardized analytics and validated control strategies as programs move from clinical to commercial supply.
Value Chain Analysis
The value chain for nanotechnology drug delivery includes (i) raw materials and excipients (lipids, polymers, surfactants, PEGylation reagents, and specialty solvents), (ii) platform and formulation IP holders that design carrier chemistries and payload conjugation approaches, and (iii) pharmaceutical and biotechnology sponsors that fund preclinical and clinical development. A substantial portion of scale-up, GMP production, and analytical release testing is handled by specialized CRO/CMO/CDMOs with nanoparticle unit operations and sterile manufacturing, reflecting a shift toward outsourced, de-risked supply for complex modalities such as mRNA, gene therapies, and oncology formulations.
Key manufacturing steps include controlled micromixing (often microfluidic), high-pressure homogenization, solvent removal, concentration and buffer exchange, and sterile filtration or aseptic fill-finish, with lyophilization frequently used to support stability for distribution. Bottlenecks typically stem from maintaining batch-to-batch consistency in particle size and encapsulation efficiency, managing raw-material variability, and avoiding damage to fragile biologics during terminal sterilization and handling. Regulatory expectations for products containing nanomaterials, including FDA emphasis on characterization and risk-based control, push the chain toward Process Analytical Technology (PAT), standardized methods (for example, DLS and orthogonal fractionation/size analytics), and increasingly closed or single-use architectures to reduce contamination risk while improving reproducibility at scale.
Competitive Landscape
The competitive set spans global pharmaceutical majors, mid-sized biotech innovators, and early-stage start-ups. Larger companies wield experienced regulatory teams and global distribution, enabling them to run multi-center trials and launch across geographies. Smaller players differentiate through specialized carrier designs, quick iteration cycles, and academic collaborations.
Technology advantages revolve around scalable manufacturing and proven CMC packages. CDMOs with continuous nanoparticle mixers and inline PAT instrumentation command premium multipliers, as sponsors prefer de-risked supply. Patent filings around carbon nanostructure-based delivery systems hint at next-generation payload architectures. Bristol Myers Squibb’s partnership with Cellares shows how automation is being hard-wired into production to contain cost and reduce cycle times. Market entry barriers therefore grow steeper, guiding the nanotechnology drug delivery market toward a moderately consolidated future while still leaving room for breakthrough technologies to disrupt incumbent positions.
Nanotechnology Drug Delivery Industry Leaders
-
Pfizer
-
Bristol Myers Squibb
-
Novartis
-
Merck Co& Inc
-
Johnson & Johnson
- *Disclaimer: Major Players sorted in no particular order
Nanotechnology Drug Delivery Market Companies Covered in this Report
- Pfizer (Wyeth/Liposome Co heritage)
- Bristol-Myers Squibb
- Merck Co& Inc
- Novartis
- Johnson & Johnson
- AstraZeneca
- Gilead Sciences
- Nanobiotix
- NanoCarrier
- Taiwan Liposome
- BlueWillow Biologics
- NanOlogy
- CytImmune Sciences
- Aquanova
- Aphios Corp
- Concept Medical
- Evonik Health Care
- Precision NanoSystems
- CordenPharma
- 20/20 GeneSystems
Market Opportunities and Future Outlook
Clinical progression in oncology and advanced solid tumors continues to create whitespace for nano-enabled carriers that address delivery barriers and multidrug resistance. In May 2026, Sapu Nano reported first patient dosed in a Phase 1b study of Sapu003, an intravenous Deciparticle formulation of everolimus for mTOR-sensitive solid tumors, illustrating continued sponsor investment in engineered carriers to extend the therapeutic window of established actives. Separately, clinical evidence published in 2026 describing a carbon nanoparticle-Fe(II) complex (CNSI-Fe) reversing multidrug resistance in solid tumors, together with the initiation of a Phase Ib/IIa clinical study for intratumoral CNSI-Fe (ClinicalTrials.gov NCT07433283, started November 2024), highlights an opportunity set around localized delivery, tumor penetration, and resensitization where conventional systemic dosing has limitations.
Manufacturing and CMC execution remains a primary commercial lever, especially for lipid and polymeric platforms that dominate pipeline activity and require tight control of particle attributes across lifecycle changes. The FDA 2024 guidance focus on characterization and control for nanomaterial-containing drug products supports demand for CDMO capabilities in validated analytics, sterile processing, and data-driven process control, particularly as programs move from clinical-scale microfluidic production to reliable commercial throughput. On the demand side, routes beyond intravenous administration, including subcutaneous and pulmonary delivery approaches referenced across industry initiatives, create room for differentiated formulation and device-combination strategies that improve patient convenience while maintaining nano-carrier performance.
Recent Industry Developments in Nanotechnology Drug Delivery Market
- May 2026: Merck & Co., Inc. scientists published research describing a biocatalytic method for large-scale synthesis of the investigational oral PCSK9 inhibitor enlicitide decanoate. The work highlights process innovation aimed at manufacturability and scale, reinforcing how enabling technologies in synthesis and formulation are being prioritized to support complex therapeutic modalities and delivery strategies.
- September 2025: Merck KGaA, Darmstadt, Germany, entered an evaluation and option agreement with Biocytogen Pharmaceuticals to advance antibody-conjugated lipid-based delivery solutions for nucleic acid payloads. The collaboration targets next-generation lipid-based delivery architectures, strengthening the pipeline of nano-enabled platforms intended to improve targeting and intracellular delivery for genetic medicines.
- August 2024: Novartis Pharma AG entered a global licensing and strategic collaboration agreement with Lindy Biosciences to transition select innovative medicines to self-administered subcutaneous injections using its microglassification suspension technology. Expanding self-administration and formulation options supports broader adoption of advanced delivery approaches by improving patient convenience and helping sponsors differentiate lifecycle management strategies.
Nanotechnology Drug Delivery Market Report Scope and Research Methodology
Market Definition and Coverage
This market covers drug delivery approaches where a therapeutic payload is carried, protected, targeted, or released using engineered nano-scale materials, and the value is counted from products and solutions used to deliver medicines across major regions.
Scope exclusions: We exclude nano agents used only for imaging, surface-coated medical devices, and conventional controlled-release drugs that do not use nano-enabled carriers.
Segments Covered in This Report
- By Technology
- Nanocrystals
- Polymeric Nanoparticles
- Lipid Nanoparticles / Liposomes
- Polymeric Micelles
- Dendrimers
- Quantum Dots
- Others
- By Application
- Oncology
- Neurology
- Cardiovascular
- Anti-inflammatory / Immunology
- Anti-infective
- Ophthalmology
- Others
- By Route of Administration
- Intravenous
- Oral
- Pulmonary
- Transdermal & Topical
- Others
- By End-user
- Pharmaceutical & Biotechnology Companies
- Contract Research & Manufacturing Organizations
- Hospitals & Clinics
- Academic & Research Institutes
- By Geography
- North America
- United States
- Canada
- Mexico
- Europe
- Germany
- United Kingdom
- France
- Italy
- Spain
- Rest of Europe
- Asia-Pacific
- China
- Japan
- India
- Australia
- South Korea
- Rest of Asia-Pacific
- Middle East and Africa
- GCC
- South Africa
- Rest of Middle East and Africa
- South America
- Brazil
- Argentina
- Rest of South America
- North America
Data Sources, Market Sizing, and Validation
Desk Research
Desk research is used to build the first structure of the market and to keep assumptions tied to published, repeatable signals. We refer to public sources such as the US FDA databases (drug labels and approvals), NIH and ClinicalTrials.gov for pipeline and trial activity, the World Health Organization for therapy area burden signals, and OECD and World Bank health expenditure series to sense demand capacity by geography.
To translate these signals into a working sizing model, we also review company filings and investor presentations for product focus and pricing commentary, plus association and regulator publications that explain formulation and quality requirements. Patent databases are used to understand which nanocarrier concepts are actively being developed and where activity is shifting. In some cases, paid subscriptions supporting company financials and intelligence, and patent lookups, help speed up cross-checks. These desk sources are illustrative, and we use other public references as well to collect data, validate assumptions, and clarify gray areas in coverage.
Primary Interviews and Surveys
Primary work is used to verify what is truly commercialized versus still in trials, and to pressure-test pricing and uptake by route of administration and therapy area. We speak with formulation experts, manufacturing and quality leaders, commercial managers, and clinical stakeholders across APAC, EMEA, and the Americas, so the model reflects different regulatory pathways and adoption speeds.
Distribution of primary research fieldwork respondents
| Company type | Respondent position | Region |
|---|---|---|
| Top tier: 28% | CXOs: 14% | APAC: 38% |
| Mid tier: 50% | Functional/Unit leaders: 36% | EMEA: 37% |
| Smaller Players: 22% | Managers: 50% | Americas: 25% |
Market-Sizing & Forecasting
For sizing, the main build is a top-down demand pool assessment that starts from therapy area activity and the addressable set of nano-enabled delivery platforms that are in approved use or near-term commercialization. That structure is then translated into value using a small set of variables that can be checked and refreshed, such as clinical trial volume by relevant delivery approach, mix shifts toward biologics and nucleic acid therapeutics, route-of-administration adoption patterns (including pulmonary and parenteral use where relevant), and observable pricing direction for complex formulations.
Once the topline is formed, we apply selective bottom-up approximations to keep totals realistic. These checks include sampled price per treatment course multiplied by implied patient volumes for key use cases, supplier and CDMO channel checks on nanocarrier production intensity, and sanity checks against reported revenue exposure where disclosures exist. When a bottom-up view is incomplete, the missing portion is bridged using conservative penetration ranges that we validate in interviews, then adjusted only when multiple signals align.
Forecasting uses scenario analysis supported by regression-style sensitivity to the same drivers, because adoption is heavily influenced by regulatory clarity, scale-up readiness, and pipeline conversion. Growth rates are refined after discussing expected inflection points like approvals, manufacturing capacity additions, and changes in reimbursement behavior, and the final curve is kept smooth unless there is a clear event-led step change.
Data Validation & Update Cycle
Validation is done through triangulation across independent indicators, and then through analyst reviews that focus on outliers and year-to-year jumps. We compare model output with signals like trial starts, approval pace, and route-level adoption discussions, and then investigate any variance that cannot be explained by pricing, mix, or geography.
Before sign-off, we re-check assumptions with follow-up calls when a mismatch appears between desk signals and interview feedback, or when a new policy or approval changes the short-term outlook. The report is refreshed annually, and interim updates are made when material events occur that can move the market, such as major approvals, safety actions, or manufacturing scale-up announcements. Before delivery, we complete a final pass so clients receive the most current view possible.
Mordor Intelligence's Nanotechnology Drug Delivery Market Size Compared Against Other Published Estimates
Published market values for nanotechnology drug delivery can look far apart, even when the topic sounds identical. This typically happens when the counted scope differs, the start year and forecast window differ, and some models treat clinical-stage activity as revenue too early.
Clinical trial activity trends, approval timing, and route-of-administration adoption checks are the evidence that keeps Mordor Intelligence's estimate tied to nano-enabled delivery used for therapeutics and not expanded into adjacent nano diagnostics or non-nano controlled-release products. Other estimates may also use different currency conversion timing, faster ASP escalation for complex formulations, or quicker conversion of pipeline programs into paid demand, which can lift the headline number for the same year.
Benchmark comparison
| Source | Market Size | Gaps in Research Methodology |
|---|---|---|
| Mordor Intelligence | USD 119.89 B (2026) | |
| Global Consultancy A | USD 116.57 B (2025) | Uses an earlier base year and may broaden the technology bucket to include a wider set of nanocarriers and end users, which can shift value into the market even when therapeutic commercialization is not yet proven. |
| Industry Research Group B | USD 107.65 B (2025) | Anchors sizing on a different year and may apply higher near-term uptake assumptions for oncology and infectious disease applications, with limited adjustment for scale-up constraints and route-specific adoption timing. |
The table shows that most of the spread is explained by timing choices and what gets counted as in-scope revenue versus future potential. When the scope is kept specific to therapeutic nano delivery and assumptions are checked against observable adoption signals, the result is easier to trace back to clear drivers and to update in a repeatable way.
Key Questions Answered in the Report
What is the current size of the nanotechnology drug delivery market?
The nanotechnology drug delivery market reached USD 119.89 billion in 2026 and is projected to climb to USD 191.88 billion by 2031.
Which technology segment leads revenue generation?
Lipid nanoparticles lead with 31.98% market share in 2025, owing to their proven performance in mRNA vaccines and adaptable chemistry.
Why is Asia Pacific the fastest-growing region?
Robust government funding, large-scale manufacturing investments, and expanding domestic demand are driving a 12.54% CAGR in Asia Pacific.
What application area is expanding most quickly?
Gene therapy and mRNA delivery are advancing at a 13.21% CAGR through 2031 as more clinical candidates enter late-stage trials.
How are contract manufacturing organizations influencing the market?
CDMOs provide specialized GMP capacity and advanced analytics, supporting a 12.22% CAGR in their segment as sponsors outsource complex production.
What remains the largest hurdle for broad adoption of nano-formulations?
High CMC and GMP compliance costs, alongside unresolved long-term toxicology questions, continue to raise development expenses and regulatory scrutiny.