
Nanoceramic Powder Market Size and Share
Market Overview
| Study Period | 2021 - 2031 |
|---|---|
| Market Size (2026) | USD 4.07 Billion |
| Market Size (2031) | USD 8.27 Billion |
| Growth Rate (2026 - 2031) | 15.25 % |
| Fastest Growing Market | Asia Pacific |
| Largest Market | Asia Pacific |
| Market Concentration | Medium |
Major Players *Disclaimer: Major Players sorted in no particular order Image © Mordor Intelligence. Reuse requires attribution under CC BY 4.0. | |
Nanoceramic Powder Market Analysis by Mordor Intelligence
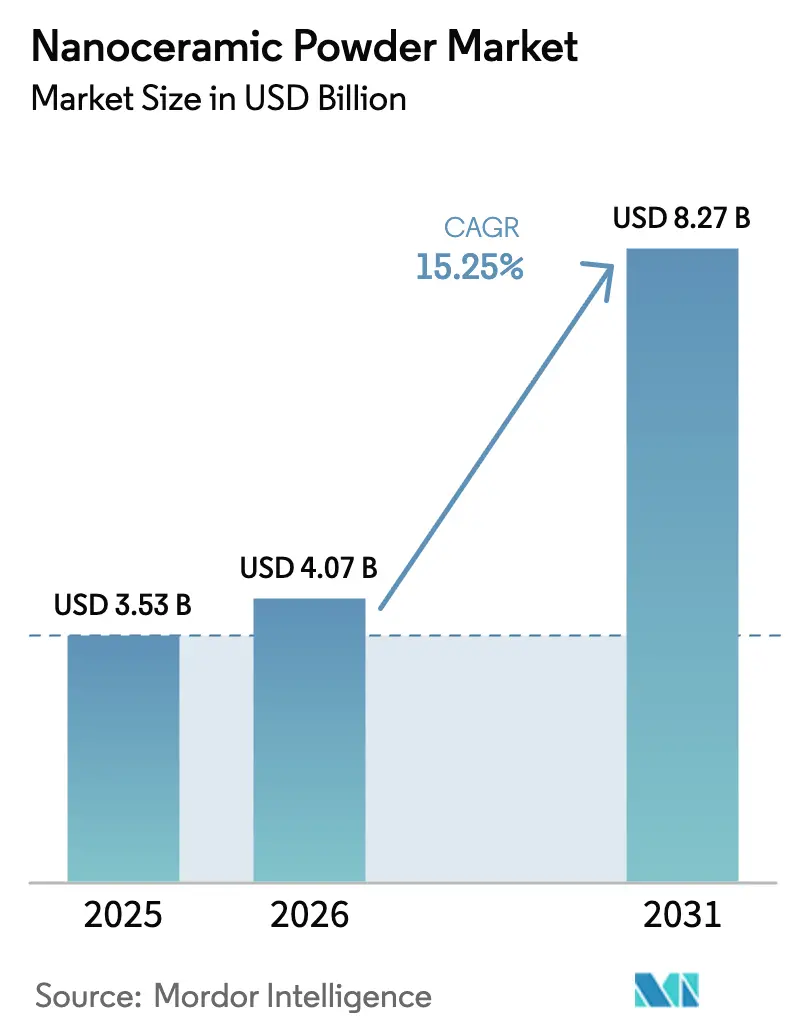
The Nanoceramic Powder Market size is projected to be USD 3.53 billion in 2025, USD 4.07 billion in 2026, and reach USD 8.27 billion by 2031, growing at a CAGR of 15.25% from 2026 to 2031. Momentum is shifting beyond classical electronics toward defense, medical, and battery platforms. State-sponsored hypersonic programs, the pivot to solid-state batteries, and stringent efficiency targets in power semiconductors are steering specification sheets toward ultra-high-temperature and corrosion-resistant powders. Carbide grades are accelerating on the back of silicon-carbide substrate demand for 800-volt electric-vehicle inverters, while oxide formulations preserve scale in capacitors, implantables, and dental restorations. Asia-Pacific sustains both volume leadership and incremental capacity additions, whereas North America commands premium pricing under Buy-American defense clauses. Vertical integration, precursor security, and rare-earth diversification define competitive playbooks in 2026.
Key Report Takeaways
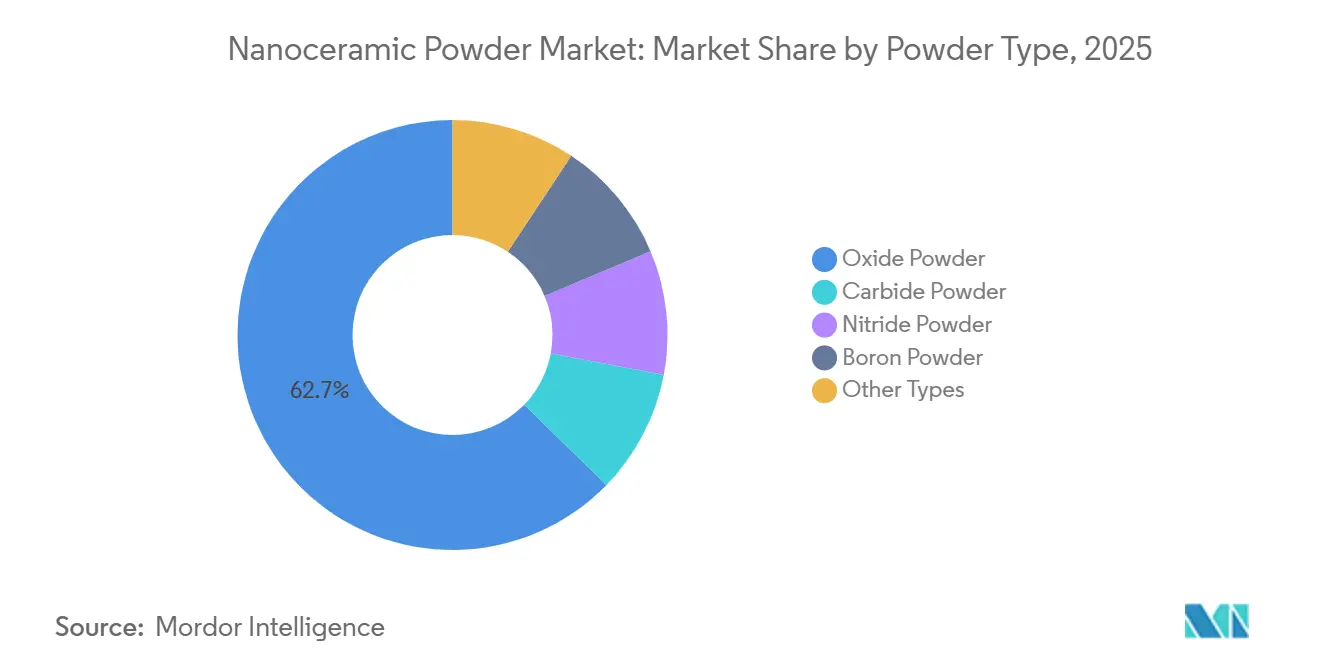
- By powder type, oxide grades retained the largest 62.72% revenue share in 2025, but carbide grades represent the fastest trajectory at a 17.07% CAGR through 2031.
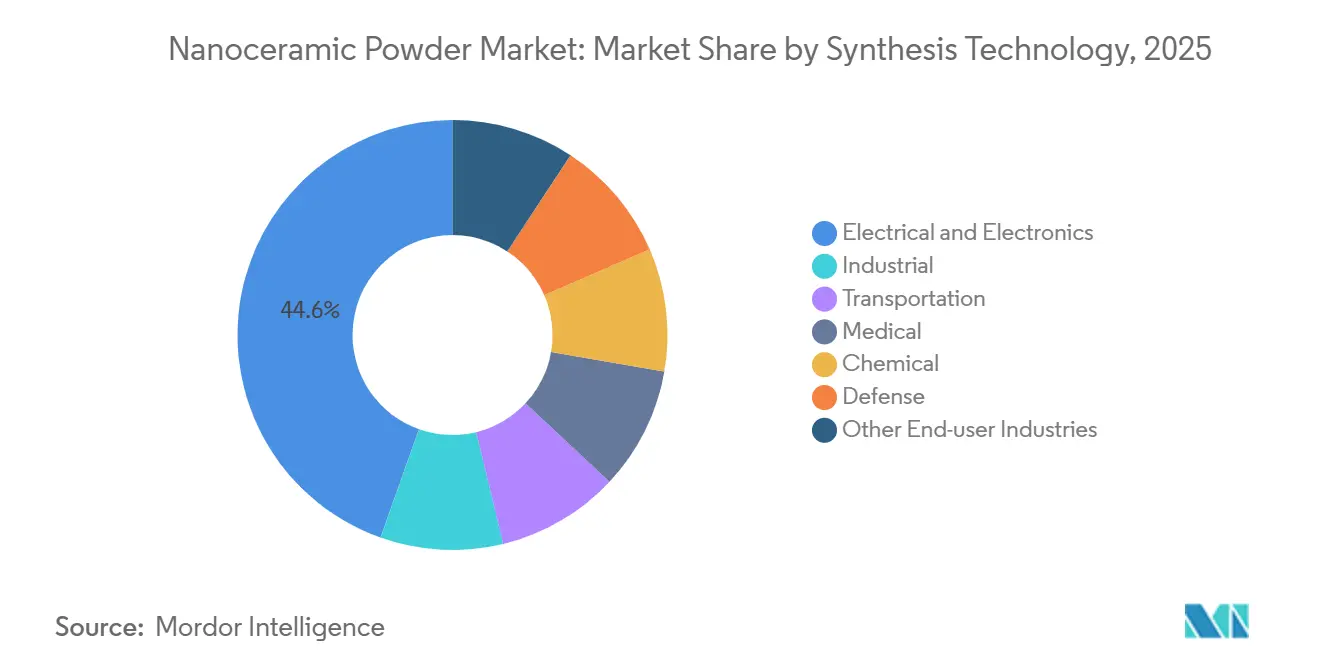
- By synthesis technology, electrical and electronics held 44.56% of the 2025 demand, whereas medical applications will accelerate at a 19.31% CAGR through 2031.
- By geography, Asia-Pacific contributed 50.73% of global revenue in 2025 and continues to lead with a 16.06% CAGR through 2031.
Note: Market size and forecast figures in this report are generated using Mordor Intelligence’s proprietary estimation framework, updated with the latest available data and insights as of January 2026.
Market Trends and Insights
Drivers Impact Analysis of Nanoceramic Powder Market*
| Drivers | (~) % Impact on CAGR Forecast | Geographic Relevance | Impact Timeline |
|---|---|---|---|
| Widespread Use in Electronics Industry | +3.8% | Global, with concentration in Asia-Pacific (China, South Korea, Taiwan) and spillover to North America semiconductor hubs | Medium term (2-4 years) |
| Demand from Healthcare Sector | +2.9% | North America and Europe lead regulatory approvals; Asia-Pacific emerging for dental ceramics | Long term (≥ 4 years) |
| Increasing Adoption of High-performance Ceramic Coatings | +2.6% | North America aerospace and defense; Europe automotive; Asia-Pacific industrial machinery | Medium term (2-4 years) |
| Need for High-temperature, Corrosion-resistant Powders in Hypersonic Weapons | +3.2% | United States, China, Russia defense programs; limited commercial spillover | Long term (≥ 4 years) |
| Quantum-dot and Solid-state Battery Integration | +2.4% | Global research and development centers; early commercialization in Japan, South Korea, United States | Long term (≥ 4 years) |
| Source: Mordor Intelligence | |||
Widespread Use in Electronics Industry
Miniaturization roadmaps have pushed dielectric-layer thickness targets below 5 µm in logic and memory nodes. Achieving this threshold now hinges on using sub-100-nm alumina and aluminum-nitride dispersions. Samsung, eyeing the future, has earmarked significant investments in its post-2025 capital plan for packaging lines. These lines come equipped with particle-classification optics, designed to reject agglomerates exceeding 120 nm[1]. TSMC, in its 2 nm process flow, is turning to aluminum-oxide atomic-layer-deposition precursors. With tight tolerances, TSMC aims to reduce random-defect density, ensuring backside-power-delivery yields remain high. Qualcomm's RF360 module is on the hunt for barium-titanate tunable filters, demanding dielectric constants greater than 2,000. This requirement is compelling filler suppliers to ensure tight particle-size distributions, especially for the 5G millimeter-wave bands. In response, suppliers in the Asia-Pacific have adopted laser-diffraction metrology, aligning with IEC 60384 traceability standards. This move further solidifies the advantage for established players with a strong process-control background.
Demand from Healthcare Sector
Orthopedic and dental segments are increasingly favoring zirconia-toughened alumina femoral heads and crowns over traditional cobalt–chrome alloys. In 2025, Zimmer Biomet revealed that ceramic-on-ceramic bearings had already secured a significant share of hip-replacement procedures in Europe, boasting wear rates below 0.05 mm annually. Straumann, having obtained FDA 510(k) clearance, introduced single-visit zirconia restorations that reduce chair time significantly, paving the way for broader adoption in ambulatory centers. A peer-reviewed trial in 2025 highlighted that hydroxyapatite nanopowders in bone-graft blocks accelerated osseointegration speeds compared to beta-TCP controls. Meanwhile, ISO 13356 mandates powder purities greater than 99.9% and restricts heavy metals to less than 10 ppm, prompting smaller mills to forge tolling partnerships with larger, vertically integrated conglomerates.
Increasing Adoption of High-performance Ceramic Coatings
Jet-engine OEMs are pushing turbine inlet temperatures beyond 1,400 °C, aiming for higher thermal efficiency. This shift accelerates the adoption of nanoscale yttria-stabilized zirconia coatings. GE Aviation’s GE9X blades have reduced cooling-air draw, resulting in an increase in specific fuel burn compared to nickel-superalloy baselines[2]. Volkswagen achieved a reduction in friction for EV gearboxes by substituting steel sleeves with silicon-nitride coatings, translating to an improvement in range on EPA cycles. The U.S. Department of Energy is backing plasma-spray pilots targeting efficiency boosts in industrial turbines, potentially saving significant energy annually. As a result, industrial OEMs are now embedding benchmarks into purchase contracts, specifying tap densities above 1.2 g cm⁻³ and agglomerate-free slurries stable for over 72 hours.
Need for High-temperature, Corrosion-resistant Powders in Hypersonic Weapons
Mach 5 flights require ceramics that can withstand extreme heat fluxes. The U.S. Air Force has allocated significant funding in its FY-2025 budget for boron- and hafnium-carbide research, specifically targeting AGM-183A leading edges. Meanwhile, China's Academy of Aerospace Solid Propulsion Technology has validated zirconium-diboride nanocomposites, capable of withstanding high temperatures, making them suitable for DF-17 combustor liners. Lockheed Martin has secured a patent for gradient-density silicon-carbide coatings, designed to mitigate thermal-shock cracking during intense maneuvers. Additionally, ASTM C1793 has mandated oxidation-resistance tests at elevated temperatures, leading to heightened powder-purity standards throughout defense supply chains.
Restraints Impact Analysis of Nanoceramic Powder Market*
| Restraints | (~) % Impact on CAGR Forecast | Geographic Relevance | Impact Timeline |
|---|---|---|---|
| High Processing Cost | -2.1% | Global, with acute pressure in price-sensitive industrial and chemical segments | Short term (≤ 2 years) |
| Environmental and Health Regulatory Compliance | -1.4% | Europe (REACH), North America (EPA, OSHA), Asia-Pacific (emerging standards in China, Japan) | Medium term (2-4 years) |
| Supply-chain Bottlenecks in Rare-earth Precursors | -1.8% | Global supply chains; Western manufacturers most exposed to China export restrictions | Short term (≤ 2 years) |
| Source: Mordor Intelligence | |||
High Processing Cost
Production costs for nanoceramics soar significantly higher than their micron-scale counterparts, primarily due to methods like sol-gel, hydrothermal, and gas-phase condensation. Silicon-carbide powders, processed in chemical-vapor-deposition reactors, consume substantial energy, leading to electricity bills that depend on tariff rates. Equipment vendors disclosed in 2025 that high-energy ball mills incur notable annual media replacement costs, based on throughput levels. Silane treatments, essential for polymer dispersion, contribute an added cost through surface-functionalization steps. While the IEA suggests that electrifying calcination kilns could reduce unit costs, the payback period stretches beyond several years if carbon prices remain below certain thresholds.
Environmental and Health Regulatory Compliance
The European Chemicals Agency tightened compliance windows by slashing exposure limits for titanium-dioxide nanopowder to 0.3 mg m⁻³, a significant reduction from the 10 mg m⁻³ limit set for micron powders. In 2025, OSHA levied fines on three nanoceramics mills, citing inadequate dust containment. This oversight necessitated costly retrofits for each production line. Adhering to ISO/TS 12901-2 toxicology protocols mandates a pre-market testing phase of 12 to 18 months. In a move towards transparency, Japan’s MHLW mandated in 2024 that nanomaterials must be labeled, specifically requiring the disclosure of particle-size distributions on Safety Data Sheets (SDS).
*Our forecasts treat driver/restraint impacts as directional, not additive. The impact forecasts reflect baseline growth, mix effects, and variable interactions.
Nanoceramic Powder Market Segment Analysis
By Powder Type:
Carbide Variants Gain on Semiconductor DemandCarbide powders, notably silicon carbide, are stealing share from oxides despite oxide grades locking in 62.72% of the nanoceramics powder market in 2025. Silicon-carbide nanopowders are now integral to wide-bandgap chips, which can withstand junction temperatures of 200 °C. This advancement allows electric-vehicle inverters to eliminate bulky cooling hardware, resulting in a significant reduction in mass. In the realm of automotive stamping, tungsten-carbide nano-grain inserts boost tool life during hardened-steel cuts, enhancing machine uptime. The nanoceramics powder market size for carbide grades is projected to grow at a 17.07% CAGR through 2031. This is largely due to their continued demand in capacitors, implants, and polishing applications. Nitrides, particularly aluminum-nitride substrates, are carving out niches in thermal management, boasting commendable conductivity for LED packages. Meanwhile, boron-based powders find their footing in defense and nuclear sectors, where their neutron-absorption capabilities overshadow cost considerations. In aerospace, additive-manufacturing trials are evaluating titanium-diboride and hafnium-carbide spheres, aiming for oxidation thresholds exceeding 1,600 °C, in line with ASTM F3303 standards.
Oxide suppliers are bolstering their market position through scaled capacities and a keen understanding of regulatory landscapes. Alumina remains the go-to for multilayer ceramic capacitors, while zirconia's inherent toughness and biocompatibility are carving out a larger presence in orthopedics. However, procurement teams are wary of the price sensitivity associated with oxides, particularly given the geopolitical volatility surrounding rare-earth stabilizers like yttria. In response, producers are innovating with dopant-optimized batches, managing to reduce yttria loadings while ensuring phase stability remains intact. This shift in value dynamics, favoring carbide and nitride powders, highlights a market divergence: while high-volume oxide lines prioritize cost efficiency, carbide lines are honing in on margins, emphasizing precise particle-size control crucial for semiconductor and hypersonic applications.

By Synthesis Technology:
Medical Sector Outpaces ElectronicsElectronics consumed 44.56% of 2025 shipments, buoyed by strong sales of multilayer ceramic capacitors. Yet orthopedic, dental, and implantable devices propel medical demand at a 19.31% CAGR, setting the highest acceleration among end users. The market for nanoceramics powder in medical applications is projected to grow substantially by 2031, fueled by regulatory endorsements of zirconia-toughened alumina under ISO 13356. As volumes rise for polymer-ceramic vertebral cages and dental abutments, suppliers achieving higher purity standards through hot-isostatic pressing and trace-metal analytics are reaping the rewards.
Industrial sectors, from cutting tools to refractory linings, command a significant share but remain sensitive to global PMI fluctuations. The transportation sector is adopting silicon-nitride parts for turbomachinery and carbon-ceramic brakes, with Brembo reporting notable uptake in premium trims for 2025. In the chemical sector, the focus is on catalyst supports, where alumina nanopowders boast impressive surface areas exceeding 200 square meters per gram. The defense sector, while niche, proves lucrative, highlighted by boron-carbide tiles that meet IHPS armor standards. Additionally, emerging sectors like fuel cells and photocatalytic water treatment are projected to consume substantial volumes annually by 2030.
Geography Analysis
APAC Nanoceramic Powder Market
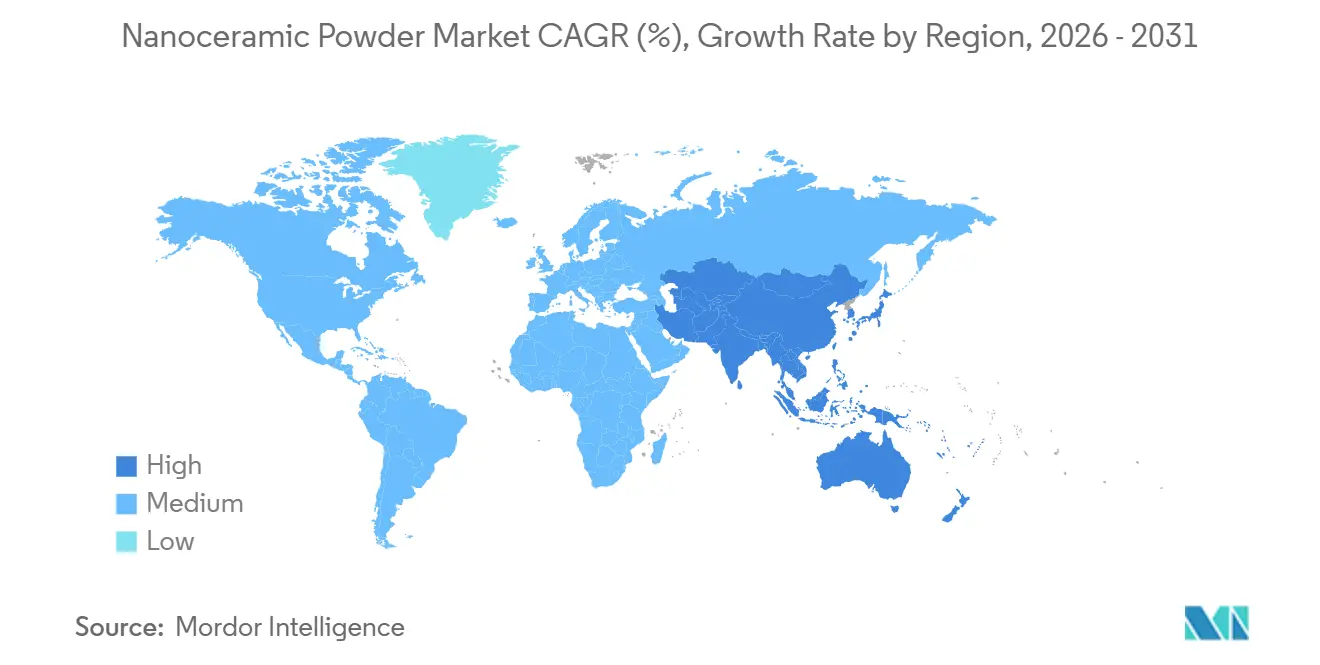
Asia-Pacific accounted for 50.73% of 2025 revenue and carries the fastest 16.06% CAGR outlook. China's successor to the "Made in China 2025" initiative has allocated a substantial amount in subsidies, aiming for high domestic content in electronic-grade powders by 2028. Japan's NEDO is backing 14 consortia, focusing on sub-50 nm alumina for 6G resonators. South Korea, with significant exports in ceramic capacitors, boasts numerous powder-demanding lines in Busan and Sejong. India's PLI scheme has invested in LLZO electrolyte pilots in Jamnagar. Meanwhile, Vietnam and Thailand have seen a notable surge in FDI for ceramic assembly parks, enhancing regional supply resilience.
North America Nanoceramic Powder Market
North America, holding a significant market share, is bolstered by defense initiatives and the CHIPS Act, which offers substantial incentives. These incentives mandate U.S.-sourced high-purity alumina for new fabs in Ohio and Arizona. While Canada's tax credit for rare-earth refineries hasn't yet led to commissioning milestones, Mexico benefited from USMCA rules, exporting ceramic-coated engine parts to the U.S. in 2025.
EMEA and South America Nanoceramic Powder Market
Europe, capturing a notable portion of the revenue, sees Germany's automotive push, France's Safran integrating CMC hot sections, and the UK investing in fusion-reactor tiles. South America and the Middle-East and Africa, together accounting for a smaller share, are highlighted by Brazil's Petrobras testing alumina-nanoparticle drilling fluids and Saudi Arabia's NEOM project procuring ceramic-coated solar-thermal receivers.
Regulatory Landscape
Nanoceramic powder producers operate under chemical safety regimes that increasingly require nanoform-specific characterization data, particularly in Europe. Under EU REACH (Regulation (EC) 1907/2006), ECHA tracks nanoform registrations and, as of April 23, 2026, noted 1,109 registration dossiers covering 186 registered nanoform substances. This supports the market need for data packages that cover particle size distribution and surface modifications alongside conventional substance identity requirements.
Occupational exposure and product stewardship requirements are also tightening for fine powders used across electronics, medical, and coatings. Japan’s MHLW mandated nanomaterial labeling on Safety Data Sheets in 2024, including disclosure of particle-size distributions. In Europe, CEN/TS 18267:2026 (published April 2026) advances test and measurement commonality for detecting and characterizing inorganic nano-objects, which improves alignment on analytical methods used in compliance dossiers and customer qualification.
Value Chain Analysis
The value chain starts with high-purity feedstocks and precursors (alumina, zirconia, yttria and other rare-earth stabilizers, silanes and dispersants), then moves into nano-grade synthesis using sol-gel, hydrothermal, gas-phase routes, or plasma processes. After that, powders go through deagglomeration, classification, and surface functionalization to meet tight particle-size and dispersion requirements. Downstream, these materials are converted into slurries, coatings, compacts, or granules, then densified through processes such as spark plasma sintering (SPS) and hot isostatic pressing (HIP) for components used in electronics, medical implants, and turbine and aerospace coatings, including defense applications.
Qualification and compliance act as gatekeepers across aerospace, defense, and semiconductor supply chains. Long supplier validation timelines and standards-driven audits slow substitution, which benefits established producers. Bottlenecks concentrate around energy intensity in advanced synthesis and around upstream availability of rare-earth oxide processing, which is heavily concentrated in China. As a result, Western and Japanese buyers have leaned toward multi-year procurement agreements, vertical integration into critical precursors, and tighter control of feedstock specifications to maintain purity, traceability, and supply continuity.
Competitive Landscape
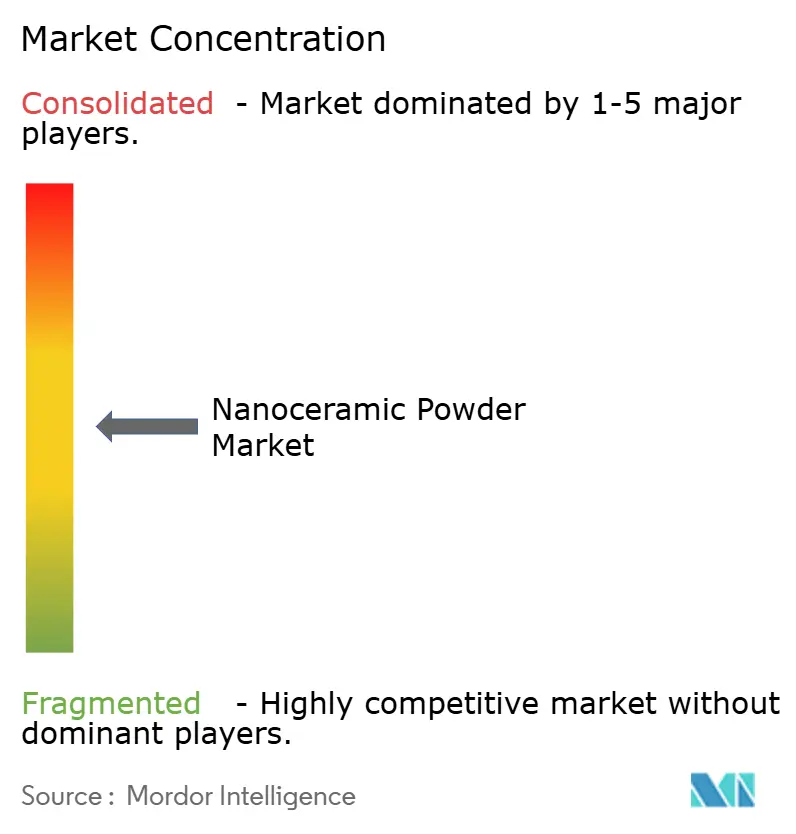
The global nanoceramic powder market is moderately fragmented. Emerging university spin-offs leverage flame-spray pyrolysis to slash energy intensity, promising commercial volumes by 2028. Material specifications continue to tighten, demanding particle-size standard deviations under 10 nm and bulk tap densities above 1.2 g cm⁻³. Buyers now list ISO 17034 and ISO 13320 compliance as non-negotiable RFQ clauses. Incumbents thus pursue backward integration into rare-earth separation and silane coupling to secure cost and purity control. Strategic alliances—such as Sumitomo Chemical’s 2025 joint venture with an aerospace tier-one to co-locate plasma-spray feedstock lines—underline the shift from commodity tonnage toward application-specific formulations.
Nanoceramic Powder Industry Leaders
-
Tosoh Corporation
-
Saint-Gobain
-
Nanophase Technologies Corporation
-
Innovnano-Materiais Avançados SA
-
Cerion LLC
- *Disclaimer: Major Players sorted in no particular order
Nanoceramic Powder Market Companies Covered in this Report
- ABM Advance Ball Mill Inc.
- American Elements
- Beijing DK Nano Technology Co. Ltd
- Cerion LLC
- Inframat Advanced Materials LLC
- Innovnano-Materiais Avançados SA
- IoLiTec Ionic Liquids Technologies GmbH
- Nanografi
- Nanophase Technologies Corporation
- Nanoshel LLC
- Nanostructured & Amorphous Materials, Inc.
- NYACOL Nano Technologies Inc.
- PlasmaChem GmbH
- Resonac Corporation
- Saint-Gobain
- Sumitomo Chemical Co., Ltd.
- Tosoh Corporation
- TRUNNANO
Market Opportunities and Future Outlook
Semiconductor and advanced electronics supply chains create opportunities for nano- and submicron ceramic powders that improve morphology control, purity, and densification behavior. Demand is particularly visible across alumina, zirconia, aluminum nitride, and CMP-related ceria systems. A clear signal comes from Kyocera International’s April 2026 expansion of its Fine Ceramics manufacturing plant in Hendersonville, North Carolina, which included installation of 30,000-psi cold isostatic pressing capability. That adds domestic processing capacity for high-performance ceramics used in semiconductor, aerospace, and energy programs.
Scaling opportunities also track Asia’s buildout of thermal-management and nitride materials for power electronics and packaging. In May 2026, Juci Technology commenced Phase I operations at its Inner Mongolia base in Hohhot with four aluminum nitride production lines, and it stated annual capacities for micron powder and thermally conductive filler powder, pointing to continued investment in conductive ceramic supply. Companies are also working to reduce process-cost and sustainability friction through technical pathways such as rapid sintering and lower-energy synthesis routes for oxides and carbides. This can support more economical qualification of nano powders where compliance testing and dust-control retrofits remain cost centers.
Recent Industry Developments in Nanoceramic Powder Market
- April 2026: Kyocera International expanded its Fine Ceramics manufacturing plant in Hendersonville, North Carolina, adding 16,000 sq. ft. and installing 30,000-psi cold isostatic pressing capability. The upgrade strengthens North American capacity for high-performance ceramics used in semiconductor, aerospace, and energy applications, tightening lead times for qualified ceramic supply chains.
- October 2025: Saint-Gobain Ceramics and Eurodia Industrie announced a strategic partnership to deliver integrated material and process solutions for direct lithium extraction using lithium-selective adsorbent materials. The collaboration links ceramic material know-how with process engineering, expanding addressable demand tied to battery-material supply chains where specialty powders and porous ceramic structures are central.
- April 2024: Nanophase Technologies entered into a litigation settlement and amended an existing supply contract with BASF. The resolution reduced uncertainty around continuity of supply relationships and supports more stable planning for nanoparticle-based product lines that draw on nanoceramic-type materials.
Nanoceramic Powder Market Report Scope and Research Methodology
Market Definition and Coverage
For this study, the nanoceramics powder market covers engineered ceramic powders with nanoscale particle sizes that are sold for use in industrial and advanced applications, where performance depends on properties like strength, wear resistance, thermal stability, or electrical behavior.
Scope exclusions: We exclude downstream parts and finished components made from these powders, along with services such as coating application and contract manufacturing.
Segments Covered in This Report
- By Powder Type
- Oxide Powder
- Carbide Powder
- Nitride Powder
- Boron Powder
- Other Types
- By Synthesis Technology
- Electrical and Electronics
- Industrial
- Transportation
- Medical
- Chemical
- Defense
- Other End-user Industries
- By Geography
- Asia-Pacific
- China
- India
- Japan
- South Korea
- ASEAN Countries
- Rest of Asia-Pacific
- North America
- United States
- Canada
- Mexico
- Europe
- Germany
- United Kingdom
- France
- Italy
- Russia
- Rest of Europe
- South America
- Brazil
- Argentina
- Rest of South America
- Middle-East and Africa
- Saudi Arabia
- South Africa
- Rest of Middle-East and Africa
- Asia-Pacific
Data Sources, Market Sizing, and Validation
Desk Research
Desk research was used to set the boundary of what counts as nanoceramic powder revenue and to anchor the model with public indicators that move with production and demand. We referred to sources such as the USGS mineral commodity data, the US Census Bureau and UN Comtrade trade statistics, the International Energy Agency for battery related demand context, and standards or technical publications from bodies such as ISO.
To make the inputs usable for sizing, we also reviewed company annual reports, investor presentations, patents from public patent offices, and trusted press coverage on capacity additions and material qualification cycles. In a few places, an approved paid subscription for company financials and a patent database was used to speed up cross checks. These desk research sources are illustrative, and many other public references were also used for data collection, validation, and clarification.
Primary Interviews and Surveys
Primary work focused on validating what is actually shipped and paid for, then mapping where demand is coming from across electronics, industrial, transportation, medical, chemical, and defense use cases. We spoke with powder producers, distributors, and procurement and technical stakeholders, and kept the mix balanced across APAC, EMEA, and the Americas so regional pricing and adoption timing did not get distorted by one dominant geography.
Distribution of primary research fieldwork respondents
| Company type | Respondent position | Region |
|---|---|---|
| Top tier: 26% | CXOs: 13% | APAC: 45% |
| Mid tier: 60% | Functional/Unit leaders: 30% | EMEA: 34% |
| Smaller Players: 14% | Managers: 57% | Americas: 21% |
Market-Sizing & Forecasting
Market sizing was built using a top-down and bottom-up blend, where the main totals were reconstructed from end use demand pools and then stress tested through supplier and channel signals. On the top-down side, demand was mapped by linking nanoceramic powder usage to indicators like electronics production intensity, battery manufacturing expansion, defense and medical qualification timelines, and industrial wear part replacement cycles, which are then translated into powder consumption and value.
Once that view was formed, it was corroborated with selective bottom-up approximations, such as sampled average selling prices by powder type (oxide, carbide, nitride, and other) multiplied by estimated volumes for key applications, followed by distributor channel checks for regional splits. Where company disclosures were limited, gaps were handled through peer benchmarking and normalization by capacity, utilization, and typical yield loss in nano powder processing.
For forecasting, scenario analysis was used, because pricing and adoption can swing with energy costs, input materials, and the speed of new end uses (like batteries) moving from trials to volume production. The forward path was then adjusted using interview consensus on ASP progression, qualification lead times, and planned capacity additions by region.
Data Validation & Update Cycle
Validation was done by triangulating the model outputs against independent signals, and then checking any variance that did not fit the industry story. We compared implied demand growth with trade flows, capacity announcements, and application level growth markers, and when mismatches appeared, assumptions were revisited and, if needed, respondents were re-contacted to confirm the direction and magnitude.
Before sign-off, the work goes through multi-step analyst reviews that focus on arithmetic checks, scope consistency, and reasonableness of price and volume movements across regions. Reports are refreshed annually, and interim updates are made when there is a material event like a major capacity start-up, policy shift, or sharp raw material move. Right before delivery, a final pass is completed so clients receive the latest updated view.
Mordor Intelligence's Nanoceramics Powder Market Size Compared With Other Published Estimates
Market size numbers for nanoceramics powder do not always match across publications, even when the market name looks the same. Differences typically come from what is counted as powder revenue versus finished components, what years are treated as the base, and how pricing is handled when nano grades carry large premiums.
By tracking powder type splits, refreshing average selling price assumptions quarterly, and then validating conversion and end use adoption checks, Mordor Intelligence keeps the total tied to powder shipments rather than mixing in downstream parts, which is one common reason for wider spreads.
Benchmark comparison
| Source | Market Size | Gaps in Research Methodology |
|---|---|---|
| Mordor Intelligence | USD 4.07 B (2026) | |
| Global Consultancy A | USD 3.40 B (2025) | Uses a different base year and appears to apply a narrower price deck, which can understate value when high purity nano grades are adopted faster in electronics and defense. |
| Industry Publisher B | USD 11.40 B (2025) | Likely folds in adjacent revenues beyond powders, such as nanoceramic materials used in coatings or processed components, and may also assume a higher average price uplift without aligning to shipment mix. |
The table shows that the spread is mainly explained by scope boundaries and pricing mechanics, rather than a disagreement on growth direction. When powder-only revenues are kept separate and pricing is linked to chemistry mix and qualification stage, the market total becomes easier to reproduce and re-check year over year using the same steps and inputs.
Key Questions Answered in the Report
What is the forecast value of the nanoceramics powder market in 2031?
The market is projected to reach USD 8.27 billion by 2031 from USD 4.07 billion in 2026, registering a 15.25% CAGR.
Which powder category will grow the fastest through 2031?
Carbide powders, led by silicon carbide, are expected to expand at a 17.07% CAGR.
Why is medical demand for nanoceramics accelerating?
Regulatory approvals for zirconia-based implants and 40% shorter dental-crown chair times are driving a 19.31% CAGR in medical consumption.
Which region contributes the largest revenue share?
Asia-Pacific delivered 50.73% of global revenue in 2025 and is on track to remain the largest contributor.
How are defense programs influencing powder specifications?
Hypersonic projects require boron- and hafnium-carbide nanopowders that resist temperatures above 2,000 °C, steering procurement toward ultra-high-temperature ceramics.
What is the main supply-chain risk facing Western producers?
Dependence on Chinese exports for yttrium and cerium oxides exposes manufacturers to licensing delays and price spikes.