
Myelodysplastic Syndrome (MDS) Treatment Market Size and Share
Market Overview
| Study Period | 2020 - 2031 |
|---|---|
| Forecast Data Period | 2026 - 2031 |
| Market Size (2026) | USD 3.69 Billion |
| Market Size (2031) | USD 5.59 Billion |
| Growth Rate (2026 - 2031) | 8.63 % |
| Fastest Growing Market | Asia Pacific |
| Largest Market | North America |
Major Players *Disclaimer: Major Players sorted in no particular order Image © Mordor Intelligence. Reuse requires attribution under CC BY 4.0. | |
Myelodysplastic Syndrome (MDS) Treatment Market Analysis by Mordor Intelligence
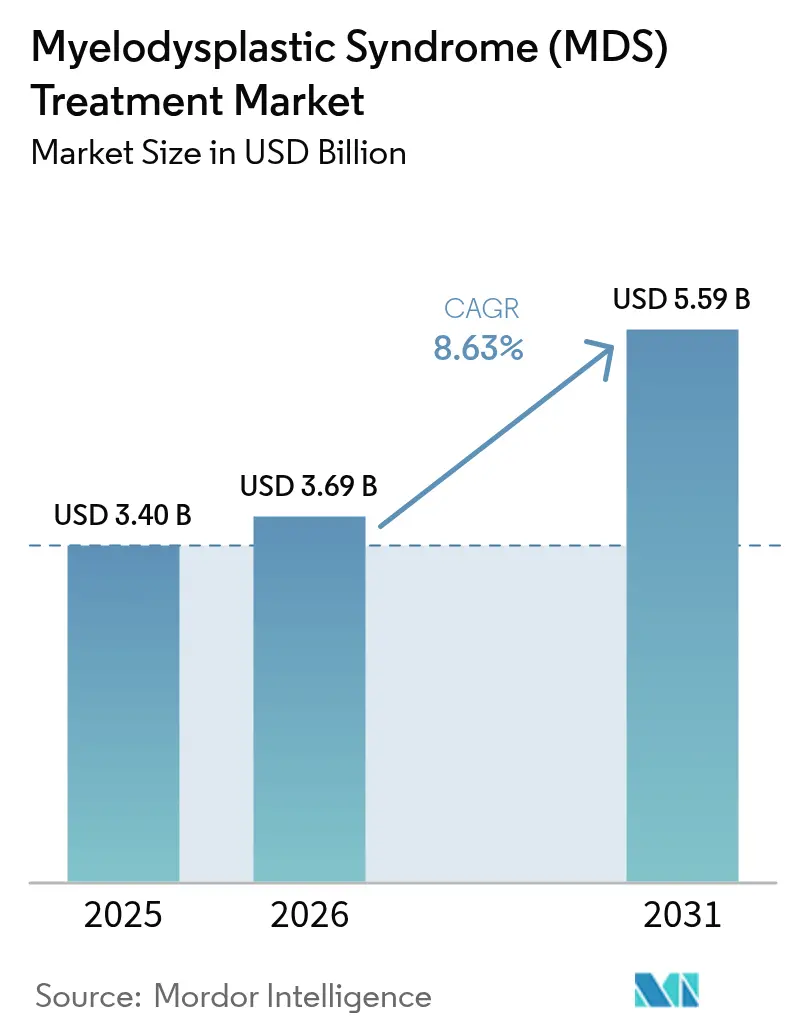
The Myelodysplastic syndrome treatment market size is expected to grow from USD 3.4 billion in 2025 to USD 3.69 billion in 2026 and is forecast to reach USD 5.59 billion by 2031 at 8.63% CAGR over 2026-2031. Rapid regulatory approvals of breakthrough drugs such as imetelstat and treosulfan-fludarabine are shortening development timelines and widening patient access. Precision oncology, expanding geriatric populations, and hospital-led molecular triage programs are converging to lift treatment volumes, while strong venture funding is accelerating gene-edited transplant platforms. Asia Pacific, supported by sustained healthcare capital expenditure and rising diagnostic rates, is the fastest-growing region. Headwinds include cytopenia-linked toxicity that curtails adherence and escalating cost-effectiveness scrutiny in public payor systems, yet AI-driven prognostic tools are improving dose individualization and preserving drug margins.
Key Report Takeaways
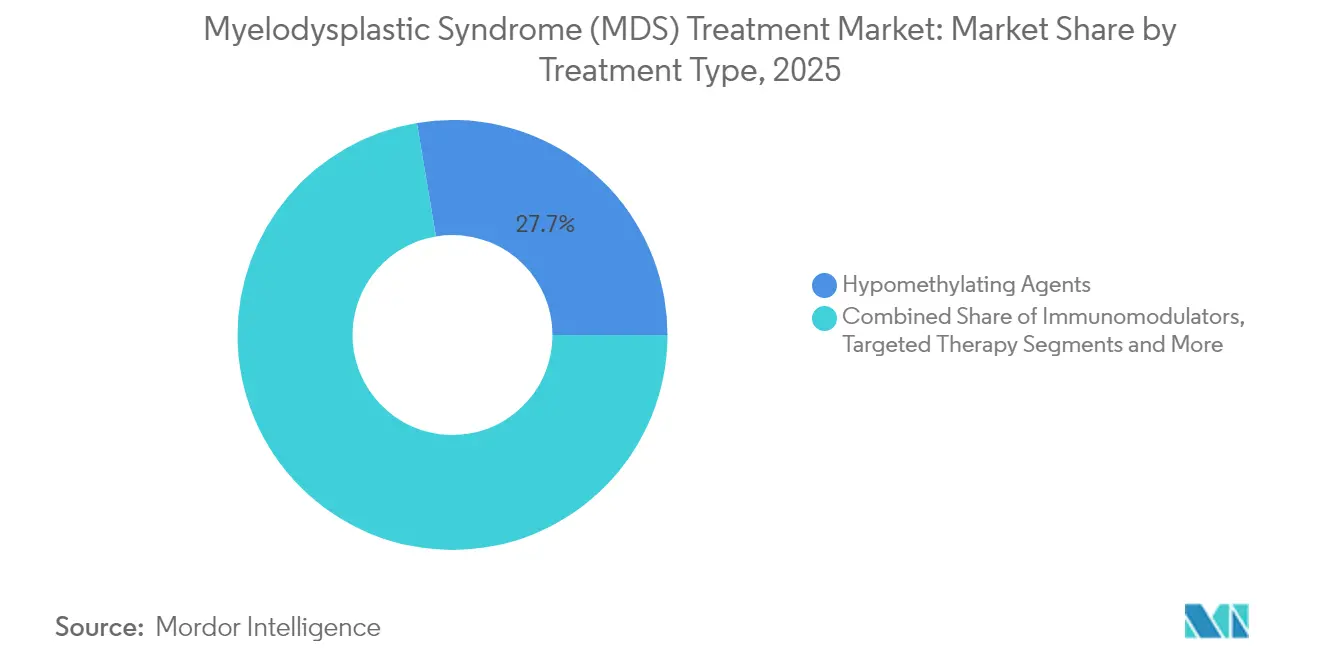
- By treatment type, hypomethylating agents led with 27.65% of the Myelodysplastic syndrome treatment market share in 2025, while targeted therapy is expanding at a 11.72% CAGR through 2031.
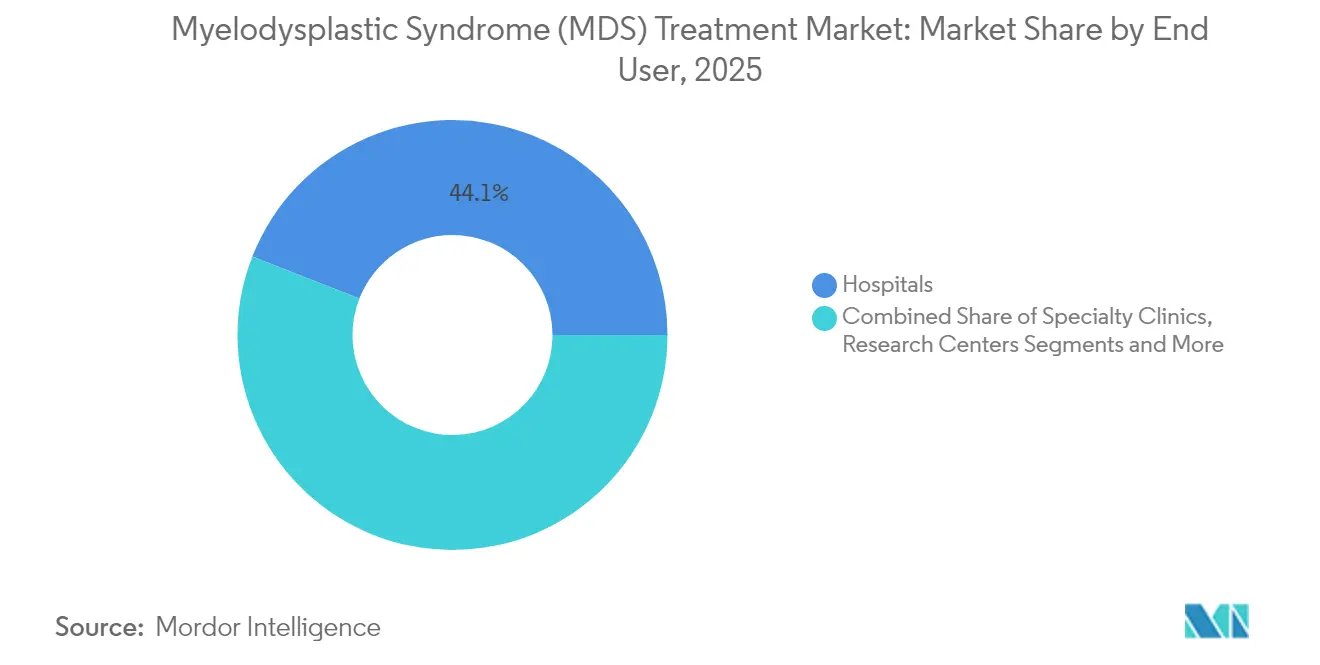
- By end user, hospitals held a 44.05% share of the Myelodysplastic syndrome treatment market in 2025, and online pharmacies are advancing at an 11.05% CAGR to 2031.
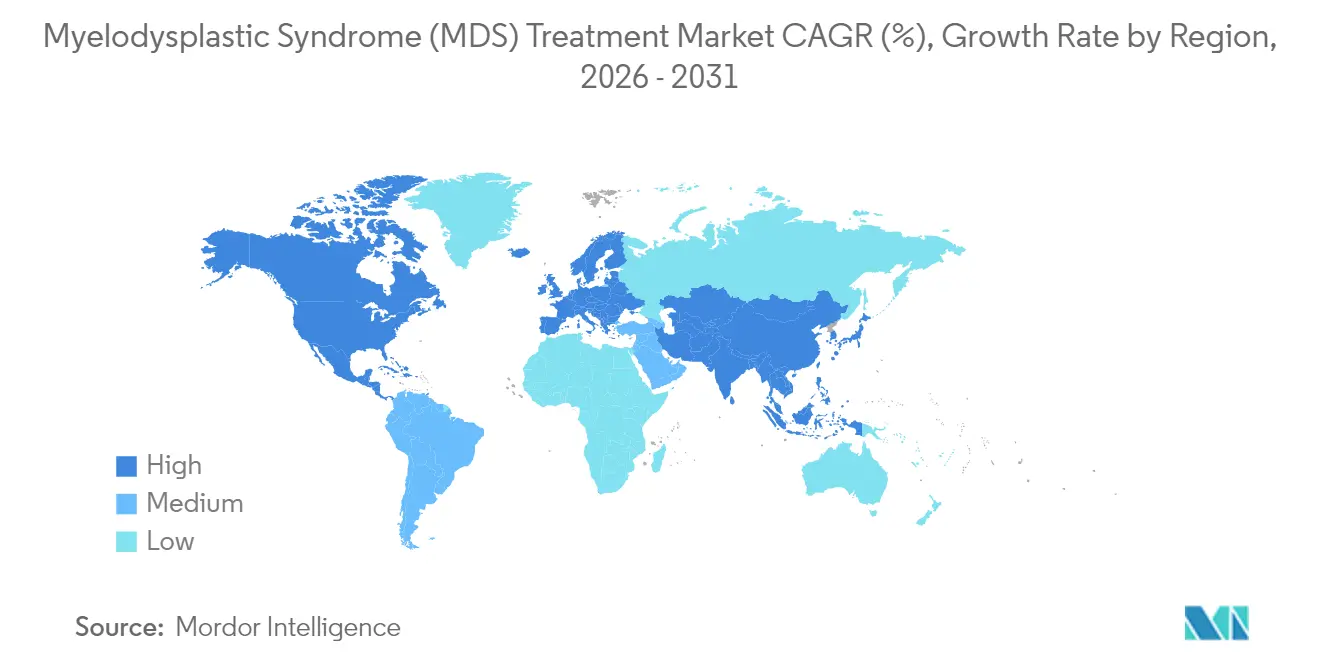
- By geography, North America commanded 38.95% share of the Myelodysplastic syndrome treatment market in 2025; Asia Pacific is projected to rise at a 10.21% CAGR during the same period.
Note: Market size and forecast figures in this report are generated using Mordor Intelligence’s proprietary estimation framework, updated with the latest available data and insights as of 2026.
Market Trends and Insights
Drivers Impact Analysis of Myelodysplastic Syndrome (MDS) Treatment Market*
| Driver | (~) % Impact on CAGR Forecast | Geographic Relevance | Impact Timeline |
|---|---|---|---|
| High R&D spending on next-generation hypomethylating and combination regimens | +2.10% | North America, Europe | Medium term (2-4 years) |
| Accelerated FDA/EMA breakthrough & orphan designations | +1.80% | North America, European Union | Short term (≤ 2 years) |
| Ageing population-linked incidence surge | +1.40% | China, Western Europe, Japan | Long term (≥ 4 years) |
| Hospital-initiated molecular triage programs | +1.20% | North America, selective APAC markets | Medium term (2-4 years) |
| Venture-capital funding for ex-vivo gene-edited HSCT | +0.90% | Global, led by North America | Long term (≥ 4 years) |
| AI-driven prognostic scoring tools | +0.70% | North America, European Union | Medium term (2-4 years) |
| Source: Mordor Intelligence | |||
High R&D Spending on Next-Generation Hypomethylating and Combination Regimens
Capital allocation into multi-agent regimens is accelerating after luspatercept delivered 58.5% transfusion independence versus 31.2% for epoetin alfa in the COMMANDS trial.[1] Novartis is running a Phase III evaluation of MBG453 plus azacitidine, and Takeda licensed elritercept (TAK-226) to broaden its anemia pipeline. These programs target distinct mutational profiles, boosting response durability and underpinning the medium-term uplift in the Myelodysplastic syndrome treatment market.
Accelerated FDA/EMA Breakthrough & Orphan Designations
Fast-track pathways are compressing time-to-market. The FDA granted orphan designation to bexmarilimab in March 2025, while the EMA issued a positive CHMP opinion for imetelstat in December 2024 ahead of a March 2025 clearance.[2] Such regulatory alignment is drawing biotechnology capital and accelerating global launches.
Ageing Population-Linked Incidence Surge
Median diagnosis ages of 67 years in Western countries and 52 years in Chinese cohorts highlight pressing demand for expansion.[3] Japanese incidence reached 1.6 per 100,000 men, increasing steadily with population aging. Demographic pressure is steering developers to design low-toxicity regimens appropriate for frail patients.
Hospital-initiated molecular triage programs
Routine next-generation sequencing now precedes overt cytopenia in many U.S. and EU centers, allowing earlier, lower-dose intervention. TP53 mutation status predicts superior decitabine response and guides regimen intensity. Hospitals are pairing sequencing with AI blood-test algorithms that raise diagnostic accuracy, reinforcing demand for precision drugs.
Restraints Impact Analysis of Myelodysplastic Syndrome (MDS) Treatment Market*
| Restraint | (~) % Impact on CAGR Forecast | Geographic Relevance | Impact Timeline |
|---|---|---|---|
| Severe Cytopenia-Related Adverse Events Limiting Drug Adherence | -1.60% | Global, particularly acute in elderly populations | Short term (≤ 2 years) |
| High Total-Care Cost Versus QALY Thresholds In Public Payor Systems | -1.30% | Europe, Canada, emerging markets with public healthcare | Medium term (2-4 years) |
| Donor-Matching Bottlenecks For Allogeneic HSCT In Emerging Markets | -1.00% | Asia Pacific, Middle East & Africa, South America | Long term (≥ 4 years) |
| Limited Predictive Biomarkers For HMA-Refractory Patients | -0.80% | Global, with research concentration in North America & Europe | Medium term (2-4 years) |
| Source: Mordor Intelligence | |||
Severe Cytopenia-Related Adverse Events Limiting Drug Adherence
Thrombocytopenia and neutropenia required dose modifications in 40% of imetelstat recipients in pivotal trials. Similar issues arise with hypomethylating agents, leading to premature discontinuation that blunts therapeutic benefit. Developers are engineering antibody-drug conjugates and selective inhibitors with narrower marrow impact to offset this short-term drag on the Myelodysplastic syndrome treatment market.
High Total-Care Cost Versus QALY Thresholds In Public Payor Systems
Oral precision drugs often exceed established cost-effectiveness thresholds, driving strict reimbursement filters, particularly in Western Europe. Health technology bodies are requesting real-world outcomes evidence before broad coverage, slowing uptake in price-sensitive markets and dampening the medium-term contribution of premium therapies to the Myelodysplastic syndrome treatment market.
*Our forecasts treat driver/restraint impacts as directional, not additive. The impact forecasts reflect baseline growth, mix effects, and variable interactions.
Myelodysplastic Syndrome (MDS) Treatment Market Segment Analysis
By Treatment Type:
Targeted Therapy Accelerates GrowthTargeted therapy posted the fastest 11.72% CAGR to 2031, reshaping the competitive field even though hypomethylating agents still accounted for 27.65% of the Myelodysplastic syndrome treatment market share in 2025. The approval of imetelstat, the first telomerase inhibitor, validates mechanism-specific development. Venetoclax-based combinations reached 96% overall response, underscoring the clinical upside of biomarker-matched regimens.
Expanding molecular diagnostics that stratify patients by TP53, SF3B1, and IDH mutations are reinforcing demand for targeted agents and guiding drug choice. Although chemotherapeutic conditioning remains vital for HSCT candidates, oral high-selectivity compounds are gaining frontline positioning in lower-risk cohorts. Premium pricing is counterbalanced by improved transfusion independence, lowering supportive-care costs, and lifting the segment’s contribution to the Myelodysplastic syndrome treatment market size over the forecast horizon.

By End User:
Homecare Reshapes Delivery ModelsHospitals retained a 44.05% revenue share in 2025, reflecting their central role in transfusion services and HSCT. Yet homecare and online pharmacies are registering an 11.05% CAGR due to oral hypomethylating therapies such as INQOVI, which eliminate infusion center visits.
Medicare’s 2025 home health payment update and broad telehealth reimbursement have catalyzed remote monitoring adoption. Tablets with adherence-tracking sensors and AI-driven toxicity alerts ensure safety outside acute settings, improving patient quality of life while reducing total care expenditure. Thus, they deepen the penetration of ambulatory channels within the Myelodysplastic syndrome treatment market.
Geography Analysis
North America and Europe Myelodysplastic Syndrome (MDS) Treatment Market
North America led with a 38.95% share of the Myelodysplastic syndrome treatment market in 2025, owing to robust clinical-trial infrastructure, swift FDA pathways, and favorable reimbursement. Early uptake of imetelstat, luspatercept, and treosulfan-fludarabine illustrates the region’s appetite for innovation. Europe follows, supported by universal healthcare and EMA alignment. Germany, France, and the United Kingdom quickly incorporated telomerase inhibition after the March 2025 approval, while cost-containment forces are steering payors toward oral agents with lower administration overheads.
APAC Myelodysplastic Syndrome (MDS) Treatment Market
Asia Pacific is the fastest-growing sub-region at 10.21% CAGR through 2031. China’s younger median diagnosis age and distinct cytogenetics are driving domestic research and localized guidelines. Japan’s aging population and sophisticated insurance coverage foster high drug adoption, whereas India’s widening middle class and medical-tourism hubs are improving therapy access. Regulatory harmonization projects, such as ASEAN CTPP, are set to streamline approvals, providing further upside for the Myelodysplastic syndrome treatment market.
MEA Myelodysplastic Syndrome (MDS) Treatment Market
Emerging regions face infrastructure gaps. However, the United Arab Emirates opened a comprehensive HSCT center at Burjeel Medical City in 2024, and Egypt’s transplant program surpassed 4,000 cumulative procedures, signaling capacity upgrades that will gradually expand the addressable patient pool.
Regulatory Landscape
The regulatory environment for myelodysplastic syndrome (MDS) therapies is shaped by expedited pathways and rare-disease incentives led by the US Food and Drug Administration (FDA) and the European Medicines Agency (EMA). In June 2024, the FDA approved Rytelo (imetelstat) for transfusion-dependent anemia in adult patients with lower- to intermediate-1 risk MDS, strengthening the role of first-in-class targeted mechanisms moving through accelerated review and post-marketing safety oversight.
Within the European Union, orphan designations continue to be a key lever for pipeline advancement and access planning. EMA actions in 2025 show both momentum and portfolio churn, including a positive opinion from the EMA Committee for Orphan Medicinal Products (COMP) for bexmarilimab as an orphan drug (in combination with azacitidine) in February 2025, and an additional orphan designation for an MDS treatment under EU/3/25/3044 in April 2025. In February 2025, Gilead withdrew the EU orphan designation for magrolimab (EU/3/20/2288) at the sponsor's request.
Value Chain Analysis
The MDS treatment value chain starts with discovery and clinical development led by oncology-focused biopharma, followed by regulatory submission. Specialized manufacturing supports both small-molecule and biologics, and distribution relies on hospital and specialty channels alongside diagnostic triage to place patients on appropriate therapies. Recent EU commercialization milestones for anemia-focused agents, including the European Commission authorization of Reblozyl (luspatercept) expansion in March 2024 and the European Commission marketing authorization for Rytelo (imetelstat) in March 2025, show how regulatory outcomes translate into formulary discussions, specialist prescribing, and hospital-based administration and monitoring.
Manufacturing and supply continuity are driven by API sourcing and quality systems, with many small-molecule inputs linked to Asia-Pacific production while final formulation and release are concentrated in North America or Europe. Downstream, reimbursement and health-technology assessment bodies shape uptake and line-of-therapy placement, illustrated by Germany's G-BA actions around luspatercept. Late-stage biologics and cell-based programs add operational complexity through cold-chain logistics, centralized release testing, and transplant-center coordination, including the FDA acceptance of Orca Bio's BLA for Orca-T under Priority Review in November 2025.
Competitive Landscape
The Myelodysplastic syndrome treatment market remains moderately concentrated. Bristol Myers Squibb leveraged the Celgene acquisition to dominate anemia management with luspatercept, while also advancing venetoclax combinations under investigational protocols. Geron commercialized imetelstat across the United States and Europe in under nine months, underscoring execution speed.
Rigel, Takeda, and Novartis are competing on novel targets including IRAK1/4 and TIM-3, often via co-development agreements that distribute risk. Takeda’s license of elritercept from Keros exemplifies pipeline expansion through external innovation. Gene-editing entrants, backed by venture funds, are pursuing curative ex vivo transplantation solutions, though manufacturing complexity poses entry barriers.
Market incumbents rely on scale efficiencies in manufacturing, pharmacovigilance, and global supply to defend share. Yet, the rise of AI-enabled patient stratification platforms lowers the threshold for niche biotech challengers that can identify underserved molecular subsets. The competitive narrative is therefore characterized by strategic alliances, lifecycle management of first-in-class assets, and a measured expansion into outpatient-friendly formulations to capture demand in the rapidly evolving Myelodysplastic syndrome treatment market.
Myelodysplastic Syndrome (MDS) Treatment Industry Leaders
-
Takeda Pharmaceutical Company Limited
-
Bristol-Myers Squibb
-
LUPIN
-
Accord Healthcare
-
Otsuka America Pharmaceutical, Inc.
- *Disclaimer: Major Players sorted in no particular order

Myelodysplastic Syndrome (MDS) Treatment Market Companies Covered in this Report
- Bristol Myers Squibb (Celgene)
- Novartis
- Takeda Pharmaceuticals
- Abbvie
- Jazz Pharmaceuticals
- Otsuka Pharma
- Amgen
- AstraZeneca
- Geron Corp.
- Merck & Co. (Acceleron)
- Gilead Sciences
- Fate Therapeutics
- Onconova Therapeutics
- StemLine Therapeutics
- Keros Therapeutics
- Rigel Pharmaceuticals
- Faron Pharmaceuticals
- Astellas Pharma
- BeiGene Ltd.
- Suzhou ImmuneOnco
- additional firms as identified
Read Analysis of Myelodysplastic Syndrome (MDS) Treatment Companies
Market Opportunities and Future Outlook
Opportunity remains concentrated in lower-risk, transfusion-dependent MDS where anemia control and durable transfusion independence carry both clinical and economic value. Market activity and evidence support continued movement toward differentiated anemia agents, with the FDA approval of Rytelo (imetelstat) in June 2024 providing an additional telomerase-inhibitor option for ESA-failed or ineligible patients. Data discussed at the EHA 2026 Congress also pointed to dosing optimization and novel oral mechanisms in lower-risk disease, including Reblozyl initiation at the maximum approved dose (MAXILUS) and phase 2 results for oral ofirnoflast.
In higher-risk MDS, the clearest opportunities center on regimens that improve outcomes beyond hypomethylating-agent monotherapy while handling cytopenia-linked tolerability and payer scrutiny. Recent clinical readouts highlight that development focus, with an International Consortium for MDS analysis published in Blood Cancer Journal reporting higher response rates with venetoclax plus hypomethylating agents without an overall survival extension versus monotherapy, reinforcing the need for better endpoint strategy and patient selection. Regulatory clarity is also influencing investment planning, including the FDA draft guidance issued in July 2025 on developing drug and biological products for MDS, which encourages sponsors to align trial endpoints, risk stratification (including molecular profiling), and post-approval evidence generation with regulator expectations.
Recent Industry Developments in Myelodysplastic Syndrome (MDS) Treatment Market
- June 2026: Halia Therapeutics received US FDA Fast Track designation for ofirnoflast (HT-6184) in lower-risk myelodysplastic syndromes. The designation supports more frequent FDA interactions and can accelerate development for a novel oral mechanism, increasing competitive pressure in transfusion-dependent lower-risk MDS where differentiated safety and convenience matter.
- July 2025: Keros Therapeutics initiated the Phase 3 RENEW trial evaluating elritercept in transfusion-dependent anemia in MDS, triggering a USD 10 million milestone payment from Takeda under their licensing agreement. Moving into Phase 3 advances a late-stage anemia asset that broadens Takeda's hematology pipeline while also raising demand for scalable clinical supply and global trial operations.
- April 2024: Bristol Myers Squibb announced European Commission approval expanding Reblozyl (luspatercept) to include first-line treatment of transfusion-dependent anemia in adults with lower-risk MDS. The expanded EU label improves access and supports earlier prescribing in the treatment pathway, which can lift utilization in hospital and specialist clinic settings where transfusion services and MDS monitoring are concentrated.
Myelodysplastic Syndrome (MDS) Treatment Market Report Scope and Research Methodology
Market Definition and Coverage
For this report, the market includes revenues generated from therapies used to manage and treat myelodysplastic syndromes (MDS) in routine care, across major care settings and geographies, reported in USD at the manufacturer level.
Scope exclusions: Diagnostic testing, screening, and non-therapeutic supportive services are excluded, and procedure revenues are counted only when they are part of MDS treatment delivery.
Segments Covered in This Report
- By Treatment Type
- Chemotherapy
- Hypomethylating Agents
- Immunomodulators
- Targeted Therapy
- Other Treatment Types
- By End User
- Hospitals
- Specialty Clinics
- Academic & Research Centers
- Homecare & Online Pharmacies
- Geography
- North America
- United States
- Canada
- Mexico
- Europe
- Germany
- United Kingdom
- France
- Italy
- Spain
- Rest of Europe
- Asia Pacific
- China
- Japan
- India
- South Korea
- Australia
- Rest of Asia Pacific
- Middle East & Africa
- GCC
- South Africa
- Rest of Middle East & Africa
- South America
- Brazil
- Argentina
- Rest of South America
- North America
Data Sources, Market Sizing, and Validation
Desk Research
Desk research started with the MDS disease context and treatment landscape, then moved into the measurable demand pool for MDS therapies. We referenced public sources such as the WHO and IARC for cancer and hematology context, the US FDA and EMA for approvals and label changes, and the US National Cancer Institute for treatment pathway references and clinical background. Incidence and population by age were checked using sources such as SEER and the US Census, which helped keep the patient pool aligned with real-world demographics.
On the commercial side, we reviewed company annual reports, investor presentations, and press releases to track product mix changes and regional exposure. We also used paid subscriptions for company financials and intelligence, and patent databases to check pipeline direction where it affects near-term therapy uptake. The desk sources listed here are not exhaustive, and we also drew on other public and paid references to compile data, validate assumptions, and clarify gaps.
Primary Interviews and Surveys
Primary work was used to stress test the treatment mix and the pricing logic by country, since MDS care can vary by risk category, setting, and payer rules. We spoke with a mix of clinicians, hospital pharmacists, payers, and industry participants across the Americas, EMEA, and APAC. This helped fill gaps on switching patterns, duration of therapy, and the pace of uptake for newer options.
Distribution of primary research fieldwork respondents
| Company type | Respondent position | Region |
|---|---|---|
| Top tier: 25% | CXOs: 13% | APAC: 46% |
| Mid tier: 61% | Functional/Unit leaders: 37% | EMEA: 32% |
| Smaller Players: 14% | Managers: 50% | Americas: 22% |
Market-Sizing & Forecasting
Sizing was built using a top-down demand pool approach where epidemiology and treated share are converted into therapy volumes, then multiplied by an average annual therapy cost to reach value. The demand pool was shaped using variables such as MDS incidence by age band, split of lower-risk versus higher-risk cases, diagnosed and treated rate, average duration of therapy, and care setting mix (hospital versus clinic and home dispensing). Pricing assumptions were anchored on list and net price direction, including expected generic erosion where applicable, and then adjusted using local reimbursement feedback from interviews.
To keep totals realistic, we also ran selective bottom-up approximations using sampled country volumes and therapy mix checks from channel discussions, then reconciled these with reported revenue direction from public filings. Forecasting used scenario analysis with a base case guided by expert views on patient growth, guideline-driven adoption, and expected price progression, and then sensitivity tested for access restrictions and slower switching. Where country details were thin, gaps were handled by proxying from similar reimbursement markets, followed by rechecking the implied per-patient spend against clinician feedback.
Data Validation & Update Cycle
Outputs were validated by comparing the modeled treated patient counts and implied annual cost per patient against independent signals, including incidence trends, therapy utilization patterns, and regional reimbursement intensity. When a country total looked out of line, the assumptions were reworked, and where needed, respondents were re-contacted to confirm the direction of change in uptake, duration, and net pricing.
Before sign-off, the model and key assumptions go through multi-step analyst reviews, including variance checks across regions and year-over-year movement checks for the main drugs and therapy classes. The report is refreshed annually, and interim updates are triggered when material events occur, such as major approvals, safety updates, or meaningful pricing actions. Right before delivery, we run a final pass to ensure the latest public updates are reflected in both the narrative and the numbers.
Mordor Intelligence's Myelodysplastic Syndrome Treatment Market Size Versus Other Published Estimates
Published market sizes for MDS treatment can vary even when the topic name is the same, mainly because refresh timing, how therapy revenue is treated, and what gets counted in each estimate are not aligned across studies. Differences also show up when one estimate leans more on list prices while another tries to reflect net pricing after rebates and country reimbursement controls.
In this study, currency conversion timing, annual therapy cost logic, and the final checks against treated patient counts are refreshed up to the latest available period, which is why the current-year total in Mordor Intelligence can land above or below other published values even before forecasting assumptions are compared.
Benchmark comparison
| Source | Market Size | Gaps in Research Methodology |
|---|---|---|
| Mordor Intelligence | USD 3.69 B (2026) | |
| Industry Publisher A | USD 3.47 B (2025) | Uses a different base year and can reflect a broader pharmacy-channel framing, which may treat cross-channel dispensing and price points differently versus a therapy-revenue view. |
| Industry Publisher B | USD 3.60 B (2025) | Applies a longer historical window and mixed segment structure, and may rely on higher-level price progression that is less sensitive to near-term net pricing and country reimbursement step-downs. |
The spread across the three numbers is mainly explained by timing and pricing mechanics rather than disagreement on underlying disease burden. When the demand pool is tied to treated patients, duration, and a clearly stated annual therapy cost per market, the result becomes easier to trace and update as new approvals and pricing shifts are incorporated.
Key Questions Answered in the Report
What is the current size of the Myelodysplastic syndrome treatment market?
The market stood at USD 3.69 billion in 2026 and is projected to reach USD 5.59 billion by 2031.
Which treatment class is growing fastest?
Targeted therapy is expanding at a 11.72% CAGR, driven by telomerase inhibition and novel combination regimens.
Which region is expected to post the highest growth?
Asia Pacific is forecast to rise at a 10.21% CAGR thanks to healthcare modernization and broadened access to advanced drugs.
Why are homecare channels gaining traction?
Oral hypomethylating agents such as INQOVI allow outpatient administration, and updated Medicare reimbursement supports home-based care.
What are the main barriers to market growth?
Cytopenia-related toxicities that limit adherence and high therapy costs that challenge public payor cost-effectiveness thresholds.
How concentrated is the competitive landscape?
The top five companies control roughly 60% of revenues, reflecting moderate concentration with room for biotech disruptors.