
Market Overview
| Study Period | 2020 - 2031 |
|---|---|
| Forecast Data Period | 2026 - 2031 |
| Historical Data Period | 2020 - 2024 |
| Market Size (2026) | USD 1.28 Billion |
| Market Size (2031) | USD 1.44 Billion |
| Growth Rate (2026 - 2031) | 2.38 % |
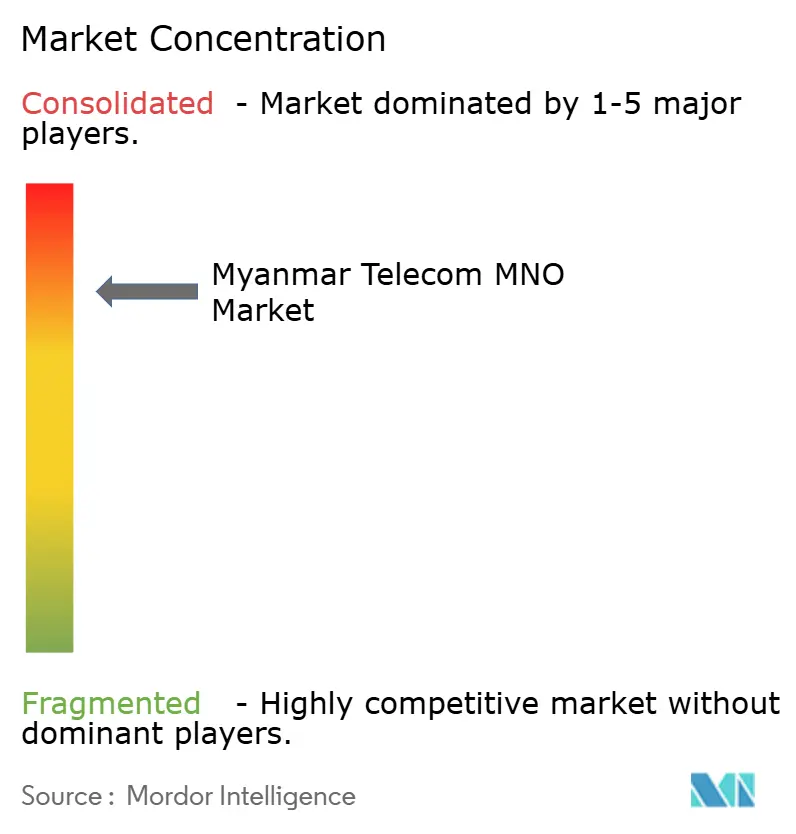
| Market Concentration | High |
Major Players *Disclaimer: Major Players sorted in no particular order Image © Mordor Intelligence. Reuse requires attribution under CC BY 4.0. | |
Myanmar Telecom MNO Market Analysis by Mordor Intelligence
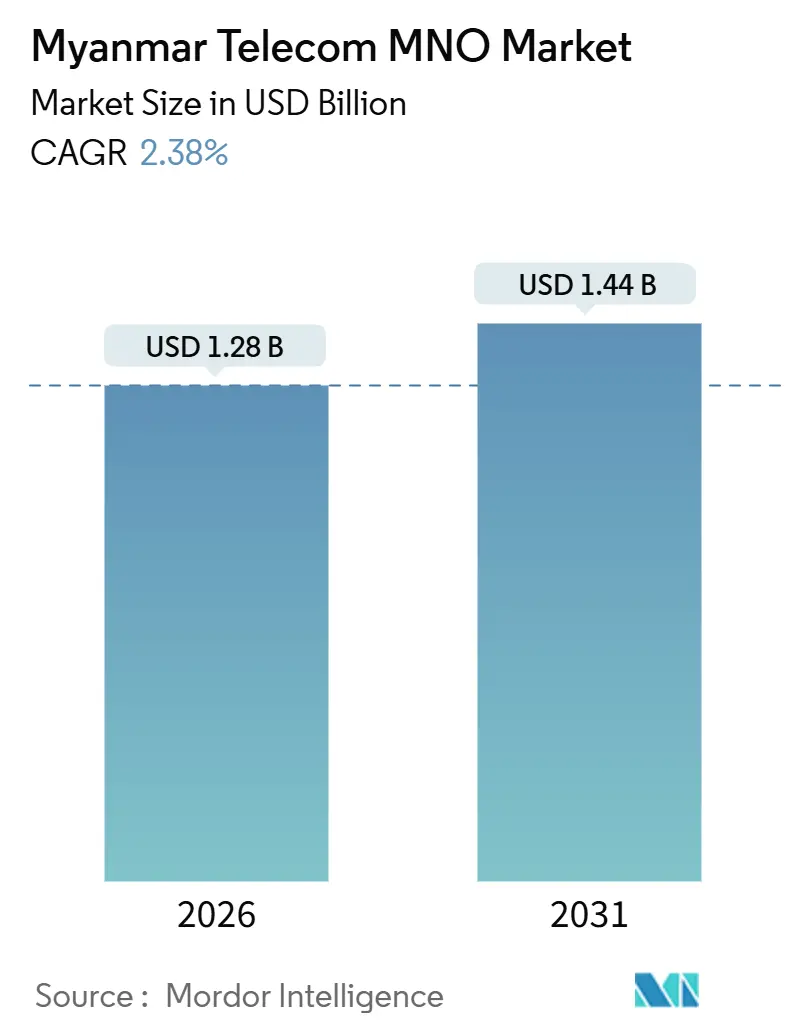
The Myanmar Telecom MNO Market size is estimated at USD 1.28 billion in 2026, and is expected to reach USD 1.44 billion by 2031, at a CAGR of 2.38% during the forecast period (2026-2031). In terms of subscriber volume, the market is expected to grow from 63.81 million subscribers in 2026 to 71.04 million subscribers by 2031, at a CAGR of 2.17% during the forecast period (2026-2031).
Continued migration to data-first usage, a prepaid-heavy subscriber base, and wallet-driven micro-transactions sustain modest top-line growth even as political shocks curb subscriber additions. Operators defend margins by localizing supply chains, accelerating tower-sharing, and pacing 4G-Advanced and selective 5G upgrades in high-traffic corridors. Currency depreciation and triple-digit diesel inflation inflate opex, yet disciplined cost controls, solar-hybrid pilots, and renegotiated tower contracts stabilize cash flow. Vendor realignment toward Chinese equipment, coupled with satellite backhaul tests, underscores the tactical agility required to operate profitably in the Myanmar Telecom MNO market.
Key Report Takeaways
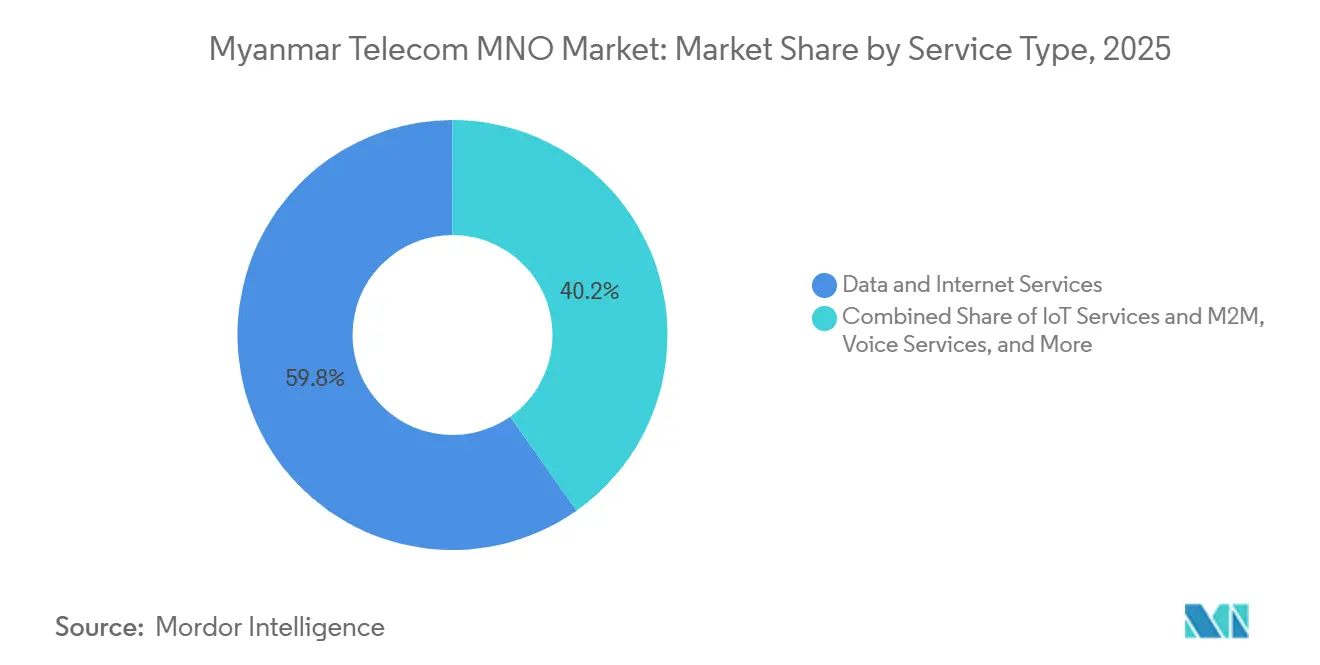
- By service type, Data and Internet Services contributed 59.78% revenue in 2025, while IoT and M2M Services are forecast to post a 4.32% CAGR through 2031.
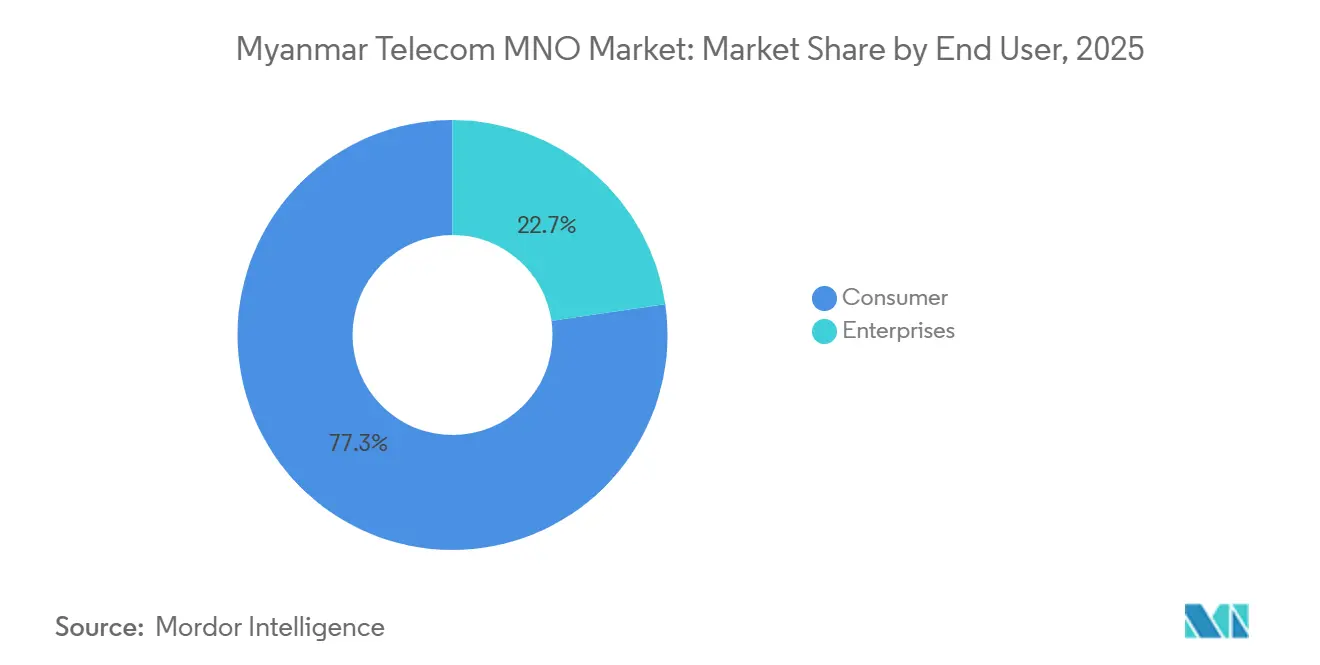
- By end-user, the Consumer segment held 77.28% revenue share in 2025, whereas the Enterprises segment is projected to expand at a 2.83% CAGR through 2031.
Note: Market size and forecast figures in this report are generated using Mordor Intelligence’s proprietary estimation framework, updated with the latest available data and insights as of January 2026.
Myanmar Telecom MNO Market Trends and Insights
Drivers Impact Analysis*
| Driver | (~) % Impact on CAGR Forecast | Geographic Relevance | Impact Timeline |
|---|---|---|---|
| Shifting Usage from Voice-Centric to Data-Centric Services | +0.8% | Yangon, Mandalay, Naypyidaw urban corridors | Medium term (2-4 years) |
| Enterprise Digitization and Cloud Adoption Creating New B2B Demand | +0.6% | Yangon commercial hub, special economic zones | Medium term (2-4 years) |
| Government Mandate for Nationwide FTTH Backbone Build-Out | +0.5% | State capitals and tier-2 cities | Long term (≥ 4 years) |
| Growth of Mobile Money and Super-Apps Boosting ARPU | +0.7% | National, with rapid rural penetration | Short term (≤ 2 years) |
| Rise of Video-Led OTT Consumption in Rural Areas | +0.4% | Rural and peri-urban clusters with improving 4G coverage | Medium term (2-4 years) |
| Satellite-Backhaul Partnerships Enabling Remote Coverage | +0.3% | Conflict-affected regions and border areas | Long term (≥ 4 years) |
| Source: Mordor Intelligence | |||
Shifting Usage From Voice-Centric To Data-Centric Services
Data traffic now dominates revenue streams as smartphone penetration exceeds 80% of the population. Affordable prepaid data, MMK 2,081 (USD 0.48) per GB, widens adoption and revives ARPU after years of voice attrition. Operators front-load 4G-Advanced rollouts and stage 5G trials, with MPT’s June 2024 pilot hitting 1 Gbps peak speeds, to lock in early adopters. OTT messengers like Telegram and Viber substitute legacy SMS, firmly embedding a data-only mindset across the Myanmar Telecom MNO market. SIM re-registration, though compliance-heavy, links digital IDs to wallets and e-commerce, deepening data monetization.
Enterprise Digitization And Cloud Adoption Creating New B2B Demand
Corporate connectivity demand rises as firms comply with the January 2025 Cybersecurity Law and the Digital Economy Roadmap 2030. [1]Mobile World Live, “Myanmar telecom operators brace for sanctions fallout,” mobileworldlive.com Businesses shift workloads to cloud platforms, prompting operators to bundle FTTH, dedicated internet, and managed security into unified bills. MPT’s copper-to-fiber migration across seven regions in June 2025 anchors this thrust, while ATOM’s alliance with Myanmar Airways International showcases vertical-specific mobility solutions. Despite a 16% FDI drop in 2024, tenants in the Thilawa Special Economic Zone still demand carrier-grade links, ensuring B2B upsell momentum within the Myanmar Telecom MNO market.
Government Mandate For Nationwide FTTH Backbone Build-Out
The e-Governance Master Plan 2030 funds an expansive fiber backbone to lift fixed-broadband household penetration beyond 8.1%. MPT leads rollouts, positioning itself as the convergence champion across mobile and fixed offerings in the Myanmar Telecom MNO market. The phased plan, foundation (2024-2026), scaling (2027-2029), integration (post-2030), creates multiyear capex visibility for contractors. Political risk and sanctions slow timelines, yet parallel microwave hops and satellite backhaul protect service continuity during fiber delays. Once complete, the backbone will raise international bandwidth per user and enable richer OTT content experiences.
Growth Of Mobile Money And Super-Apps Boosting ARPU
Digital wallets reshape monetization levers. KBZPay logged 2.1 billion transactions in 2024, while Wave Money’s 61,000 agents deliver 90% geographic coverage.[2]KBZ Bank, “KBZPay Transactions and User Data,” Kbzbank.com Mytel’s MyID super-app bundles self-care, wallet, and streaming, registering 23.4 million installs by 2025. These ecosystems lengthen screen time, enable micro-fees, and stimulate data add-ons, lifting blended ARPU across the Myanmar Telecom MNO market. Fraud spikes, 31 device-change incidents in December 2024, push stricter KYC, raising compliance spend but bolstering trust.
Restraints Impact Analysis*
| Restraint | (~) % Impact on CAGR Forecast | Geographic Relevance | Impact Timeline |
|---|---|---|---|
| Political Instability and Sanctions Crimping Capex Flows | -1.2% | National, highest on military-linked operators | Short term (≤ 2 years) |
| Currency Depreciation Inflating Network Opex | -0.9% | National, given import dependence | Short term (≤ 2 years) |
| Chronic Power Outages Increasing Tower TCO | -0.6% | Urban hubs and off-grid rural sites | Medium term (2-4 years) |
| Social-Media Shutdown Risks Suppressing Data Traffic | -0.4% | Nationwide, with VPN spillovers | Short term (≤ 2 years) |
| Source: Mordor Intelligence | |||
Political Instability And Sanctions Crimping Capex Flows
U.S. Entity List restrictions on Mytel and earlier penalties on the Transport and Communications Ministry sever access to Western vendors and funding.[3]Myanmar Ministry of Planning and Finance, “Myanmar Digital Economy Roadmap 2030,” Mopfi.gov.mm Foreign direct investment fell 16% to USD 1.8 billion in 2024, forcing operators to defer expansion and prioritize maintenance. Rebel attacks destroyed 305 towers between 2021 and 2023, inflating insurance costs and deterring greenfield builds. The exits of Telenor and Ooredoo highlight reputational risk, leaving the Myanmar Telecom MNO market reliant on Chinese vendor financing, limited 5G trials, and aggressive tower-sharing to stretch capital.
Currency Depreciation Inflating Network Opex
The kyat slid to MMK 4,300 per USD in 2024 and inflation hit 34.1% by April 2025, raising equipment, diesel, and bandwidth costs.[4]Myanmar Ministry of Planning and Finance, “Myanmar Digital Economy Roadmap 2030,” Mopfi.gov.mm Over 23,000 towers still burn diesel, while fewer than 1,300 use solar-hybrid kits, exposing opex to fuel volatility. Operators renegotiate tower contracts toward fixed-fee models and preload USD hedges, but cash diversion slows network upgrades. Prepaid structures and local procurement cushion shocks, yet chronic currency pressure remains a structural drag on the Myanmar Telecom MNO market.
*Our forecasts treat driver/restraint impacts as directional, not additive. The impact forecasts reflect baseline growth, mix effects, and variable interactions.
Segment Analysis
By Service Type: Data Momentum Outpaces Legacy Voice
Data and Internet Services delivered 59.78% revenue in 2025 and remain the backbone of the Myanmar Telecom MNO market. Voice and SMS share keeps shrinking as OTT messengers dominate communications. IoT and M2M Services, though nascent, lead growth at a 4.32% CAGR, helped by logistics trackers and smart-agriculture pilots that leverage existing 4G coverage. Operators cross-bundle data with FTTH and wallet perks to extend average revenue per account and reduce churn. The Myanmar Telecom MNO market size for IoT is still modest, yet its trajectory indicates a strategic avenue for diversification.
OTT and PayTV Services languish because of intermittent platform bans and limited local catalogues, but rising smartphone watch-time in peri-urban zones signals future demand once regulatory clarity emerges. Operators evaluate dynamic spectrum sharing to introduce 5G fixed-wireless access, which could broaden the Myanmar Telecom MNO market size by reaching homes beyond fiber footprints. As legacy messaging nears sunset, refarmed spectrum will bolster capacity for streaming-heavy traffic surges.


By End-User: Consumers Lead, Enterprises Accelerate
Consumers generated 77.28% revenue in 2025, driven by inexpensive prepaid data packs and wallet-powered micro-payments. Super-apps fortify ecosystem stickiness and lift ARPU despite intense price rivalry. Rural 4G coverage at 91% of population extends the base, while satellite backhaul pilots aim to close last-mile gaps. The Myanmar Telecom MNO market share among consumers, therefore, remains dominant but increasingly tied to app engagement rather than raw SIM counts.
Enterprise accounts, though only 22.72% of revenue, grow faster at a 2.83% CAGR. Firms embrace managed security, SD-WAN, and dedicated cloud links to satisfy cybersecurity audits and ensure business continuity amid power cuts. ATOM’s ISO 14001:2015 certification and MPT’s fiber rings around industrial parks showcase moves to win higher-margin B2B contracts. Over time, enterprise ARPU is projected to outpace consumer ARPU, helping shift the Myanmar Telecom MNO industry toward a balanced revenue mix.
Geography Analysis
Myanmar is a single-country market, yet regional contrasts dictate operator tactics. Urban trilaterals, Yangon, Mandalay, Naypyidaw, hold the highest wallet share, dense data usage, and most enterprise contracts. MPT’s seven-region fiber retrofit, finished June 2025, entrenches its grip on these hubs, while ATOM’s 5G trials there signal intent to compete on speed. Small-cell densification and indoor DAS projects are now prioritized to ease congestion and sustain superior user experience across the Myanmar Telecom MNO market.
Second-tier cities such as Pathein, Mawlamyine, and Taunggyi are next in line for fiber-to-the-home expansion. Government incentives, spectrum roadmap teasers, and tower-sharing deals lower entry barriers, allowing operators to test converged mobile-plus-fixed packs at modest capex. Rural and peri-urban zones, though low-ARPU, supply incremental volume thanks to 4G-enabled feature-phones and wallet agents. Wave Money’s 90% agent coverage illustrates how financial inclusion can amplify data uptake outside metros.
Conflict-affected border states, like Shan, Kachin, and Rakhine, struggle with tower attacks, prolonged maintenance cycles, and roaming blackouts. Operators rely on microwave rings, VSAT links, and pilot satellite backhaul for minimal viable coverage. Starlink’s brief 14% user share surge in mid-2025 underscores suppressed demand for stable broadband, though subsequent raids paused momentum. Long-term, a mix of hybrid power, solar-diesel gensets, and secure fiber corridors will determine how evenly the Myanmar Telecom MNO market grows across regions.
Regulatory Landscape
Myanmar telecom operations are overseen by the Ministry of Transport and Communications (MOTC) through the Posts and Telecommunications Department (PTD). Compliance enforcement centers on licensing obligations, reporting, and fee payments. In July 2025, PTD issued notices to telecom licensees on mandatory reporting and fee-payment requirements, warning of potential license revocation for non-compliance and tightening operational and governance expectations for MNOs and distribution partners.
Device and fraud-control measures tightened in 2026 with the Central Equipment Identity Register (CEIR) activation in March 2026 under the CEIR and EIR System Project Steering Committee. The update expanded mandatory device registration requirements, including for international travelers (passport and flight data) by July 2026. In parallel, the 2026 Anti-Online Scam Bill requires telecom operators and ISPs to connect via API to a centralized monitoring center for real-time tracking of SIM cards and related financial transactions. This increases integration and KYC burdens while reinforcing formalization of SIM and wallet-linked usage.
Competitive Landscape
The Myanmar Telecom MNO market exhibits moderate concentration. MPT leads with 29.6 million subscribers, integrating nationwide FTTH into its mobile proposition. Mytel fields 13 million users and maintains extensive 4G reach, but U.S. sanctions hinder vendor diversity and financing. ATOM’s 18 million-strong base underpins its agile challenger positioning, anchored by digital-first branding, ISO certifications, and embedded-finance ventures.
Price competition remains tight, yet network-quality gaps widen as MPT and ATOM accelerate 5G readiness. Mytel pioneered a 3.5 GHz demo in 2019 but now faces funding bottlenecks. Rising co-location ratios on over 23,000 shared towers temper capex and extend rural coverage. Over-the-top ecosystems continue to cannibalize legacy revenue, pushing all operators toward data-bundled super-apps and enterprise cloud gateways.
Strategic alliances shape battlefield edges. ATOM embeds micro-insurance with KBZ Microfinance Services, while MPT partners with local ISPs to deepen FTTH penetration in multi-dwelling units. Mytel leverages Chinese vendor supply chains for cost advantage but risks geopolitical backlash. Compliance disciplines such as SIM re-registration and environmental certifications erect new moats and systemize customer trust across the Myanmar Telecom MNO market.
Myanmar Telecom MNO Industry Leaders
MPT Myanmar
ATOM Myanmar
Mytel
- *Disclaimer: Major Players sorted in no particular order

Market Opportunities and Future Outlook
Measured network modernization activity and digital-channel adoption are creating whitespace for monetization beyond basic connectivity, especially where operators can bundle data with self-care and adjacent services. In 2026, MPTs field actions, including launching 27 new mobile base stations and upgrading 9 sites to 4G LTE across eight regions and states, support opportunities around service-quality differentiation, traffic offload, and localized capacity buildouts in underserved corridors without relying only on greenfield coverage expansion.
As compliance and fraud controls tighten through CEIR activation (March 2026) and requirements under the 2026 Anti-Online Scam Bill, the most actionable opportunities cluster around trusted digital onboarding and device compliance flows, along with wallet-linked engagement that can be embedded into operator apps and retail processes. ATOMs May 2026 release of ATOM Store App 2.0 and its March 2026 partnership with uab bank to offer in-app digital insurance (uab Thaw Ka Kinn Way TelcoCare) show near-term pathways for MNOs to strengthen app stickiness and diversify revenue through embedded finance and protection products, while aligning customer journeys with stricter identity and device-registration norms.
Recent Industry Developments
- July 2026: Completed migration from copper network to high-speed fiber in the Bago (East) Region. The fiber upgrade improves nationwide fixed and mobile service quality. Infrastructure modernization strengthens network stability and competitive position in the Myanmar telecom market.
- June 2026: MPT Myanmar launched A Kyite Kyi data packs with flexible social media access. The data packs expand data ARPU through broader social media access. They enhance data-driven value propositions and support customer retention across MPT's network.
- June 2026: ATOM Myanmar co-sponsorship of the 2026-27 Myanmar National League season. The sponsorship is tied to national brand visibility. It shifts consumer engagement and sponsorship leverage to strengthen market presence.


Research Methodology Framework and Report Scope
Market Definition and Coverage
For this report, the market is defined as the revenues generated from telecom operator services delivered in Myanmar. Demand is captured across consumer and enterprise users through mobile connectivity and related operator-led offerings.
Scope exclusions: We exclude non-operator device sales and most non-connectivity digital platform revenues that are not billed as telecom service revenue.
Segmentation Overview
- Overall Telecom Revenue and ARPU
- Service Type
- Voice Services
- Data and Internet Services
- Messaging Services
- IoT and M2M Services
- OTT and PayTV Services
- Other Services (VAS, Roaming and International Services, Enterprise and Wholesale Services, etc.)
- End-User
- Enterprises
- Consumer
Data Sources, Market Sizing, and Validation
Desk Research
Desk research was used to set the factual base of the model, especially for subscriber trends, coverage rollout timing, and macro signals that shape affordability and usage. We referenced public and official source types, including ITU indicators, World Bank macro series, GSMA statistics, and government or regulator releases where available, then complemented these with operator announcements and reputable press coverage.
To translate activity into revenue, we also reviewed operator disclosures and investor-style materials that discuss ARPU direction, data consumption, and pricing actions, and tied those inputs back to national demand signals. We used selected paid subscriptions mainly for company financials and for intelligence and news, so that historical revenue direction could be cross-checked consistently across years. This list is illustrative, and other public sources were also used for data collection, validation, and clarification.
Primary Interviews and Surveys
In Myanmar, we use expert interviews and surveys with CXOs, functional and unit leaders, and managers from operators, distributors, and enterprise users. Their feedback helps clarify reported subscriber trends, ARPU assumptions, changes in voice and data usage, and demand for operator-billed services. Conflicting responses trigger follow-up checks before the model is finalized.
Distribution of primary research fieldwork respondents
| Company type | Respondent position |
|---|---|
| Top tier: 28% | CXOs: 12% |
| Mid tier: 47% | Functional/Unit leaders: 33% |
| Smaller Players: 25% | Managers: 55% |
Market-Sizing & Forecasting
Sizing started from a top-down build where telecom service revenue is reconstructed through subscriber volumes and usage-led monetization signals, and then filtered by observed tariff and package structures in Myanmar. After shaping the demand pool, selective bottom-up checks were run using sampled operator and channel inputs, including implied ARPU ranges, active subscriber mix, and plan-level price points. This helped adjust totals when the first cut looked too high or too low.
Key inputs used as model drivers included mobile subscriber counts, the active versus total SIM mix, 4G population coverage progress, smartphone adoption direction, ARPU movement, and the impact timing of taxes or policy actions that change recharge behavior. For forecasting, we applied scenario analysis and then anchored it to expert views on how pricing, data usage, and network investment are likely to evolve, since shocks in Myanmar can shift outcomes more than a smooth trend line suggests. Where bottom-up inputs were missing for smaller providers or rural coverage footprints, gaps were filled using conservative proxy ratios from comparable service footprints, followed by a review against overall national penetration and affordability signals.
Data Validation & Update Cycle
Outputs were checked through triangulation across independent indicators, and unusual jumps were flagged for a second-pass review before figures were finalized. We also ran variance checks across implied ARPU, subscriber growth, and revenue per connection so the model stayed consistent with how telecom services monetize in Myanmar.
The report is refreshed annually, and interim updates are triggered when material events occur, including major policy changes, pricing resets, or shifts in operator ownership and investment plans. Before delivery, analysts complete a fresh review pass so the published numbers reflect the latest available signals.
Mordor Intelligence's Myanmar Telecom Market Estimate Compared With Other Published Estimates
Published market values for Myanmar telecom often differ, and the gaps usually come from what each source counts as telecom revenue, the year used for currency conversion, and how strongly each source assumes pricing recovery in the forecast years.
Some external figures appear to report a broader telecom total that folds in adjacent ICT or digital service lines, and this is then carried forward with a single growth assumption. In Mordor Intelligence, the market is kept to the Myanmar Telecom MNO value, and totals are tied back to subscriber volume and monetization checks, including the 63.81 million subscriber estimate shown for 2026, so non-operator revenues are not blended into the same pool.
Benchmark comparison
| Source | Market Size | Gaps in Research Methodology |
|---|---|---|
| Mordor Intelligence | USD 1.28 B (2026) | |
| Regional Consultancy A | USD 1.90 B (2024) | Uses an earlier base year and a wider telecom definition that can include fixed broadband, tower, or ICT-adjacent revenue lines, and the conversion timing can inflate the USD view during FX swings. |
| Trade Journal B | USD 2.30 B (2030) | Publishes a forward value with limited visibility on subscriber activity and ARPU logic, and the forecast tends to extend a single growth rate without re-checking tax, pricing, and demand shocks. |
The spread in the table is mainly explained by scope and the mechanics used to translate usage into billable revenue, followed by different base years and FX timing. By keeping the model traceable to subscriber and ARPU style signals and then rechecking totals against practical market constraints, we end up with a market size that buyers can reconcile and reuse in planning.


Key Questions Answered in the Report
How large is the Myanmar Telecom MNO market in 2026?
The Myanmar Telecom MNO market size is USD 1.28 billion in 2026, projected to reach USD 1.44 billion by 2031.
What drives growth in Myanmar’s mobile networks?
A decisive shift to data-centric usage, fueled by >80% smartphone penetration and low-cost prepaid data, is the core growth driver.
Which service segment is expanding fastest?
IoT and M2M Services lead with a 4.32% CAGR through 2031, propelled by logistics and smart-agriculture deployments.
How do sanctions affect local operators?
Sanctions restrict Western vendor access and financing, forcing reliance on Chinese equipment and delaying large-scale 5G rollouts.
Why are power outages significant for telecom costs?
Blackouts of up to 20 hours daily increase diesel use for over 23,000 towers, pushing total cost of ownership higher.
What role do mobile-money super-apps play in revenue?
Wallet platforms like KBZPay, Wave Money, and MyID generate micro-fees and data upsell opportunities, boosting ARPU despite price pressure.
Page last updated on:


 Your data is secure and never sold or shared.


