
Market Overview
| Study Period | 2018 - 2031 |
|---|---|
| Forecast Data Period | 2026 - 2031 |
| Base Year Market Size (2025) | USD 6.15 Billion |
| Market Size (2026) | USD 6.35 Billion |
| Market Size (2031) | USD 7.43 Billion |
| Growth Rate (2026 - 2031) | 3.21 % |
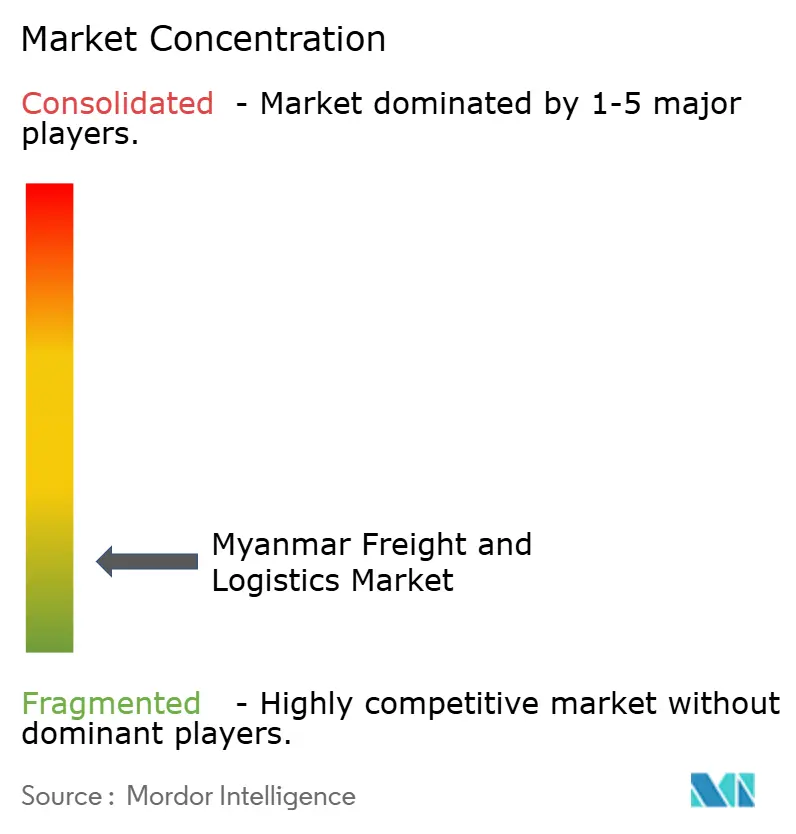
| Market Concentration | Low |
Major Players *Disclaimer: Major Players sorted in no particular order Image © Mordor Intelligence. Reuse requires attribution under CC BY 4.0. | |
Myanmar Freight And Logistics Market Analysis by Mordor Intelligence
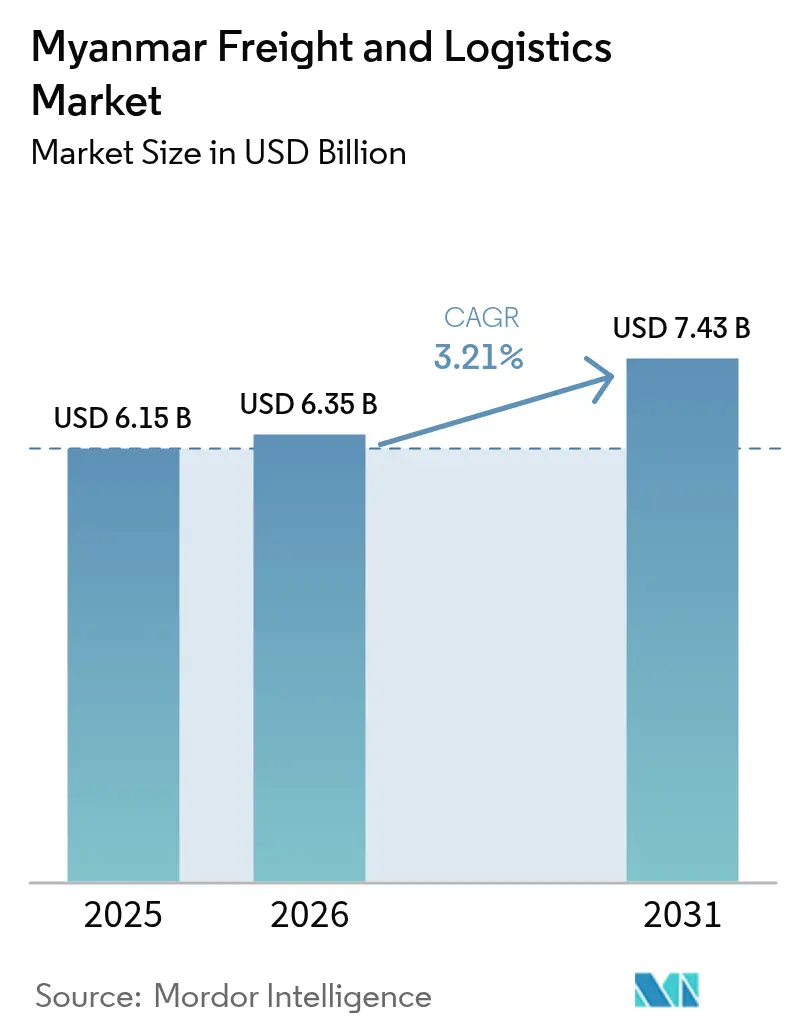
The Myanmar freight and logistics market size is expected to grow from USD 6.15 billion in 2025 to USD 6.35 billion in 2026 and is forecast to reach USD 7.43 billion by 2031 at 3.21% CAGR over 2026-2031. A measured growth curve reflects Myanmar’s role as the principal overland bridge between China’s Yunnan Province and the Indian Ocean, positioning the Myanmar freight and logistics market as a linchpin within the China-Myanmar Economic Corridor. USD 5.6 billion worth of Chinese‐backed projects were announced in 2024, most notably the Kyaukphyu deep-sea port valued at USD 7.3 billion, signal continued momentum in multimodal infrastructure that directly expands line-haul capacity. Manufacturing relocation is another catalyst: Southeast Asia captured USD 89 billion in manufacturing FDI in 2024, up 42% from 2023, and Myanmar is drawing a growing share through “China + 1” strategies, which amplify volumes across road, maritime, and air freight. Freight transport held 60.74% of 2024 revenue, while Courier, Express and Parcel (CEP) services are projected to grow the fastest at a 4.82% CAGR between 2025-2030 as 5.9 million e-commerce users generate USD 3.80 billion in gross merchandise value. Political instability, foreign-exchange controls, and fragmented last-mile networks temper the near-term outlook, but ongoing Special Economic Zone (SEZ) expansion, the National Single Window customs platform and cross-border digitization initiatives continue to unlock new lanes for the Myanmar freight and logistics market[1]“World Investment Report 2024,” United Nations Conference on Trade and Development, unctad.org.
Key Report Takeaways
- By logistics function, freight transport led with 60.15% of the Myanmar freight and logistics market share in 2025, while courier, express, and parcel (CEP) services are projected to expand at a 4.69% CAGR between 2026-2031.
- By CEP service type, domestic CEP retained 66.58% revenue share in 2025, whereas international CEP services are forecast to grow at a 4.88% CAGR between 2026-2031.
- By freight forwarding, sea and inland waterways accounted for 79.02% revenue share in 2025, while air freight forwarding is poised to register a 3.67% CAGR between 2026-2031.
- By freight transport, road freight transport captured 71.12% of the segment revenue share in 2025, yet air freight transport is expected to post the fastest 4.12% CAGR between 2026-2031.
- By warehousing and storage type, non-temperature-controlled facilities held a 91.28% revenue share in 2025, while temperature-controlled capacity is expected to grow at a 3.07% CAGR between 2026-2031.
- By end user industry, wholesale and retail trade contributed 33.12% of the Myanmar freight and logistics market size in 2025, whereas manufacturing is projected to advance at a 3.42% CAGR between 2026-2031.
Note: Market size and forecast figures in this report are generated using Mordor Intelligence’s proprietary estimation framework, updated with the latest available data and insights as of 2026.
Myanmar Freight And Logistics Market Trends and Insights
Drivers Impact Analysis*
| Driver | (~) % Impact on CAGR Forecast | Geographic Relevance | Impact Timeline |
|---|---|---|---|
| Regional manufacturing relocation to Myanmar drives market growth | +0.8% | Yangon and Mandalay corridors | Medium term (2-4 years) |
| Myanmar’s logistics infrastructure and connectivity expanding rapidly | +1.2% | National; CMEC spine | Long term (≥ 4 years) |
| Government-backed special economic zones (SEZs) fuel investment and development | +0.6% | Thilawa, Kyaukphyu, Dawei | Medium term (2-4 years) |
| Cross-border trade surges along the China–Myanmar economic corridor | +0.9% | Northern border to western ports | Long term (≥ 4 years) |
| Rising agri-perishable exports spur demand for cold-chain logistics | +0.4% | Ayeyarwady, Bago, Sagaing | Medium term (2-4 years) |
| Increasing adoption of digital freight platforms among Myanmar’s SME truckers | +0.3% | Urban nodes to rural routes | Short term (≤ 2 years) |
| Source: Mordor Intelligence | |||
Regional Manufacturing Relocation to Myanmar Drives Market Growth
Rising labor costs in coastal China and geopolitical trade friction are pushing global manufacturers deeper into Southeast Asia. The 42% jump in regional manufacturing FDI during 2024 translates into sturdier cargo pipelines for the Myanmar freight and logistics market as relocated plants ship machinery inbound and finished goods outbound. Freight forwarders are witnessing heavier demand for temperature-controlled storage to protect electronics components and apparel that transit Yangon and Mandalay. Yet limited expressway mileage and policy unpredictability constrain capacity additions, steering most new factories toward established clusters where road connectivity and customs processing are more reliable[2]“Myanmar’s Enduring Polycrisis,” United Nations Development Programme, undp.org.
Myanmar’s Logistics Infrastructure and Connectivity Expanding Rapidly
Flagship corridor projects have entered the execution stage, most critically the Kyaukphyu deep-sea port, designed for 8,000 TEU vessels and 16-meter draft, and the 1,700 km Kyaukphyu–Kunming rail alignment. Road freight transport currently carries 71.64% of revenue share in 2024, but rail’s share is set to rise once the Muse–Mandalay and Kyaukphyu railways connect inland nodes with ports. The partially completed India-Myanmar-Thailand trilateral highway has reached 70% completion, expanding ASEAN–South Asia trucking corridors and lowering door-to-door transit times.
Government-Backed Special Economic Zones (SEZs) Fuel Investment and Development
The SEZ Law of 2014 provides income-tax holidays and streamlined licensing; Thilawa leads with operational factories, Dawei is finalizing Thai-linked road and port blueprints, and Kyaukphyu is moving ahead under a China-financed framework[3]“Special Economic Zone,” Myanmar Directorate of Investment and Company Administration, dica.gov.mm. Concentrated industrial estates shorten drayage legs, reduce customs touchpoints, and create dedicated warehousing parks, bolstering the Myanmar freight and logistics market by enabling integrated multimodal hubs. Consistent enforcement, however, remains critical to ensure foreign operators obtain timely land leases and bonded-warehouse status.
Cross-Border Trade Surges Along the China–Myanmar Economic Corridor
The USD 5.6 billion in new Chinese investments announced in 2024 reinforced confidence in the CMEC as Beijing’s preferred alternative to the Malacca sea route. With 79.25% of freight-forwarding revenue tied to maritime moves, deeper draft at Kyaukphyu plus digital customs via the National Single Window are tilting volumes toward containerized sea‐rail solutions. Yet ethnic armed‐group checkpoints in northern Shan and Kachin States force ad-hoc diversions and extended dwell times, compelling forwarders to bundle border brokerage and security assessment into service contracts.
Restraints Impact Analysis*
| Restraint | (~) % Impact on CAGR Forecast | Geographic Relevance | Impact Timeline |
|---|---|---|---|
| Under-developed last-mile delivery integration limits service efficiency | -0.4% | Yangon, Mandalay; rural hinterlands | Short term (≤ 2 years) |
| Political instability and regulatory uncertainty create market challenges | -0.7% | Nationwide borders and ports | Short term (≤ 2 years) |
| Limited access to trade finance restricts SME exporters’ growth | -0.3% | Border town clusters | Medium term (2-4 years) |
| Monsoon-season disruptions expose weaknesses in climate-resilient infrastructure | -0.2% | Coastal and delta networks | Short term (≤ 2 years) |
| Source: Mordor Intelligence | |||
Under-Developed Last-Mile Delivery Integration Limits Service Efficiency
Rising e-commerce orders outstrip parcel sortation capacity; only 45% of domestic businesses have adopted digital workflows, and fewer than 20% of rural townships possess paved road links year-round. Cash-heavy settlement preferences inflate failed-delivery ratios, and major global marketplaces continue to postpone direct market entry. Parcel carriers, therefore, bundle mobile-wallet collection and community pickup points to manage driver contact hours and fuel spend.
Political Instability and Regulatory Uncertainty Create Market Challenges
A 96% drop in approved foreign investment between 2020 and July 2024 underlines capital flight risks. Mandatory 24-hour FX conversion erodes dollar margins, while shortened import-license validity snarls port operations, exemplified by roughly 400 containers of soybean meal stranded at Yangon terminals in 2024[4]“Burma Restrictions on Export Earnings,” U.S. Department of Agriculture, usda.gov. Combined with 25.4% inflation, these variables compress discretionary logistics spending and defer fleet renewal plans.
*Our forecasts treat driver/restraint impacts as directional, not additive. The impact forecasts reflect baseline growth, mix effects, and variable interactions.
Segment Analysis
By End-User Industry: Manufacturing Momentum Accelerates
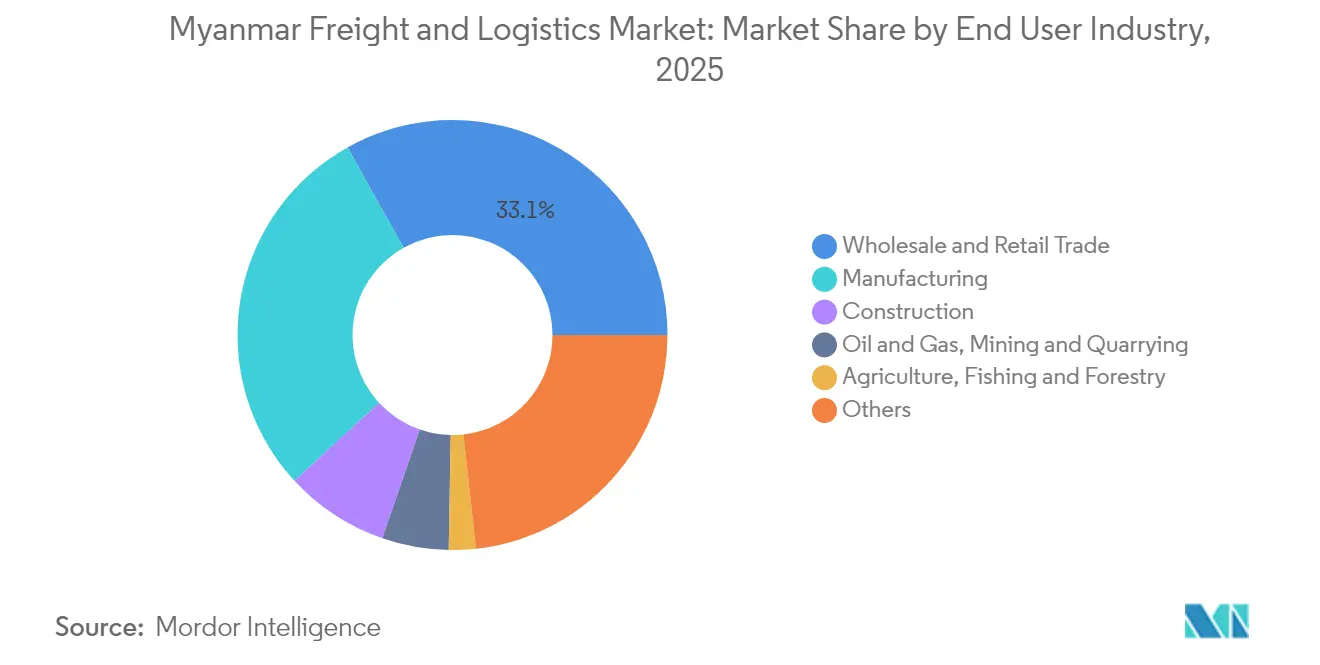
Wholesale and retail trade led the 2025 demand with 33.12% of the Myanmar freight and logistics market share. Manufacturing, however, registers the highest projected trajectory at 3.42% CAGR between 2026-2031 as apparel, consumer electronics, and agro-processing relocate from coastal China.
Construction logistics remain robust thanks to gravel road projects that elevate rural connectivity and cement consumption. Oil and gas pipeline flows account for 5.62% of load moved (ton-km) in 2024, anchoring specialized tank-truck and pipe-haul services between Kyaukphyu and Yunnan.


By Logistics Function: Freight Transport Dominance Drives Growth
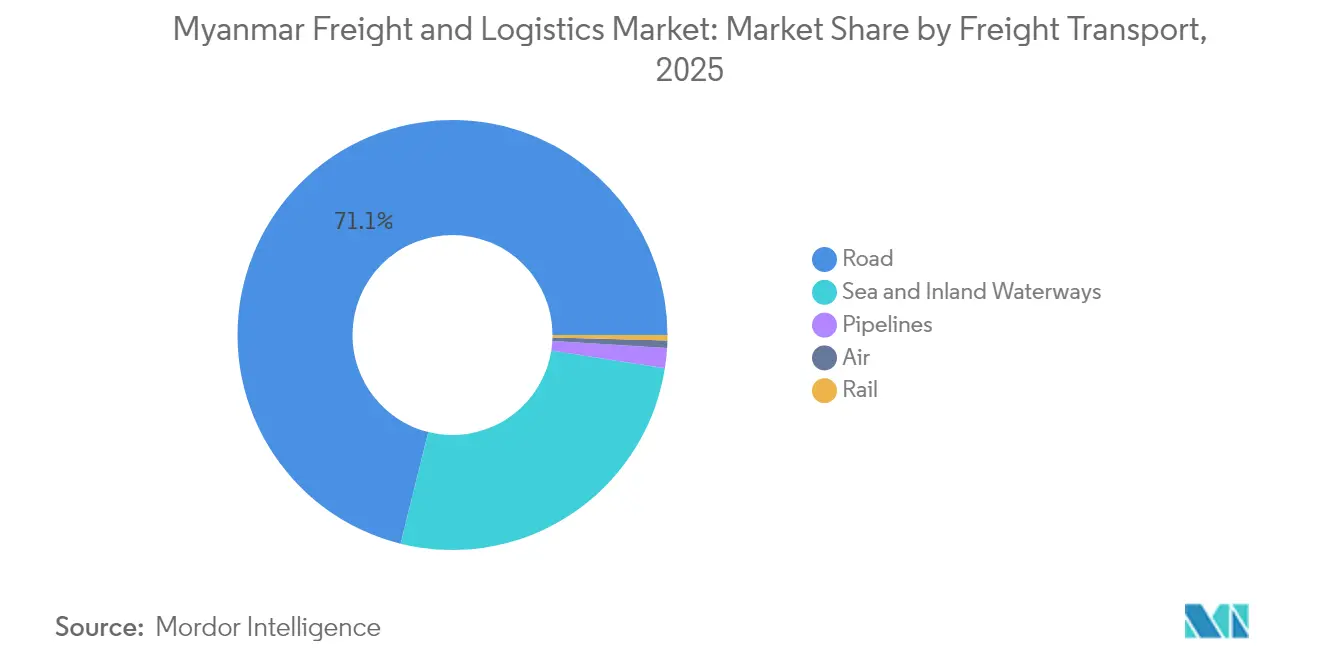
Freight transport accounted for 60.15% of Myanmar's freight and logistics market size in 2025, anchored by road’s 71.12% slice of freight transport revenue. The segment benefits from urbanizing demand centers on the Yangon–Mandalay corridor, yet the Myanmar freight and logistics industry also relies on sea and inland waterways, which cover 49.00% of load moved (ton-km), reflecting cost-efficient bulk flows. Air freight transport holds the least share, but its premium nature lifts revenue intensity and a 4.12% forward CAGR (2026-2031). Investments such as DHL’s automated Asia-Pacific sort hubs are designed to capture higher-margin electronics and pharma consignments.
Courier, Express, and Parcel services are expected to grow at a 4.69% CAGR (2026-2031), outpacing the overall Myanmar freight and logistics market. International CEP fueled by Chinese and Thai consumer demand for Myanmar-made apparel edges slightly faster at 4.88% CAGR (2026-2031) as express lanes open under the ASEAN Customs Transit System. Integration of Wave Money’s mobile-wallet ecosystem into CEP checkout modules shrinks cash handling risk and lowers delivery lead times.
By Courier, Express, and Parcel (CEP): International Growth Accelerates
Domestic CEP still controls 66.58% of 2025 parcel revenue, yet cross-border parcels add network density that raises vehicle utilization rates. The market size for international CEP is set to expand at a projected CAGR of 4.88% from 2026-2031 in tandem with Kunming and Bangkok gateway consolidation projects, providing shippers with two-day delivery into China and four-day coverage into ASEAN capitals.
Temperature-controlled express boxes are rolling out to safeguard value-added seafood exports on 48-hour delivery cycles to Shanghai and Guangzhou. Local incumbents combat underdeveloped last-mile networks through franchise collection points embedded in micro-retail shops, particularly in second-tier towns.
By Warehousing and Storage: Temperature Controlled Facilities Gains Momentum
Non-temperature facilities occupy 91.28% of warehouse floor space, but cold-chain square footage is expected to climb at 3.07% CAGR (2026-2031) as exporters integrate farm-to-port supply chains. SEZ warehouse parks in Thilawa and Kyaukphyu offer base load tenancy for 3PL providers, while Dawei’s design documents allocate a 2,000-ha logistics estate adjacent to the deep-sea terminal.
Automation roll-outs, including RPA for inventory reconciliation, help mitigate a 30% labor shortfall and support 24-hour throughput requirements.
By Freight Transport: Road Infrastructure Drives Modal Share
Under the freight transport segment, road freight transport remained high at 71.12% in 2025 due to limited rail penetration and the necessity of door-to-door services across dispersed rural settlements. Completion of the India-Myanmar-Thailand highway by 2028 is expected to extend all-weather trucking lanes into South Asia, improving back-haul ratios for carriers.
Rail freight’s current revenue share is projected to rise once the Muse-Mandalay corridor comes online, easing axle load pressure on highways and enabling block train services for containerized textiles. Meanwhile, air freight transport is expected to grow at a 4.12% CAGR between 2026-2031, driven by high-value cargo demand and regional connectivity improvements through airport infrastructure development.
By Freight Forwarding: Maritime Focus Dominates Operations
Sea and inland waterways generated 79.02% of 2025 freight-forwarding revenue, illustrating the strategic pull of the Indian Ocean gateway. The Myanmar freight and logistics market size, attributed to air forwarding, though smaller, is forecast to grow at a 3.67% CAGR (2026-2031) as pharmaceuticals and precision electronics proliferate.
Digitized bookings via the National Single Window curtail manual customs entries and are shaving a full day off dwell times for compliant shipments. Intensifying inspections at border gates in Muse and Chinshwehaw complicate inland forwarding and drive demand for multimodal sea-rail solutions that bypass militia-controlled checkpoints.
Geography Analysis
Northern border trade zones handle the bulk of China-oriented overland volumes. Ethnic armed-group checkpoints in Kachin and Shan States raise security costs and impose unpredictable transit delays, pushing shippers to hold larger safety stocks. China strengthened inspection rules at Muse and Chinshwehaw during 2024, which reduced daily truck clearances and shifted some textile and agricultural loads toward maritime routes. Preparatory works on the 1,700 km Kyaukphyu-Kunming rail line signal Beijing’s long-term plan to bypass these chokepoints by moving cargo directly from Yunnan to Myanmar’s west coast. Once operational, the corridor is expected to redistribute freight flows and lift demand for inland warehousing in northern logistics parks.
Central Myanmar remains the domestic freight backbone. The Yangon–Mandalay expressway carries 44.97% of road ton-km, linking the nation’s two largest consumption centers. Road freight dominates here because rail capacity is limited and river navigation is seasonal. Planned upgrades to the Muse–Mandalay railway aim to relieve highway congestion and cut transit time to China by more than six hours. The India–Myanmar–Thailand trilateral highway reached 70% completion in 2025 and will open new east-west trucking lanes that connect Mandalay depots with Bangkok distribution hubs by 2028.
Coastal provinces anchor Myanmar’s maritime strategy. The Port of Yangon handles most containerized imports, but draft limits restrict vessel size and create feeder reliance on Singapore hubs. Kyaukphyu’s USD 7.3 billion deep-sea complex will accept 8,000 TEU ships at 16 m depth, giving exporters a direct Indian Ocean outlet and reducing sailing distance to the Middle East by 30%. Farther south, Dawei SEZ plans include a 138 km highway to Thailand’s Kanchanaburi Province, which positions the site as a gateway for petrochemical and heavy-industry cargo into ASEAN markets. Climate risk remains acute along the coast; Typhoon Yagi in 2024 damaged feeder roads and port cranes, underscoring the need for resilient design standards in future projects.
Regulatory Landscape
Myanmar's freight and logistics regulation is anchored by the Ministry of Transport and Communications (MOTC), which acts as the focal ministry across modes. The Myanma Port Authority (MPA) oversees maritime ports and port-related logistics operations, including requirements such as a Permit to Ply for maritime operations. On the road side, the Road Transport Administration Department (RTAD) sits under MOTC for vehicle and road-transport oversight, while trade procedures and border-related operating rules are administered through the Ministry of Commerce and its trade notifications.
The operating framework also reflects multi-agency modernization and corridor enablement efforts, including the National Logistics Master Plan (2018-2030) and formal rules under the Multimodal Transport Law (2014) governing multimodal operations and supervision. Trade-procedure updates have been evidenced by Ministry of Commerce bulletins that introduced and then refined containerization procedures for the Yangon-Kawthoung-Ranong coastal trade route (Bulletin 1/2024 and Bulletin 5/2025). Road-use charging also changed on April 1, 2026, when electric vehicles were brought under road and bridge toll requirements after an exemption period ended.
Value Chain Analysis
Myanmar's freight and logistics value chain starts with shippers in wholesale and retail trade, manufacturing, and agriculture, and runs through truckers and freight forwarders into ports, SEZ-linked logistics parks, and border gates. The core physical network concentrates around the Yangon and Thilawa maritime gateways (with Yangon widely cited as handling the bulk of international maritime trade), cross-border land corridors to China, Thailand, and India, and inland consolidation around the Yangon-Mandalay spine. Forwarders and integrators coordinate ocean shipping (sea and inland waterways are the dominant forwarding mode by revenue in the report), customs brokerage and documentation (increasingly via digitization protocols), and inland haulage to warehouses and distribution points.
Key enabling nodes include bonded and general warehousing in and around SEZs (notably Thilawa), port operations managed by MPA with private participation through BOT arrangements, and border inspection facilities at chokepoints such as Muse and Tachileik. Fuel-cost exposure for diesel-dependent trucking fleets, infrastructure disruption risks (roads and bridges), and operational uncertainty that can extend dwell times at checkpoints and gates remain recurring friction points. These constraints increase the value of inventory buffers, bonded storage, and multimodal re-routing options that align with long-cycle infrastructure such as Kyaukphyu deep-sea port and rail and corridor upgrades.
Competitive Landscape
Myanmar’s logistics arena remains moderately fragmented, with the five largest providers significant sector revenue. Global integrators such as DHL, Maersk, and DSV use their capital strength to secure space at the Yangon Terminal and long-term drayage contracts in Thilawa SEZ. Local operators retain an edge in off-network regions where informal checkpoints and language barriers complicate long-haul dispatching. Scale dynamics shifted in April 2025 when DSV closed its EUR 14.3 billion (USD 15.78 billion) purchase of DB Schenker, elevating the combined entity to EUR 41.6 billion (USD 45.91 billion) in turnover and nearly 160,000 employees worldwide. The merger is expected to generate DKK 9.0 billion (USD 1.33 billion) in annual synergies by 2028, some of which could fund fleet renewal and cross-border consolidation services into Myanmar.
Technology has become the primary differentiator, as Myanmar’s 45% business-digitalization rate leaves room for automated sortation and real-time track-and-trace rollouts. DHL earmarked EUR 500 million (USD 551.82 million) for Asia-Pacific healthcare logistics, strengthening cold-chain gateways that align with rising pharmaceutical imports into Yangon. YCP’s August 2024 launch of Robot Process Automation platforms addresses a 30% domestic labor shortage by offloading repetitive warehouse tasks. Wave Money’s mobile-wallet integration into delivery networks shortens cash-to-bank cycles and supports proof-of-delivery uploads from remote townships. Maersk’s “No Shipping Instructions, No Load” policy forces exporters to digitize shipping documents ahead of vessel cut-off, tightening compliance across the maritime segment.
Political volatility and spot fuel price swings motivate foreign 3PLs to structure Myanmar operations through minority joint ventures that share risk while preserving service quality. White-space opportunities concentrate in rural cold-chain lanes and border brokerage, where demand growth outpaces asset availability. Competitive intensity is expected to rise as infrastructure projects such as the Kyaukphyu deep-sea port and the India-Myanmar-Thailand highway unlock additional traffic corridors. Overall, players that combine digital visibility, compliance rigor and local partnerships stand to win the market share, signaling room for both multinational and domestic expansion.
Myanmar Freight And Logistics Industry Leaders
A.P. Moller – Maersk (Including Damco)
DHL Group
NYK Line / Yusen Logistics
Kerry Logistics Network Group
CJ Logistics
- *Disclaimer: Major Players sorted in no particular order

Market Opportunities and Future Outlook
White-space is concentrated in industrial-grade warehousing and cold storage near primary gateways where trade and SEZ activity consolidate demand, particularly Thilawa and the Yangon port complex. A near-term signal is Myanma Agricultural & General Development Public Co Ltd (MAGDPL) announcing an investment of over USD 3.7 million for modern storage facilities at Thilawa port, targeting total capacity of 25,000 tonnes. This reinforces demand for scalable storage, cargo handling, and inventory management services tied to maritime flows and SEZ tenant requirements.
Corridor-led opportunities are strongest in multimodal and cross-border orchestration, where Myanmar functions as a land bridge between Yunnan and the Indian Ocean and connects into India-facing routes such as the Kaladan Multi-Modal Transit Transport Project connecting Kolkata-Sittwe via inland waterways and road segments. Service providers that combine port-side operations under BOT-style participation, digitally enabled booking and clearance processes, and resilient inland capacity (including contingency routing around chokepoints) are positioned to capture incremental volumes from CMEC-linked infrastructure activity and regional supply chain diversification already visible in announced project pipelines, including the Kyaukphyu deep-sea port program cited in the report context. Policy and cost signals, including the April 1, 2026 application of road and bridge tolls to electric vehicles, also create a clearer operating baseline for fleets evaluating electrification and route economics in urban and port drayage use cases.
Recent Industry Developments
- June 2026: DHL Group announced an expansion of its data center logistics capabilities across Asia-Pacific, including 30,000 square meters of operational warehouse capacity and 130,000 square meters of committed expansion in Malaysia and Thailand. The added specialized footprint supports high-value, time-critical handling and sets a higher service benchmark for regional contract logistics solutions used by multinational shippers that route flows through Southeast Asian hubs serving Myanmar lanes.
- April 2025: DSV completed its EUR 14.3 billion acquisition of DB Schenker, creating a larger global forwarding and contract logistics network under one group. The integration strengthens the ability to bundle ocean, air, and inland services with standardized compliance and visibility processes, which is relevant for Myanmar shippers needing end-to-end control across volatile border and port operating conditions.
- May 2024: Maersk introduced its "No Shipping Instructions, No Load" rule for cargo, tightening documentation discipline ahead of vessel cutoff. The policy change pushes exporters and forwarders to digitize and standardize shipping instructions earlier in the process, reducing avoidable rollovers and improving predictability for Myanmar-linked maritime moves where port dwell time and procedural delays can be material.


Research Methodology Framework and Report Scope
Market Definition and Coverage
For this study, the market covers the value of freight transportation and logistics services delivered within Myanmar, including services used for domestic movements and cross-border trade flows that start or end in the country.
Scope exclusions: We exclude own-account logistics costs that stay inside a shipper's internal books, along with informal or unregistered transport activity that cannot be validated consistently.
Segmentation Overview
- End User Industry
- Agriculture, Fishing, and Forestry
- Construction
- Manufacturing
- Oil and Gas, Mining and Quarrying
- Wholesale and Retail Trade
- Others
- Logistics Function
- Courier, Express, and Parcel (CEP)
- By Destination Type
- Domestic
- International
- By Destination Type
- Freight Forwarding
- By Mode of Transport
- Air
- Sea and Inland Waterways
- Others
- By Mode of Transport
- Freight Transport
- By Mode of Transport
- Air
- Pipelines
- Rail
- Road
- Sea and Inland Waterways
- By Mode of Transport
- Warehousing and Storage
- By Temperature Control
- Non-Temperature Controlled
- Temperature Controlled
- By Temperature Control
- Other Services
- Courier, Express, and Parcel (CEP)
Data Sources, Market Sizing, and Validation
Desk Research
Desk research was first used to map Myanmar trade flows, transport infrastructure context, and cost drivers that shape freight demand across modes. We referenced public statistics and official publications such as Myanmar Customs and trade releases, the Central Statistical Organization, Ministry of Transport and Communications notices, port authority updates, and multilateral sources such as the World Bank and UN Comtrade, which help anchor import-export direction and commodity mix.
Next, we reviewed company filings and investor presentations (where available), association websites, and reputable press to understand service coverage, network footprint, and pricing movement over time. A paid subscription for import-export shipment-level data and a logistics supply chain and freight rate database were used selectively to cross-check corridor activity and typical rate ranges, especially where public time series is thin. The desk sources listed here are illustrative only, and many other public and paid references were also consulted for data collection, validation, and clarification.
Primary Interviews and Surveys
We conduct expert interviews and surveys with freight forwarders, carriers, warehouse operators, shippers, customs specialists, and transport officials in Myanmar. Their responses test secondary volumes, local rates, route constraints, informal activity, and service mix, while re-contact checks help resolve gaps and triangulate the final model.
Distribution of primary research fieldwork respondents
| Company type | Respondent position |
|---|---|
| Top tier: 30% | CXOs: 15% |
| Mid tier: 50% | Functional/Unit leaders: 35% |
| Smaller Players: 20% | Managers: 50% |
Market-Sizing & Forecasting
Sizing started from a top-down demand pool that is reconstructed from Myanmar trade and production signals, then translated into service spending by applying mode shares and service mix assumptions. To keep the totals grounded, we corroborated results with selective bottom-up checks, including sampled provider revenue bands, corridor-level rate benchmarks, and volume multiplied by average selling price for common movements.
Key inputs used in the model included import and export value trends, estimated tonnage mix for major goods, port throughput indicators, road and border corridor activity, warehousing utilization direction, and observed freight rate movement in main lanes. Where data gaps exist for smaller routes or informal movements, we used conservative proxy ratios tied to verified corridor activity, and then stress-tested the impact so the total does not get inflated.
Forecasts were built using scenario analysis supported by simple regression checks, where demand responds to the pace of trade recovery, infrastructure and port handling improvements, and changes in cross-border friction that affect dwell time and cost. Assumptions were adjusted only after primary respondents confirmed what is practically achievable in capacity and pricing over the forecast period.
Data Validation & Update Cycle
Outputs were validated through multi-step checks that compare the modeled total with independent signals such as trade value direction, corridor utilization, and freight rate movement. When a segment showed an unusual jump, we traced the driver back to a specific variable, then reworked the assumption or rechecked it through follow-up expert outreach before sign-off.
Each report is refreshed annually, and interim updates are made when material events affect trade, operating constraints, or cost structures. Before delivery, a final analyst review pass is completed so the market numbers and commentary reflect the latest available public releases and field feedback.
Mordor Intelligence's Myanmar Freight and Logistics Market Estimate Compared With Other Published Estimates
It is normal to see different market values for Myanmar freight and logistics because studies do not always count the same service boundaries, time periods, or pricing bases. Differences also come from how informal activity is treated, how cross-border services are allocated, and whether figures are stated as provider revenue versus broader logistics spend.
By tracking corridor-level activity and rechecking service-mix assumptions with field inputs, Mordor Intelligence keeps the estimate aligned to registered freight transport, freight forwarding, warehousing, and value-added logistics revenue rather than wider supply chain costs that are harder to validate in Myanmar.
Benchmark comparison
| Source | Market Size | Gaps in Research Methodology |
|---|---|---|
| Mordor Intelligence | USD 6.15 B (2025) | |
| Global Consultancy A | USD 6.55 B (2024) | Uses an earlier base year and applies a higher growth path, and it appears to treat corridor development and rate progression more aggressively without the same level of corridor-by-corridor validation. |
| Regional Consultancy B | USD 7.20 B (2024) | Likely includes a broader set of logistics-related activities, and it may capture informal or own-account movements in the total, which can push the value above provider revenue. |
Taken together, the spread is mainly explained by year selection, the boundary between provider revenue and broader logistics spend, and how informal activity is handled. With clear inclusions and repeatable checks tied to observable freight signals, the final number stays traceable and easier to use for planning.


Key Questions Answered in the Report
How large is the Myanmar freight and logistics market in 2026?
The market is valued at USD 6.35 billion in 2026 and is projected to reach USD 7.43 billion by 2031 at a 3.21% CAGR (2026-2031).
Which logistics function holds the highest revenue share?
Freight transport leads with 60.15% of 2025 revenue, dominated by road freight transport’s 71.12% revenue share.
What drives the fastest growth within courier services?
International CEP parcels linked to e-commerce expansion are forecast to grow at 4.88% CAGR between 2026-2031.
Why is cold-chain infrastructure expanding?
Rising agri-perishable exports and healthcare shipments require temperature-controlled storage, prompting 3.07% CAGR (2026-2031) growth in cold-chain warehousing.
How does political instability affect logistics operations?
Currency controls, shortened import licenses, and border security issues raise compliance costs and lengthen transit times, subtracting 0.7 percentage points from forecast CAGR.
What is the outlook for manufacturing-related logistics demand?
Manufacturing is the fastest-growing end-user segment at 3.42% CAGR (2026-2031), reflecting regional supply-chain diversification from “China + 1” strategies.
Page last updated on:


 Your data is secure and never sold or shared.


