
Music Market Size and Share
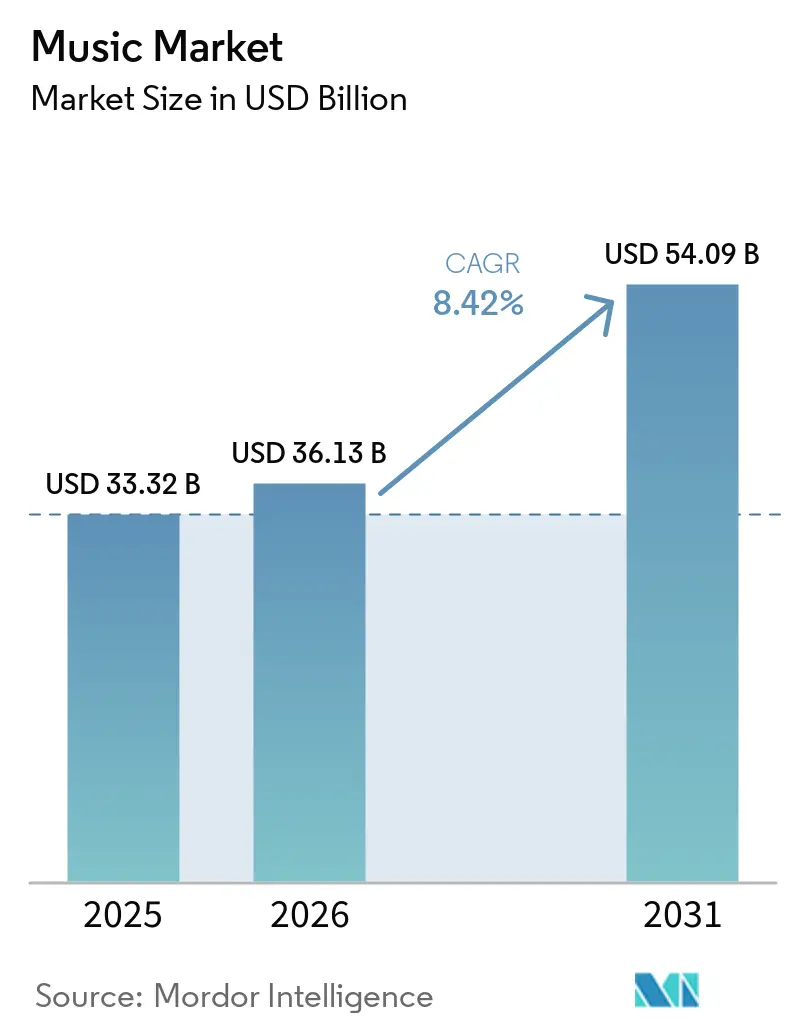
Music Market Analysis by Mordor Intelligence
The music market size is projected to expand from USD 36.13 billion in 2026 and USD 39.17 billion in 2027 to USD 57.74 billion by 2032, registering a CAGR of 8.07% between 2027 and 2032.
Paid streaming and India's smartphone base support digital music access, while social discovery connects audiences with repertoire on listening services. Catalog investment reinforces that opportunity when rights ownership is paired with marketing, distribution, and administration capabilities. Suppliers therefore compete to connect audiences with usable repertoire while preserving returns in negotiations with platforms and creators. Piracy and separate rights-clearance obligations constrain the conversion of listening into payable music use. Licensed AI applications built on participating artists' music add a further use for rights holders to license, so growth favors suppliers whose catalogs can be cleared for new products.
Key Report Takeaways
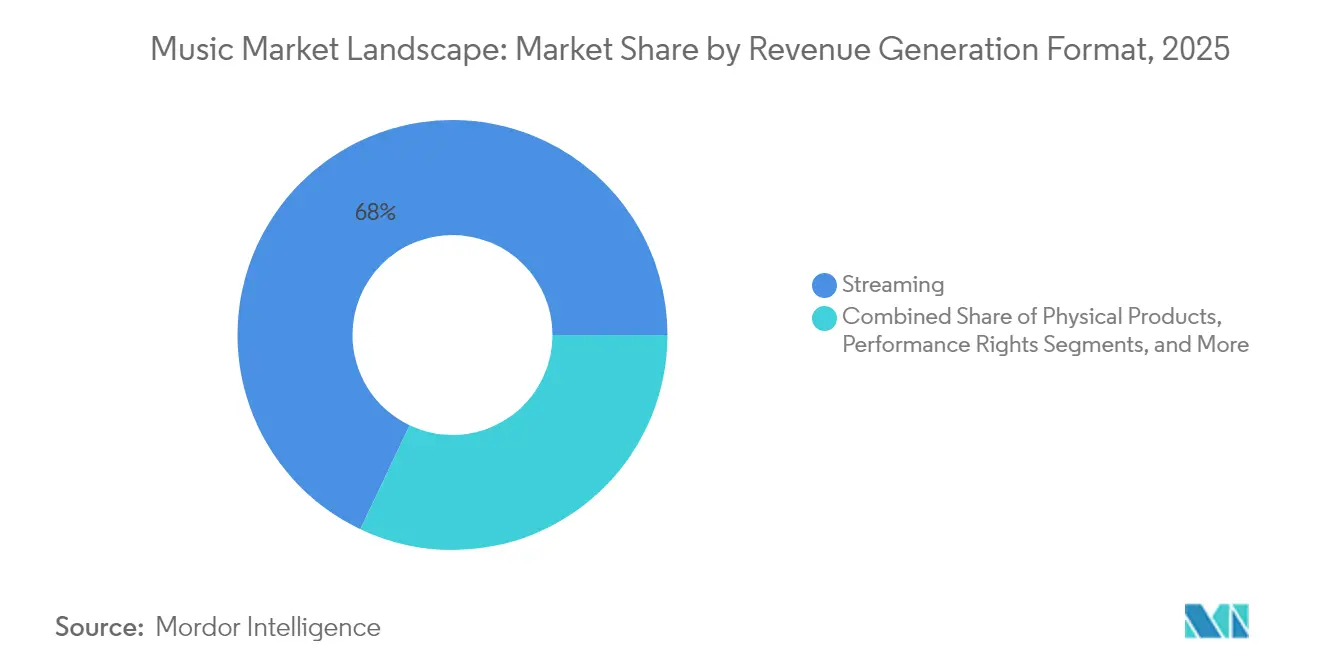
- By revenue generation format, streaming held a 68.54% music market share in 2026, while performance rights are forecast to grow fastest at a CAGR of 8.95% between 2027 and 2032.
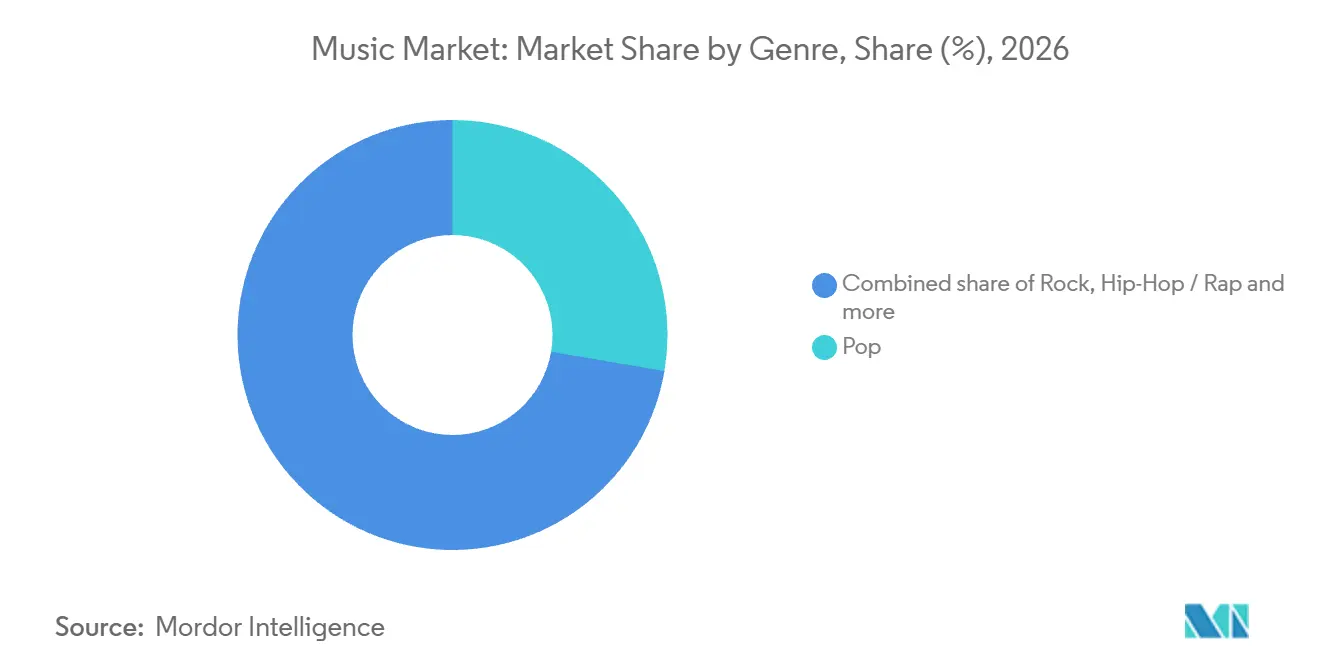
- Across genres, pop accounted for a 27.68% share of the music market size in 2026, and Latin is the fastest-growing segment with a projected CAGR of 8.6% between 2027 and 2032.
- In distribution, online platforms led with an 88.49% share in 2026 and are forecast to grow fastest at a CAGR of 9.55% between 2027 and 2032.
- Individual consumers led end-user revenue with an 81.64% share in 2026, while commercial establishments, including bars, hotels, and retail businesses, are forecast to grow fastest at a CAGR of 9.3% between 2027 and 2032.
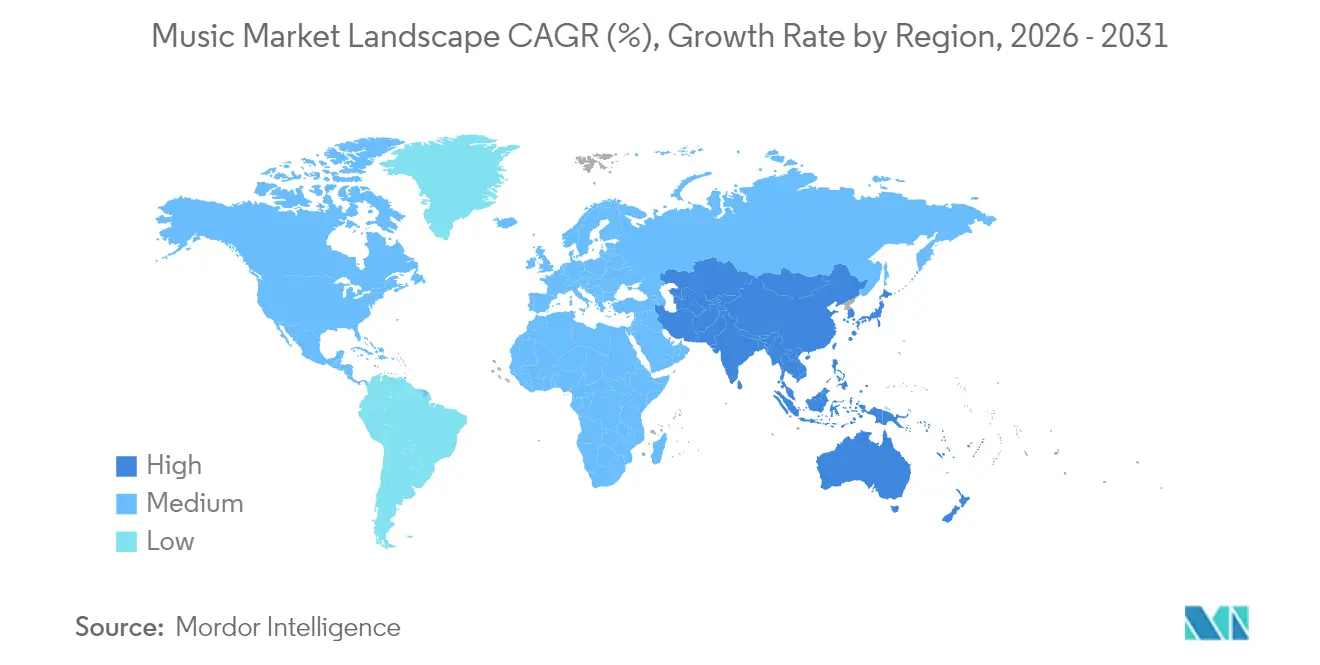
- Geographically, North America led with a 34.09% share in 2026, while Asia Pacific is the fastest-growing region with a projected CAGR of 8.8% between 2027 and 2032.
Note: Market numbers in this report are based on Mordor Intelligence's proprietary estimation framework, which combines nine months of actuals with Q4 projections for base year 2026.
Market Trends and Insights
Drivers Impact Analysis of Music Market*
| Driver | (~) % Impact on CAGR Forecast | Geographic Relevance | Impact Timeline |
|---|---|---|---|
| Accelerated adoption of music-streaming subscriptions | +4.8% | North America, Europe and Latin America | Short term (≤ 2 years) |
| Rising smartphone and internet penetration in emerging markets | +2.6% | Republic of India | Medium term (2-4 years) |
| Growth of social media and short-form video platforms fueling music discovery | +2.1% | United States of America | Short term (≤ 2 years) |
| Strong investment and catalog acquisitions by record labels and private equity | +1.6% | North America, Europe and Asia Pacific | Medium term (2-4 years) |
| Proliferation of immersive audio formats (Dolby Atmos, Sony 360RA) boosting ARPU | +0.8% | People's Republic of China | Medium term (2-4 years) |
| Blockchain-enabled direct-to-fan monetization models (NFTs, fractional ownership) | +0.3% | United States of America | Long term (≥ 4 years) |
| Source: Mordor Intelligence | |||
Accelerated adoption of music-streaming subscriptions
Paid subscriptions give rights holders a recurring revenue opportunity across an established listening audience. IFPI reported that paid-subscription streaming revenue grew 8.8% globally in 2025 and accounted for 52.4% of global recorded-music revenue.[1] This revenue mix concentrates recording suppliers' exposure to subscription demand, making continued paid access consequential for the industry's principal revenue channel.
Rising smartphone and internet penetration in emerging markets
Mobile distribution enlarges the audience that digital music suppliers can reach before any decision about paid listening. India's National Statistics Office estimated that internet use at least once in the prior 3 months among 15-to-29-year-olds increased between its 2022-23 and January to March 2025 surveys. Male use rose from 88.1% to 95.9%, and female use rose from 77.1% to 91.3%. India's National Statistics Office estimated that about 85.5% of households possessed at least one smartphone in its January to March 2025 telecom survey. Higher internet use among young Indians and widespread household smartphone possession create an access base for music services. Rights holders can consequently extend repertoire distribution through an existing household device base, reaching connected listeners without adding physical music outlets.
Growth of social media and short-form video platforms fueling music discovery
Short-form discovery becomes commercially useful when a song remains accessible after the video that introduced it. In the second quarter of 2025, about one-third of US social media users surveyed by Luminate said they used TikTok to discover new music and engage with music-related content. TikTok integrated YouTube Music into Add to Music App on July 29, 2025, allowing users to save songs discovered in videos directly to a YouTube Music playlist. This link provides a route from a discovery moment into saved repertoire that a listener can revisit on a music service. For labels, connecting discovery with saved listening makes the destination service part of a release's commercial distribution strategy.
Strong investment and catalog acquisitions by record labels and private equity
Catalog investment can expand the commercial use of repertoire when acquisition capital is paired with distribution capabilities. BMG, a division of Bertelsmann, made its highest first-half investment in music rights in company history during the first half of 2026. By March 31, 2026, the joint venture of Warner Music Group Corp. (WMG) and Bain Capital had acquired USD 650 million in recorded music and music publishing catalogs. The venture's July 2025 announcement assigned WMG responsibility for marketing, distribution, and administration through its worldwide infrastructure. This combination gives acquired rights a route to audiences and licensees through an established operator. Joint financing therefore leaves catalog commercialization concentrated with WMG, making its operating execution central to the investment's earning potential.
Restraints Impact Analysis of Music Market*
| Restraint | (~) % Impact on CAGR Forecast | Geographic Relevance | Impact Timeline |
|---|---|---|---|
| Persistent copyright infringement and digital piracy | -1.8% | North America, Europe and Vietnam | Long term (≥ 4 years) |
| Growing bargaining power of top creators driving royalty costs | -1.2% | United States of America | Medium term (2-4 years) |
| Fragmentation of licensing regimes in emerging markets delaying service launches | -0.7% | Republic of India | Medium term (2-4 years) |
| Rising carbon scrutiny of data-center energy use for streaming | -0.4% | European Union member states | Short term (≤ 2 years) |
| Source: Mordor Intelligence | |||
Persistent copyright infringement and digital piracy
Unauthorized access weakens a rights holder's ability to turn listening into licensed music revenue. In its 2025 annual report, Universal Music Group N.V. (UMG) said piracy adversely affected its business and expressed its belief that unauthorized activity substantially harmed music revenue. It described content protection as a key business focus while noting the difficulty of quantifying effects on legitimate revenue and subscriptions. In October 2025, IFPI reported that enforcement action in Vietnam led the operator of Y2mate.com and 11 other stream-ripping sites to agree to shut them down. Closing those sites through enforcement in Vietnam leaves content protection as a continuing cost for rights holders such as UMG.
Growing bargaining power of top creators driving royalty costs
Competition for commercially successful creators can make repertoire costs a constraint even when audience demand expands. Warner Music Group's fiscal 2025 filing described intense competition to sign and retain recording artists and songwriters. It warned that results could suffer if it could not secure economically attractive terms, including advance and royalty obligations. A larger contractual royalty entitlement leaves the music supplier with less revenue from each licensed use. Where advances precede earnings, they also create an upfront funding exposure for the supplier. These combined pressures can leave less of an expanding revenue base available for the next artist commitment, tightening the economics of building a competitive repertoire.
*Our forecasts treat driver/restraint impacts as directional, not additive. The impact forecasts reflect baseline growth, mix effects, and variable interactions.
Music Market Segment Analysis
By Revenue Generation Format:
Streaming Scale Meets Public-Use LicensingStreaming accounted for a 68.54% share of the music market size in 2026, making it the largest segment. IFPI reported that streaming revenue in its global recorded-music category exceeded USD 22 billion in 2025. Growth of 7.7% in 2025 thus expanded an already substantial global recorded-music streaming revenue base.
Performance rights are the fastest-growing segment, with a projected CAGR of 8.95% between 2027 and 2032. IFPI reported USD 2.9 billion in 2025 global recorded-music performance-rights revenue, up 0.3% in a fifth consecutive growth year, collected by music licensing companies mostly for public performance and broadcasting of recordings and music video. Digital downloads excluding streaming are forecast to contract, with US download-album units falling 9% to 15 million in 2025 versus 2024. Physical products provide superfans with a tangible way to express fandom, according to IFPI. In 2025, the PPL PRS Ltd joint venture of PPL and PRS for Music licensed hundreds of thousands of UK venues, making business-premises coverage consequential alongside licensing broadcasters.

By Genre:
Pop Leads While Latin Expands Commercial ReachPop represented a 27.68% music market share in 2026, making it the largest segment. BVMI identified pop as Germany's highest-revenue genre in audio streaming in 2025. Taylor Swift's “The Fate of Ophelia” debuted at No. 8 on the US Pop Airplay chart dated October 18, 2025, the chart's first top-10 debut in its 33-year history. US on-demand pop streams also grew 6.5% year over year in the first half of 2026, according to Luminate. Pop's US momentum thus extends beyond a record-setting radio debut for one song to rising genre-wide on-demand consumption.
Latin is the fastest-growing segment, with a projected CAGR of 8.6% between 2027 and 2032. RIAA reported US Latin wholesale recorded-music revenue of USD 542.2 million in the first half of 2026, up from the first half of 2025. Luminate reported 363.2 billion global Latin music streams in the first half of 2026, compared with 335.3 billion in the first half of 2025. Country reached listeners overseas on Spotify, where streams of American country music outside the United States grew more than 94% over the 5 years through 2026. Latin's larger global stream volume broadens the usage base relevant to repertoire licensing, while its US wholesale growth demonstrates monetization in a specific national business.
By Distribution Channel:
Platform Reach Expands as Store Coverage NarrowsOnline platforms were the largest segment with an 88.49% share in 2026 and are the fastest-growing segment, with a projected CAGR of 9.55% between 2027 and 2032. Spotify reported 777 million monthly active users across its audio platform in the second quarter of 2026, up 12% year over year. Spotify reported 300 million Premium subscribers in the second quarter of 2026, up 9% year over year.[2] These company measures demonstrate substantial online reach alongside a growing paid relationship within a service offering music and other audio. For Spotify, Premium subscriber growth lagged overall audience growth, making conversion of expanding reach into paid relationships a separate growth opportunity.
Offline and brick-and-mortar retail is forecast to contract, although individual retail categories face different conditions. The number of UK brick-and-mortar retailers selling music fell 17.5% to 1,632 in 2025 from 1,977 in 2024. Independent music retailers increased from 471 to 499 over the same period, while ERA attributed changes among multiples most likely to withdrawal from audio and video retailing or stocking. UK suppliers consequently face fewer physical outlets overall but more independent shops, making independent-retailer coverage a separate distribution decision from serving multiples.
By End User:
Consumer Access Dominates as Venue Services DevelopIndividual consumers were the largest segment, accounting for 81.64% of total revenue in 2026. IFPI reported 837 million users of paid music-streaming subscription accounts globally in March 2026. In Ireland, 56% of internet users aged 16 and older had subscribed to paid music-streaming services in 2025. From April 2025 to April 2026, TikTok's Add to Music App feature was used to save more than 6 billion tracks to premium music-streaming services. The scale of paid-account use gives music services a substantial audience to retain, while track saves identify repertoire listeners want available within those services.
Commercial establishments (bars, hotels, retail) are the fastest-growing segment, with a projected CAGR of 9.3% between 2027 and 2032. By March 2025, Accor had selected Soundtrack as its preferred music provider for hotels, restaurants, spas, and bars, while individual properties could choose whether to opt in. Media and entertainment producers use recorded music in films, TV, and gaming. Event and concert organizers have a separate licensing role in Canada, where promoters must pay a SOCAN license for covered paid in-person or online performances. A group-level provider selection opens a route to hospitality buyers, while optional property participation makes venue-level adoption decisive for the supplier's commercial reach.
Geography Analysis
North America Music Market
North America held a 34.09% music market share in 2026, making it the largest geography. US wholesale recorded-music revenue totaled USD 11.5 billion in 2025, net after returns. Canadian on-demand audio song streams reached 77.4 billion in the first half of 2026, up 3.6% from the first half of 2025. US premium paid-subscription units increased 5.5% to 111.1 million from 105.3 million a year earlier in the first half of 2026, expanding paid access alongside Canada's rising stream volume.
Asia Pacific Music Market
Asia Pacific is the fastest-growing geography, with a projected CAGR of 8.8% between 2027 and 2032. China's recorded-music revenue grew 20.1% in 2025. Spotify reported that royalties generated by Indonesian musicians' works on its platform increased more than 16% in 2025. Wahana Musik Indonesia distributed digital and overseas royalties for January to April 2025, while the national collective management organization, LMKN, handled distributions for May to September directly after data verification. Listeners outside Indonesia generated 60% of these Spotify royalties, making overseas consumption central to that repertoire's monetization.
Europe included 9 EU countries among the global top 20 recorded-music markets in 2025, while ZPAV estimated that streaming dominated Poland's recorded-music revenue that year. In South America, Brazil's recorded-music revenue grew 14.1% in 2025 and moved up one place to eighth globally. In September 2026, Winamp Group announced its subsidiary Bridger's signed agreement with Colombia's SAYCO covering performance and mechanical rights for offline and digital uses. Streaming dominated recorded-music revenue in the Middle East and North Africa in 2025, while South Africa contributed most of Sub-Saharan Africa's recorded-music revenue. For recorded-music suppliers, streaming-led distribution addresses Poland and MENA's revenue mixes, whereas a South Africa focus addresses Sub-Saharan Africa's national concentration.
Regulatory Framework and Outlook
This comparison covers selected jurisdictions and how their music-rights administration rules affect licensors. Digital mechanical licensing, collective-management governance and public-performance collection create different routes for earning from licensed music. The ratings assess music-rights licensors seeking predictable administration, enforceable rights and efficient royalty collection. These frameworks shape how repertoire becomes a commercial license and which organizations handle the associated obligations.
Regulatory Table of Music Market
| Decision factor | United States | United Kingdom | China | Brazil |
|---|---|---|---|---|
| Primary authority | Mechanical Licensing Collective for blanket-license administration | Intellectual Property Office | State Council copyright administration department | Ministry of Culture's Secretariat of Copyright and Intellectual Property |
| Key instruments or direction | Music Modernization Act, Title I | Collective Management of Copyright (EU Directive) Regulations 2016 | Copyright Collective Management Regulations, Article 23 | Copyright Law, Article 99, as amended by Law No. 12,853/2013 |
| Commercial effect | Central mechanical licensing for specified digital uses of musical works | Governance and transparency duties for UK collective managers | Written, nonexclusive collective licenses; reasonable user requests cannot be refused | Central public-performance collection for music works and sound recordings |
| Current policy attractiveness | High | High | Medium | Medium |
| Future direction of policy attractiveness | No change | No change | No change | No change |
| Source: Mordor Intelligence | ||||
The US rating reflects centralized mechanical-royalty administration, with the June 2026 continuation of administrator designations and the next review scheduled for January 2029 supporting continuity. UK governance and transparency support licensors, while January 2025 guidance addressed applications for extended collective licensing within an established framework. China's nonexclusive licensing and reasonable-terms duties limit collective licensors' discretion, supporting continuity because the general Copyright Law implementing-regulations draft discussed in August 2026 proposed no changes to those separate requirements. Brazil's centralized public-performance collection and government oversight balance access to collections with administration duties, while February 2026 appointments to an advisory collective-management committee reinforce review within that framework.
Value Chain Stages
This value chain compares how recording supply, online access and publishing administration turn music into supplier earnings. Universal Music Group's integrated business develops recordings and licenses compositions for third-party uses. That combination illustrates how one supplier can participate in several operations around the same repertoire. The structural distinction is between creating commercially usable recordings, providing access to audiences and administering the composition rights that also earn from music use.
Value Chain Analysis Table of Music Market
| Primary activity | Key participants | Value capture | Bottleneck | Resilience response |
|---|---|---|---|---|
| Recorded-music creation and commercial supply | Integrated recording businesses such as Universal Music Group N.V. | Recording sales and licensing receipts | Creative development before commercial return | Coordinate recording development, rights clearance and release commitments |
| Online music access | Online music-service operators such as Tencent Music Entertainment Group | Music subscription income | Fraudulent streams divert legitimate rights-holder income | Detect manipulated activity before allocating payouts |
| Publishing administration and remuneration | Music publishers such as Universal Music Group N.V. | Composition licensing and publishing revenue | Matching music uses with rights and entitled recipients | Verify entitlement and reconcile usage before distribution |
| Source: Mordor Intelligence | ||||
Spotify reported paying approximately USD 5 billion over 2024 and 2025 to publishers and organizations representing songwriters, with 2025 its largest annual music-publishing payout. That flow connects platform activity with earnings in the publishing part of the chain. IFPI's warning that fraudulent streams divert rights-holder revenue makes authentic usage commercially significant to that flow. For publishers, screening manipulated streams before payout protects the link between legitimate music use and remuneration, because diverted revenue reduces the funds available to entitled rights holders.
Competitive Landscape
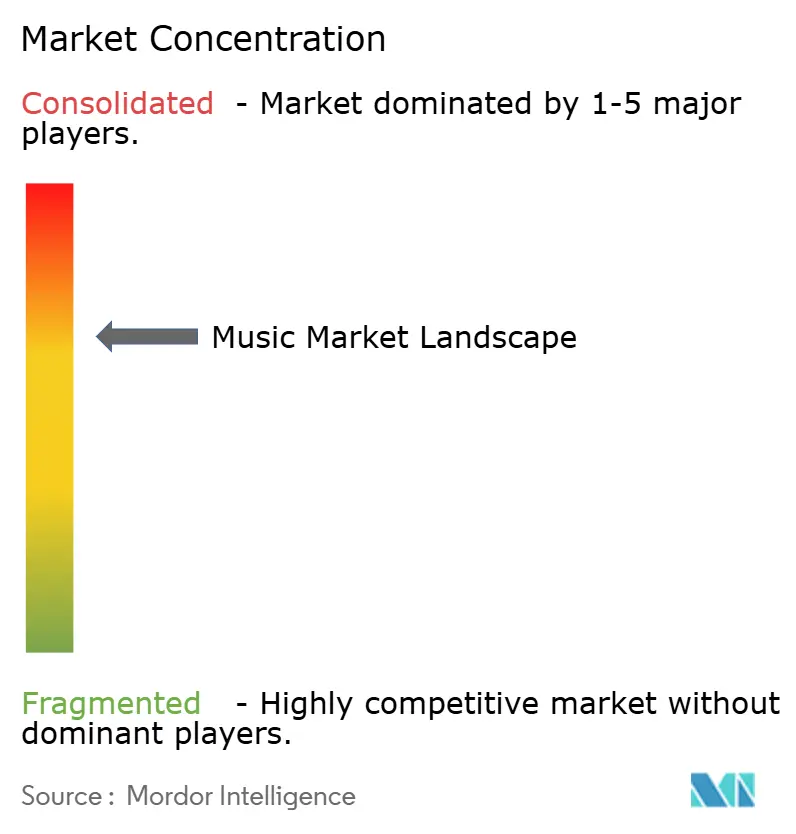
Competition has a concentrated core of established rights businesses alongside independent publishers and digital-platform counterparties. BMG completed its combination with Concord on September 1, 2026, bringing music publishing, recorded music, theatrical rights, digital distribution, and film and television under the BMG name.[3] Major participants include BMG Rights Management GmbH, Kobalt Music Group Ltd., Sony Music Entertainment (Sony Corporation of America), Universal Music Group N.V., and Warner Music Group Corp. Kobalt is an independent publisher, Sony operates labels, Universal Music Group combines recording, publishing, merchandising, and audiovisual businesses, and Warner holds recording and publishing rights. This structure gives repertoire owners opportunities to combine rights capabilities while leaving room for publishers differentiated by their licensing relationships.
In August 2025, Kobalt and Spotify entered a direct, multiyear US licensing agreement focused on songwriter terms. The agreement was designed to provide greater flexibility, efficiency, value, and protections for songwriters in the United States. BMG completed 30 acquisitions in 2025, including its largest catalog acquisition to date with Jason Aldean. Its activity also included rights to more than 1,000 songs from 23 other artists and songwriters. Catalog acquisitions expand supplier control over repertoire, while Kobalt's direct agreement addresses the platform terms attached to represented songwriters' works.
Warner and Suno announced an AI music partnership on November 25, 2025. Artists and songwriters were to have full control over whether and how their names, images, likenesses, voices, and compositions were used in new AI-generated music. Suno released its v6 model family on September 9, 2026, saying it was developed using licensed data from Warner Music Group, BMG, and Believe. Universal Music and Sony Music sued Suno on September 18, 2026, alleging it used their copyrighted music for AI training, with the suit focused on v6. AI platforms therefore need permissions covering the repertoire they use as well as creator participation, because a licensing partnership can coexist with claims from other rights holders.
Music Industry Leaders
-
BMG Rights Management GmbH
-
Kobalt Music Group Ltd.
-
Sony Music Entertainment (Sony Corporation of America)
-
Universal Music Group N.V.
-
Warner Music Group Corp.
- *Disclaimer: Major Players sorted in no particular order
Music Market Companies Covered in this Report
- Universal Music Group N.V.
- Sony Music Entertainment (Sony Corporation of America)
- Warner Music Group Corp.
- BMG Rights Management GmbH
- Kobalt Music Group Ltd.
- Spotify Technology S.A.
- Apple Inc. (Apple Music)
- Amazon.com, Inc. (Amazon Music)
- Alphabet Inc. (YouTube Music)
- Tencent Music Entertainment Group
- Deezer S.A.
- Tidal Music AS
- SoundCloud Global Limited & Co. KG
- Pandora Media, LLC (Sirius XM Holdings Inc.)
- NetEase Cloud Music (NetEase, Inc.)
- Anghami Inc.
- Kakao Entertainment (Melon)
- Yandex Music LLC
- Transsnet Music Limited (Boomplay)
- Saavn Media Limited (JioSaavn)
- KKBOX Inc.
- Curb Records, Inc.
- Believe SAS
- Audio and Video Labs, Inc. (CD Baby)
Key Opportunities for Market Participants
These opportunities compare routes for monetizing licensed repertoire through AI development, fan participation and social commerce. Independent artists' dataset licensing connects music suppliers with AI developers, while fan-facing platforms create potential uses for participating artists' recordings. Social-platform agreements can also provide a route toward music-related commerce for represented artists and songwriters. The commercial distinction is whether the supplier can package controlled rights into a transaction suited to the intended buyer.
Market Opportunities Table of Music Market
| Opportunity | Why now | Buyer / lead segment | Recommended play | Main barrier | Likely beneficiaries |
|---|---|---|---|---|---|
| Independent music datasets for AI licensing | LANDR announced the next phase of its opt-in Fair Trade AI program in July 2026 | AI developers licensing music datasets | Assemble eligible recordings from LANDR-distributing artists with full recording and publishing rights | Incomplete control of either rights layer and LANDR's dataset curation | Eligible independent artists and LANDR |
| Licensed fan co-creation | UMG and ElevenLabs announced a platform in development in September 2026 for participating artists' music | Fans seeking remixes, mashups and new interpretations | Prepare licenses for fan uses with participating artists | Product development before commercialization | Participating artists, songwriters and UMG as rights supplier |
| Music commerce linked to social discovery | UMG and TikTok announced expanded marketing, advertising and ecommerce opportunities in their May 2026 global license | Music fans reached by UMG artists and songwriters | Connect licensed music campaigns with artist merchandise transactions | Converting engagement into paid music-related transactions | UMG artists, songwriters and music merchandise suppliers |
| Source: Mordor Intelligence | |||||
The clearest opening is a dataset of independently controlled recordings with both recording and publishing rights available for licensing. Artists distributing through LANDR can bring eligible repertoire to its opt-in program, while LANDR may curate which tracks enter the datasets. Complete rights control therefore matters before an artist can compete for this additional licensing income.
Recent Industry Developments in Music Market
- Oct 2026: Spotify began gradually rolling out Music Quiz on October 6 to Premium listeners aged 18 and older in 11 countries, including India, with quizzes for more than 2,000 artists.
- Sep 2026: Winamp Group announced on September 30 that its subsidiary Bridger had signed an agreement with Colombia's SAYCO covering performance and mechanical rights for offline and digital uses.
- Sep 2026: Universal Music Group and ElevenLabs announced a multiyear licensing agreement on September 10 to develop an AI music creation platform based on licensed music and artist participation. The platform was in development, with ElevenLabs to launch it and the partners to develop AI audio products for artists and songwriters.
Music Market Report Scope and Research Methodology
Market Definition and Coverage
The global Music Market measures annual spending on monetized music products, access, and rights worldwide. It counts revenue from recorded music, music licensing, public performance, and music merchandise.
Scope exclusions: Musical instruments, audio equipment, and general-purpose playback devices, concert ticket receipts and event-organizer revenue unrelated to music rights, revenue from buyers' unrelated products, services, or productions, and non-monetized consumption and informal activity, including unpaid user uploads and piracy, are excluded.
Segments Covered in This Report
- By Revenue Generation Format
- Streaming
- Digital Downloads (ex-Streaming)
- Physical Products
- Performance Rights
- Synchronization Revenues
- Merchandising and Licensing
- By Genre
- Pop
- Rock
- Hip-Hop / Rap
- Electronic / Dance
- Classical
- Jazz
- Country
- Latin
- By Distribution Channel
- Online Platforms
- Offline / Brick-and-Mortar Retail
- By End User
- Individual Consumers
- Commercial Establishments (bars, hotels, retail)
- Media and Entertainment Producers (film, TV, gaming)
- Brands and Advertisers
- Event and Concert Organizers
- By Geography
- North America
- United States
- Canada
- South America
- Brazil
- Argentina
- Rest of South America
- Europe
- Germany
- United Kingdom
- France
- Spain
- Italy
- Russia
- Rest of Europe
- Asia Pacific
- China
- Japan
- India
- South Korea
- Australia and New Zealand
- Rest of Asia Pacific
- Middle East and Africa
- Middle East
- United Arab Emirates
- Saudi Arabia
- Turkey
- Rest of Middle East
- Africa
- South Africa
- Egypt
- Rest of Africa
- Middle East
- North America
Data Sources, Market Sizing, and Validation
Desk Research
Public measures are assembled from sources such as the Global Industry Association A Global Music Report 2026 for recorded-music revenue, format, and regional trends, CISAC's Global Collections Report for creators' royalty pools and territorial collections, the WIPO Magazine review for licensing and copyright context, and the Recording Industry Association of America's annual tables for format-level checks. These sources help distinguish trade revenue from royalty collections, consumer-format sales, and licensed uses that should not be added twice. Public statistics and industry association data are matched to the market's annual supplier and rights-holder revenue boundary and segment definitions.
Company filings, investor presentations, rights-organization publications, and reputable press provide supplementary revenue disclosures, transactions, pricing, and changes in platform or licensing activity for cross-checking. These named sources are not exhaustive, and further sources inform collection, validation, and clarification.
Primary Interviews and Surveys
The research plan uses structured interviews and targeted surveys with label and publisher leaders, streaming and distribution managers, licensing-society and merchandising executives, and regional market specialists across APAC, EMEA, and the Americas. Respondents are asked to explain supplier revenue recognition, rights collection, channel economics, and changes in audience demand so that secondary estimates and forecast drivers can be challenged at variable level. When disclosure is incomplete, analysts request ranges and definitions, compare answers with public filings and association data, and triangulate before carrying a proxy or documented uncertainty into the model.
Distribution of primary research fieldwork respondents
| Company type | Respondent position | Region |
|---|---|---|
| Top tier: 30% | CXOs: 20% | APAC: 40% |
| Mid tier: 45% | Functional/Unit leaders: 35% | EMEA: 30% |
| Smaller Players: 25% | Managers: 45% | Americas: 30% |
Market-Sizing & Forecasting
After reported company revenues are mapped to the counted supplier or rights-holder transaction and duplicate pass-throughs are removed, the top-down total is reconciled across revenue format, genre, channel, end user, and region. Segment shares draw on reported streaming and physical-format sales, subscription accounts and pricing, rights-collection data, company revenue disclosures, and geographic revenue splits. Selective bottom-up checks use supplier revenue roll-ups or sampled average selling price times units for physical products. Forecast scenarios relate paid-account growth and pricing, advertising-supported streaming revenue, rights collections and licensing activity, and physical unit sales and prices to annual market revenue, with category-specific assumptions reflecting the accepted forecast segments. Where regional, format, or licensing observations are missing, the nearest disclosed year and relevant public growth indicator bound the estimate, and selective supplier or channel checks test the resulting component before it is reconciled to the total. Primary specialists can challenge assumptions for each driver and identify accounting or rights-coverage differences before those assumptions are carried forward.
Data Validation & Update Cycle
Analysts triangulate market totals and segment shares against independent association series, rights-collection data, company filings, and suitable channel indicators, then check year-over-year movements, implied shares, and variances from comparable sources. Analysts review anomalies before sign-off and trace them to reporting period, currency, transaction boundary, or missing coverage. Unresolved material differences trigger clarification or respondent re-contact. The evidence is refreshed annually, revisited between cycles when material events alter licensing, pricing, or distribution, and subjected to a fresh pre-delivery review of sources, calculations, and forecast assumptions.
Mordor Intelligence's Music Market Landscape Market Size Compared Against Other Published Estimates
Published estimates can differ in the transactions and products they count and the inputs used to model demand. The global Music Market measures annual spending on monetized music products, access, and rights worldwide.
Key Gap Drivers include the study's defined coverage and market-specific modeling choices. Where regional, format, or licensing observations are missing, the nearest disclosed year and relevant public growth indicator bound the estimate, and selective supplier or channel checks test the resulting component before it is reconciled to the total.
Benchmark comparison
| Source | Market Size | Gaps in Research Methodology |
|---|---|---|
| Mordor Intelligence | USD 39.17 B (2027) | |
| Global Industry Association A | USD 31.7 B (2025) | At its 2025 base, this estimate is 19.1% below this report's 2027 value of USD 39.17 B, 2 years later. It measures recorded-music revenue, while this market also counts music merchandise and separately monetized rights revenue outside that category. |
| Global Consultancy A | USD 86.4 B (2025) | At its 2025 base, this estimate is 120.6% above this report's 2027 value of USD 39.17 B, 2 years later. It includes primary concert and festival ticketing and directly associated artist services, which fall outside this market's counted revenue. |
Mordor Intelligence's analysts triangulate market totals and segment shares against independent association series, rights-collection data, company filings, and suitable channel indicators, then check year-over-year movements, implied shares, and variances from comparable sources.
Key Questions Answered in the Report
What is the music market size outlook through 2032?
The size is projected at USD 39.17 billion in 2027 and USD 57.74 billion by 2032, with a CAGR of 8.07% between 2027 and 2032.
Which forces support growth in music revenues?
Paid subscriptions, smartphone access, and social discovery support growth. India's January to March 2025 telecom survey estimated that about 85.5% of households possessed at least one smartphone.
Which music revenue format holds the largest share?
Streaming held 68.54% of total revenue in 2026. Performance rights are forecast to grow fastest at a CAGR of 8.95% between 2027 and 2032.
Which companies shape music-rights competition?
Major participants include BMG Rights Management GmbH, Kobalt Music Group Ltd., Sony Music Entertainment, Universal Music Group N.V., and Warner Music Group Corp. Universal Music and Sony Music sued Suno over v6 in September 2026.
What constrains the commercial outlook for music suppliers?
UMG described piracy as an adverse business issue in its 2025 annual report. Warner Music Group identified conditional risks from advance and royalty terms in its fiscal 2025 filing.
Which regions lead music revenues and forecast growth?
North America led with a 34.09% share in 2026. Asia Pacific is forecast to grow fastest at a CAGR of 8.8% between 2027 and 2032.